Category Archives: Politics

Job Creation Falls Behind Rapid Population Growth

  • In 2024, Canada’s labour market showed modest growth, with job creation continuing but lagging rapid population growth. This led to an increase in the unemployment rate, reflecting a mismatch between labour force expansion and job creation rather than a decline in sector-specific labour shortages.
  • Ongoing challenges persist, such as declining labour productivity, sector-specific labour shortages, underemployment, demographic shifts and disparities, and regional imbalances.
  • Our international comparisons show that Canada typically ranks at or below the Organisation for Economic Co-operation and Development (OECD) average in terms of labour force participation and employment rates for certain population segments. This is largely due to weaker performance in specific regions, such as the Atlantic provinces, and pension policies that incentivize early retirement.
  • This labour market review emphasizes the need for tailored policies to improve labour market outcomes for seniors and immigrants. Recommendations include gradually increasing the retirement age, offering high-quality training support, and easing labour mobility barriers.

Introduction

The labour market is where economic changes most directly affect working-age Canadians, influencing their job opportunities and income. The supply of labour also determines the availability of Canadians’ skills and knowledge to employers who combine them with capital to produce goods and services that drive our national income and its distribution among income classes. Therefore, the labour market is one of the most important components of Canada’s – or any – economy.

In 2024, Canada’s labour market saw moderate growth, with employment rising to 20.7 million jobs. However, the employment rate declined to 61.3 percent, down from 62.2 percent in 2023, and remains below the pre-pandemic level of 62.3 percent in 2019. While over 1.7 million employed persons have been added since 2019, employment growth has lagged behind population growth, partly due to an aging population, despite high levels of immigration.1 The unemployment rate also increased, reflecting a gap between job creation and labour force expansion, partly due to limited absorptive capacity to keep pace with population growth.

Job vacancies have decreased since mid-2022, but over half a million positions remained unfilled during the third quarter of 2024 (12 percent higher than the pre-pandemic level). Of these vacancies, the majority were full-time (432,810 positions), with more than 31 percent remaining vacant for the long term – persisting for over 90 days. Despite high full-time vacancies, more than half a million workers were underemployed in 2024, seeking full-time work while employed part-time, indicating mismatches between the skills needed by employers and the skills offered by job seekers. Among sectors facing labour shortages, factors such as better relative wages and working conditions appear to be helping, particularly in industries like construction. Healthcare, on the other hand, may benefit from raising wages and reducing training costs to better attract and retain workers.

Further, Canada faces declining labour productivity, which can be attributed to factors such as stagnant capital investment and automation, high reliance on temporary foreign workers to fill low-paying positions, underemployment (including immigrants’ overqualification), a growing public sector with lower productivity, and shifts in industry composition.

This inaugural C.D. Howe Institute labour market review highlights major differences in the labour market across provinces and sectors and among socio-economic groups. It shows that labour force participation and employment of older workers and recent immigrants still have room for improvement.

Canada needs targeted workforce development policies to improve labour market participation and outcomes for diverse population groups and encourage a longer working life (Holland 2018 and 2019). Our recommendations are to:

  • Gradually raise the normal retirement age from 65 to 67 and delay pension access.
  • Support older workers with flexible work, part-time options, and self-employment, especially in the Atlantic provinces.
  • Invest in high-quality training programs for underrepresented groups, focusing on digital skills and job search strategies.
  • Streamline credential recognition and licensure for skilled immigrants and ease labour mobility in regulated occupations while maintaining the quality of professional services.
  • Enhance settlement strategies for immigrants, including workplace-focused language training.

Businesses should integrate automation and artificial intelligence (AI) to boost productivity while improving retention and encouraging later retirement by offering training2 and flexible scheduling (Mahboubi and Zhang 2023).Finally, better informing Canadians about learning and training opportunities and addressing financial and non-financial barriers would improve their training participation rates and empower them to acquire the skills needed in a changing labour market.

Overview of Canada’s Labour Market

Canada’s labour market has undergone major changes over time, influenced by factors such as the COVID-19 pandemic, globalization, technological progress, and demographic shifts. These forces have affected the functioning of the labour market, with demographic changes playing a particularly important role. This section reviews key indicators (i.e., labour-force participation, employment and unemployment) and highlights the major trends and disparities in provincial and national labour markets.

The labour force has grown steadily since 1976 but experienced a decline in 2020 due to the pandemic. The lockdowns and public health measures significantly reduced worker participation, especially among women, in the labour market. However, once the restrictions were lifted, workers returned, and the labour force fully recovered. By 2024, Canada had 22.1 million people in the labour force, an increase of about 1.9 million from 2019, mainly driven by the expansionary immigration policy that the country has followed until recently.3 Immigrants accounted for 56 percent of this increase in the labour force, while non-permanent residents made up 32 percent.4

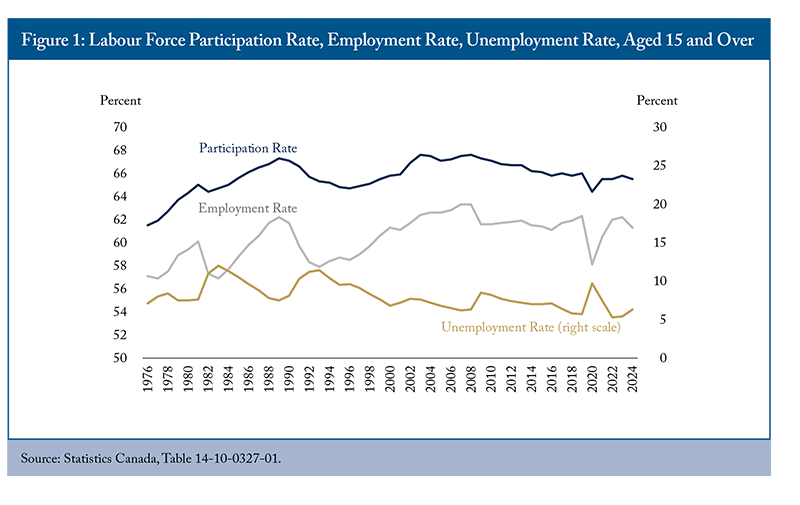
Although the labour force has grown over time, the labour force participation rate (LFPR) has trended downward over the last two decades. This trend is largely driven by an aging population, as participation rates drop sharply after age 54 and continue to decline with age. While the LFPR among prime-aged workers (25-54) reached a record high in 2023, the overall rate remained below pre-pandemic levels and declined further in 2024, reaching 65.5 percent despite high levels of immigration.5 Three factors contributed to this decline compared to pre-pandemic levels: a lower participation rate among youth, a substantial increase in the older population (aged 55 and over) and a decline in the latter group’s participation rate. This decline in older workers’ participation is primarily due to aging, as the proportion of seniors aged 65 and over within the 55-and-over age group increased from 54.8 percent in 2019 to 60 percent in 2024.

The employment rate is more sensitive to economic conditions and fluctuates with cyclical changes in the unemployment rate. It is also influenced by factors such as government policies on education, training, and income support, as well as employers’ investments in skill development and their effectiveness in matching people to jobs. Despite some volatility during economic booms and recessions, the employment rate trended upward until 2008 but has declined since then, mirroring the impact of an aging population on the participation rate (Figure 1). The pandemic caused a sharp decline in the employment rate, followed by a modest recovery. In 2024, the rate, however, declined again by approximately one percentage point to 61.3 percent, as employment growth (1.9 percent) failed to keep pace with the population growth (3 percent).

Regional disparities in employment persist across Canada. Alberta consistently maintains the highest employment rate, while Newfoundland and Labrador lags. Despite significant improvements since 1976, the Atlantic provinces continue to face challenges with employment. For its part, Ontario’s employment rate – historically the second highest in the country – has been below the national average since 2008. Regional differences in economic development, sectoral specialization patterns, educational attainment, family policy, and demographic characteristics are factors behind these employment disparities. For example, Newfoundland and Labrador and New Brunswick had the highest old-age dependency ratios (OADs) in 2024 at 39 and 37 percent, respectively, while Alberta remains the youngest province with an OAD ratio of less than 23 percent.6

The unemployment rate, a key short-term indicator, tends to rise during economic downturns and fall back during recovery, affecting employment outcomes in the opposite direction (Figure 1). The onset of the pandemic in 2020 led to a temporary surge in the unemployment rate to 9.7 percent – a four-percentage point hike from the previous year. As the economy recovered, the unemployment rate plummeted to a record low of 5.3 percent in 2022. However, by 2024, it had risen to 6.3 percent, a figure that remains relatively low by historical standards but higher than the pre-pandemic rate in 2019.

While employment grew by 1.7 million people between 2019 and 2024, the labour force expanded even faster, increasing by 1.9 million people. This imbalance – where the labour force grew more quickly than employment – pushed the unemployment rate higher, reflecting a loosening labour market and making it more challenging for job seekers to secure employment.

Overall, the labour force and employment in Canada have been expanding due to a surge in immigration. Despite unemployment rates remaining higher than the pre-pandemic level, this primarily reflects the exceptional growth in the labour force rather than a lack of job creation. The labour market continues to adjust to the increase in labour supply through strong job creation.

Looking ahead, several uncertainties and factors could influence unemployment rates. For example, the imposition of trade tariffs by the United States poses a direct risk to export-related jobs. In 2024, 8.8 percent of workers – equivalent to 1.8 million people – were employed in industries dependent on US demand for Canadian exports.7 Sectors most vulnerable to these risks include oil and gas extraction, pipeline transportation, and primary metal manufacturing.

On the other hand, stricter immigration policies that limit the inflow of permanent and non-permanent residents may reduce the growth of the labour force, which could, in turn, place downward pressure on the unemployment rate. However, the ongoing arrival of refugees, which contributes to the growing population of non-permanent residents, could lead to higher unemployment rates, particularly if newcomers face significant challenges integrating into the labour market.

To mitigate the negative impacts of aging on the labour market and address labour needs, it is important to encourage greater participation of underrepresented groups and seniors, ensure new entrants and young workers are equipped with the relevant skills to meet the labour market needs and enhance the productivity of the existing workforce. However, declining labour productivity poses an additional challenge that requires urgent attention.

Trends in Labour Productivity

Labour productivity8 in Canada has generally trended upward until the pandemic, but with a general downward trend in its growth rate. In 2020, average productivity surged to $68.5 per hour worked (in 2017 dollars), mainly driven by compositional changes in employment towards more productive jobs, particularly in the business sector, since most job losses were among low-wage workers. However, this gain proved short-lived; by 2023, productivity fell to $63.6, returning to nearly the same level as in 2019 (Figure 2).

Declining productivity has contributed to a reduction in real GDP per capita, which is a key indicator of Canadians’ living standards. Although Canada’s GDP rose by 6.9 percent (in 2017 dollars) between Q4 2019 and Q4 2023, GDP per capita decreased by 0.2 percent over that period. Since 2020, Canada’s GDP per capita growth has averaged an annual decline of 1.3 percent, compared to a growth rate of 1 percent per year between 2010 and 2019 (Wang 2022). Labour productivity continued to decline in 2024 as real GDP growth fell short of the growth of hours worked. This stands in stark contrast to the robust growth of labour productivity seen in the US during the same period.

Several factors, including human capital stock, skills utilization, overqualification, the concentration of immigrants in low-skilled jobs, limited capital investment, and slow adoption of technology, have likely contributed to recent poor labour productivity trends (Wang 2022; Robson and Bafale 2023, 2024). Notably, the combined influx of immigrants and non-permanent residents has driven the majority of employment growth between 2019 and 2024, accounting for 89 percent of the total increase in employment. Although immigrants and non-permanent residents are more likely than Canadian-born workers to have a university education, many are overqualified and work in jobs that require only a high-school diploma (Mahboubi and Zhang 2024). According to the 2021 census, the overqualification rate among immigrants9 and non-permanent residents was 21 percent and 32.4 percent, respectively, while only 8.8 percent of Canadian-born individuals with a bachelor’s degree or higher were overqualified (Schimmele and Hou 2024). With rising immigration, Canada’s productivity will increasingly depend on how effectively it leverages and develops the skills of new immigrants (Rogers 2024).

The recent influx of newcomers can help mitigate the impact of an aging population as they tend to be younger, typically being at their prime working age (Maestas, Mullen and Powell 2023). However, the concentration of immigrants and non-permanent residents in lower-skilled, low-paying sectors and occupations reduces productivity and, consequently, their contribution to GDP per capita. According to Lu and Hou (2023), between 2010 and 2019, non-permanent residents (work permit holders) were increasingly concentrated in several low-paying industries: accommodation and food services, retail trade, and administrative and support, waste management and remediation services.10 Collectively, these industries accounted for 45 percent of all temporary foreign workers in 2019. With the surge of non-permanent residents, one would expect the situation to have worsened in 2023 since the cap for hiring low-wage temporary foreign workers in 2022 increased from 10 percent to 30 percent in seven sectors, including accommodation and food services and to 20 percent for other industries.11 Similarly, Picot and Mehdi (2024) found that immigrants contribute approximately equal amounts of lower-skilled and higher-skilled labour, with 35 percent of those who landed in 2018 or 2019 working in lower-skilled jobs by 2021.

Relying on temporary foreign workers and immigrants to fill lower-skilled, low-paying jobs means that labour becomes a cheaper option than capital, which naturally disincentivizes businesses from investing in productivity-enhancing technology.12 Increases in the supply of labour also discourage business investment in skills upgrading for the existing workforce (Acemoglu and Pischke 1999).

Increases in labour supply without corresponding higher capital investment will also depress productivity. According to Robson and Bafale (2023), a larger labour force resulting from high immigration will not lead to higher living standards if workers are not equipped with better tools to produce and compete. Young and Lalonde (2024) also found that two-thirds of productivity declines since 2021 stem from this population shock.

Technological advancements, particularly digitalization and AI, offer opportunities to boost productivity. Mischke et al. (2024) find that digitalization and other technological advances could add up to 1.5 percentage points to annual productivity growth in advanced economies. Nevertheless, Canada has been slow in capital investment, automation and AI adoption.

The expansion of the public sector also poses challenges. Compared to 2019, public-sector employment increased by 19.6 percent in 2024, while private sector employment only saw an 8.5 percent increase. Consequently, public-sector jobs in 2024 accounted for 21.5 percent of all employment in Canada, up from 19.6 percent in 2019. However, public-sector productivity has lagged the business sector since 2019. In 2023, it was $58.20 per hour worked, 1.5 percent lower than its 2019 level and 1.5 percent below that of the business sector. With a higher share of public employment in the economy, this lower productivity in the public sector reduces overall labour productivity.

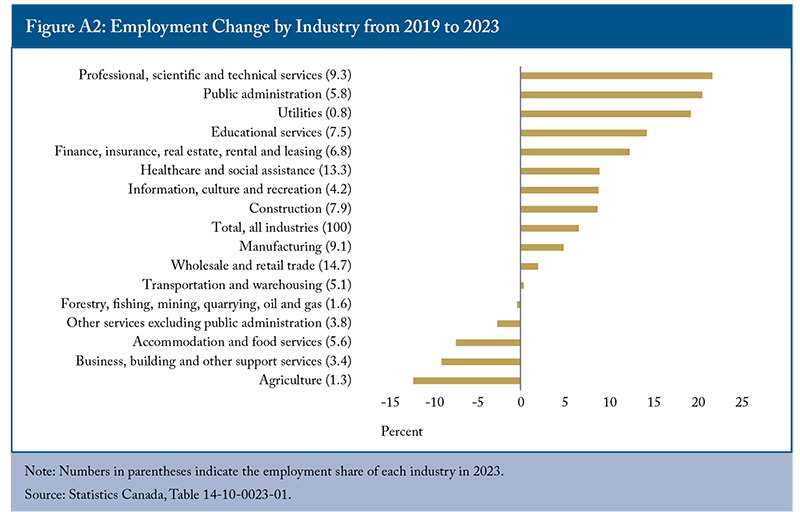
Lastly, significant variations in productivity across industries within the business sector shape Canada’s overall performance (Appendix Figure A1). Some industries, such as educational services, experienced notable productivity gains of 25 percent between 2019 and 2023. In contrast, some low-productivity industries faced substantial declines, with that of holding companies decreasing by 60 percent and construction and transportation dropping by 10 percent.13 Labour productivity in industries with the largest employment gains remained unchanged (professional, scientific, and technical services) or declined (public administration) during the same period (Appendix Figure A2). In contrast, agriculture and accommodation and food services witnessed productivity increases, likely due to investments in machinery and automation accompanying employment declines.

Therefore, the industrial distribution of jobs, shifts in industry composition, and demographic changes within industries can greatly affect Canada’s overall productivity. Tackling Canada’s productivity challenges will require substantial capital investment, targeted initiatives in skills development, technological advancements, and industry-specific strategies to promote sustainable economic growth.

Employment by Skill Level

Skill-biased technological changes – innovations that primarily benefit highly skilled workers, such as those proficient in technology, complex problem-solving, and critical thinking – have increased the demand for high-skilled labour in today’s job market. Despite the limitations of that approach, education has generally been used as a proxy for skills. In response to labour market needs, there has been a significant surge in higher education attainment among Canadians over time. The proportion of the population aged 25 and over having a postsecondary certificate, diploma or university degree rose from 37 percent in 1990 to 69 percent in 2024. According to OECD (2024), Canada has the highest postsecondary education attainment rate among core working-age individuals (25-64).

Despite these educational advancements, Canada faces productivity challenges and lags in technological adoption, particularly relative to the United States. One explanation is that although higher levels of education should translate into greater skills – leading to enhanced productivity, employability and adaptability to labour market changes – other factors such as education quality, experience, on-the-job training, capital investment, technological advancement, skill utilization, and age can substantially influence individuals’ skills levels (Mahboubi 2017b and 2019; Robson and Bafale 2023).

Skills and education levels heavily influence labour-market outcomes. For example, labour force participation, including among seniors, increases with educational attainment and those with higher education tend to remain in the labour market longer. This can mitigate some of the negative effects of an aging labour force, as significantly more seniors today possess a formal education above high school compared to decades ago and can take advantage of the ongoing shift from physical work to knowledge-based work.

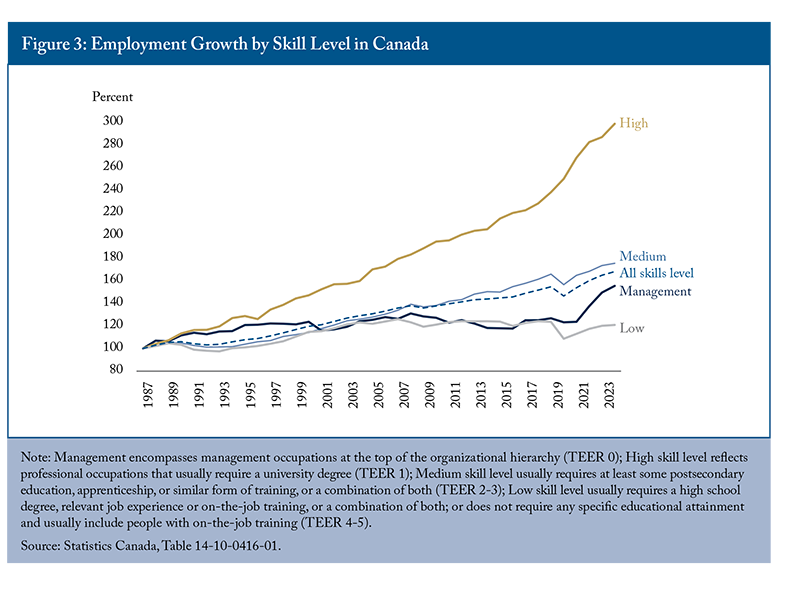
In parallel with increases in the supply of highly educated labour, there has been a shift in skills requirements among employers.14 Figure 3 shows employment in high-skill-level occupations has seen remarkable growth over the past three decades, increasing by 299 percent from 1987 to 2024. Notably, during the pandemic, employment in high-skill-level roles continued to grow, even as jobs in other skill categories declined. By 2024, high-skill-level occupations accounted for 23 percent of total employment. Despite this growth, medium- and low-skill-level occupations remain predominant, employing approximately 8.1 million and 5.8 million workers, respectively, compared to 4.8 million in high-skill roles. In the last two decades, immigrants and non-permanent residents have increasingly taken both high-skilled and low-skilled jobs. Between 2001 and 2021, they accounted for half of the employment growth in professional and technical skill occupations (Picot and Hou 2024). Over the same period, employment in lower-skilled occupations decreased by half a million. However, more immigrants and non-permanent residents increasingly occupied low-skilled positions, while Canadian-born workers significantly transitioned away from these roles (Picot and Hou 2024). By 2021, immigrants were more concentrated in professional and lower-skilled occupations compared to their Canadian-born counterparts.

In general, the Canadian labour market has performed well since the pandemic, with particularly strong employment growth for high-skill level occupations. As demand for high-skilled labour continues to grow, improving education quality, promoting on-the-job training, and better utilizing the skills of the workforce are essential for maintaining this balance, maximizing the benefits of educational advancements, enhancing productivity and meeting the evolving demands of the labour market.

Imbalances of Labour Supply and Demand

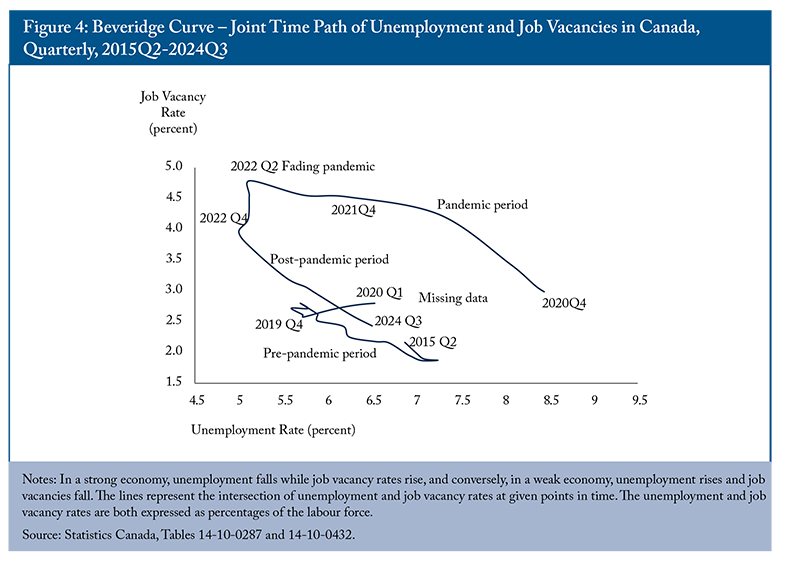
Studying the relationship between unemployment and job vacancies provides insight into labour supply and demand imbalances. It allows us to examine two problems that hinder business growth and slow the economy down: the lack of sufficient employment opportunities for job seekers and the absence of people with the right skills to fill existing jobs.

This relationship is often described by the Beveridge curve, which illustrates how job vacancy rates and unemployment typically move in opposite directions. However, as noted by Blanchard, Domash, and Summers (2022), shifts in this relationship can occur due to factors such as increased labour demand or structural changes in the economy, leading to both higher vacancy rates and higher unemployment simultaneously.

From 2021 to mid-2022, Canada experienced a tight labour market, with an increase in job vacancies alongside declining unemployment. In response, the federal government relaxed several immigration policies to help address these shortages. However, Fortin (2024, 2025) found that a surge in immigration, particularly driven by temporary immigrants, may aggravate job vacancy rates in the overall economy, as observed in Canada between 2019 and 2023. While immigration can initially alleviate skilled labour shortages, it can also intensify shortages in the broader economy due to increased demand from newcomers for goods and services.

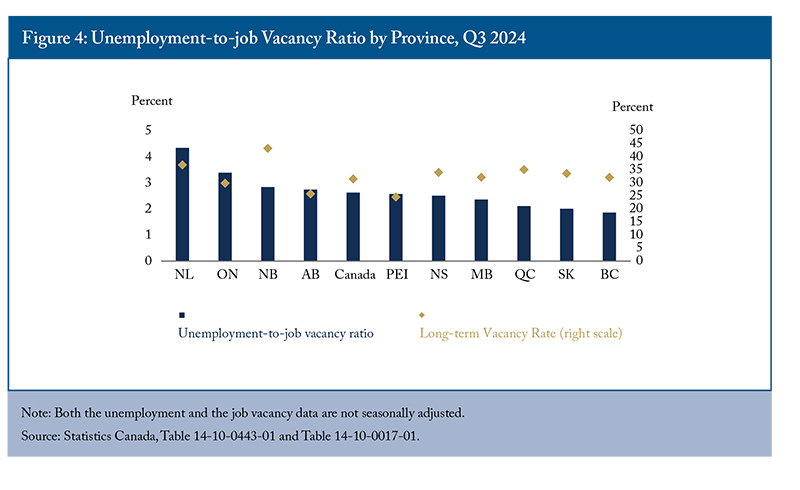
In 2024, the labour market transitioned from a state of tightness to a slackening one. In the third quarter of 2024, job vacancies in Canada totalled more than 572,000,15 marking a 12 percent increase compared to the pre-pandemic level in Q4 2019. With 1.5 million unemployed people in the labour market, there were more than two job seekers for every vacant position during that quarter. However, the provincial situations varied (Figure 4). For example, while British Columbia experienced a relatively tighter labour market, with fewer than two unemployed persons for each vacant position, there were more than four unemployed persons available per vacant position in Newfoundland and Labrador. However, the long-term vacancy rate – the share of openings that remained vacant for 90 days or more in total vacancies – in that province was 36.9 percent, which was four percentage points higher than the British Columbia rate in the third quarter of 2024. This indicates both limited employment opportunities for those unemployed and a mismatch between existing skills and those demanded by employers.

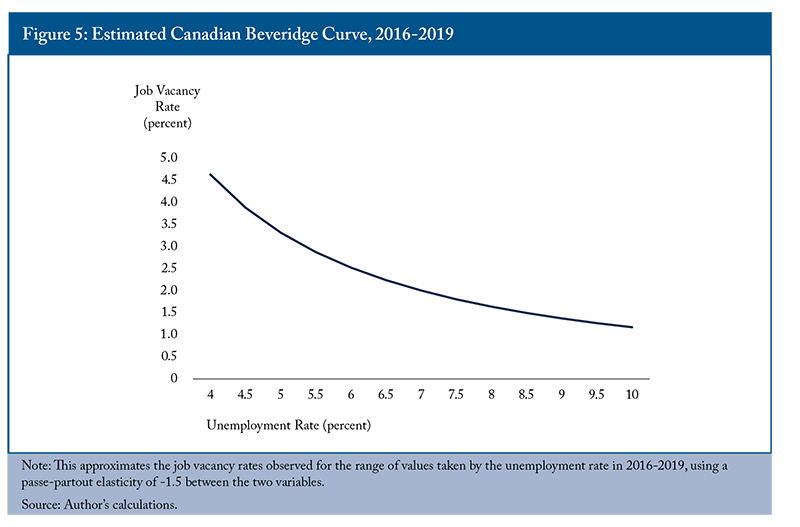
Imbalances between labour supply and demand in Canada also exist at the industry level (Figure 5). For example, while the healthcare sector faces severe labour shortages, the information, culture and recreation industry has the highest unemployment-to-vacancy ratio, indicating an excess labour supply. One interesting observation is that while both the construction and manufacturing sectors had similar levels of excess labour supply, the vacancy rate in construction was significantly higher at 3.6 percent, compared to 2.2 percent in manufacturing. This suggests that employers in the construction sector face more challenges in finding workers with the right skills.

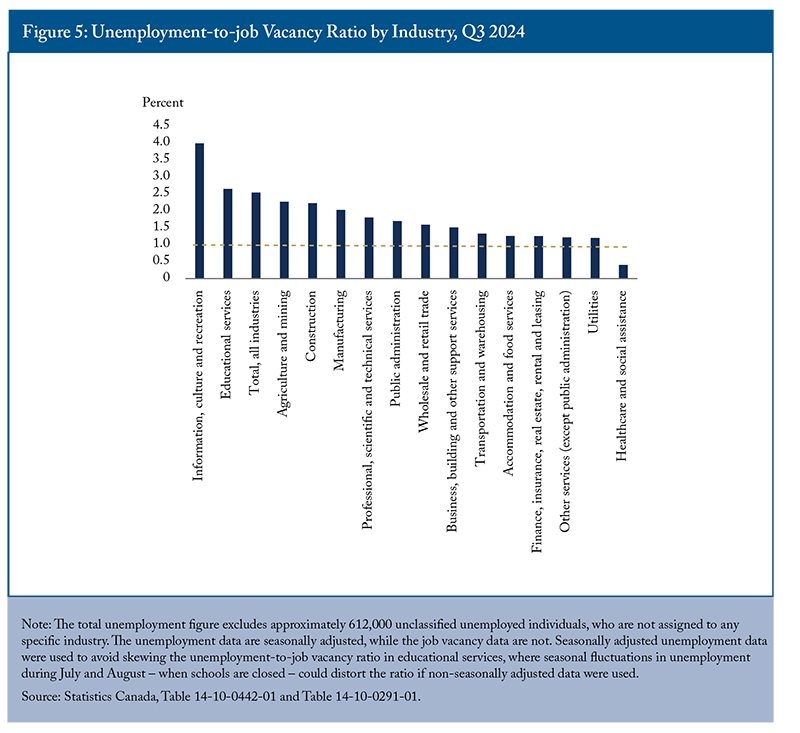
The unemployment-to-job vacancy ratios across industries excluded some 612,000 unclassified unemployed persons: those who had never worked before or were employed more than a year earlier. According to Statistics Canada, about 43 percent of job vacancies in the third quarter of 2024 were for entry-level positions, which is helpful for those unclassified unemployed persons as these roles typically do not require prior experience. However, the specific skills and education requirements of these entry-level positions remain unclear.

An analysis of educational requirements for vacancies in the same quarter shows that 48 percent of all job vacancies required post-secondary training or education. Positions requiring post-secondary education below a bachelor’s degree had an unemployment-to-job vacancy ratio of 2.6, while those requiring a bachelor’s degree or higher faced a higher ratio of 4.1. In contrast, vacancies requiring only a high-school diploma or less had a lower unemployment-to-job vacancy ratio of 1.8. However, employers find it more challenging to secure suitable candidates for positions requiring higher educational levels and specialized skills, particularly at wage levels that candidates are willing to accept.

Wages play an important role in reducing labour market imbalances, as they affect both the supply and demand for labour and encourage labour mobility and reallocation. Between Q4 2019 and Q3 2024, the average offered hourly wage saw the largest increases in industries such as arts and entertainment, agriculture, and information and cultural industries (over 30 percent). These sectors also experienced the most significant reductions in job vacancies, suggesting that offering higher wages can help alleviate labour shortages. To address shortages more broadly, there may also need to be a restructuring of relative wages and working conditions between occupations with labour shortages and those with surplus labour.

Offered wage, or stated salary, rates for vacant positions should largely depend on the growth of job vacancies and the difficulties in finding candidates to fill them. However, Figure 6 shows that industries experiencing a surge in vacancies post-pandemic did not respond consistently. In fact, the average hourly offered wage in these industries fell short of the national average, which was 27 percent between Q4 2019 and Q3 2024. For example, despite substantial growth in vacancies and a shortage of candidates in healthcare, the average offered wage growth in this industry only increased by 23 percent. This is largely due to government control over wages, making them less responsive to market forces. Policies like Ontario’s Bill 124, which capped annual wage increases at one percent for civil servants from 2019 to 2022, have contributed to this restraint. Additionally, multi-year labour contracts and provincial efforts to reduce deficits and debt post-COVID have further limited wage growth in the sector.

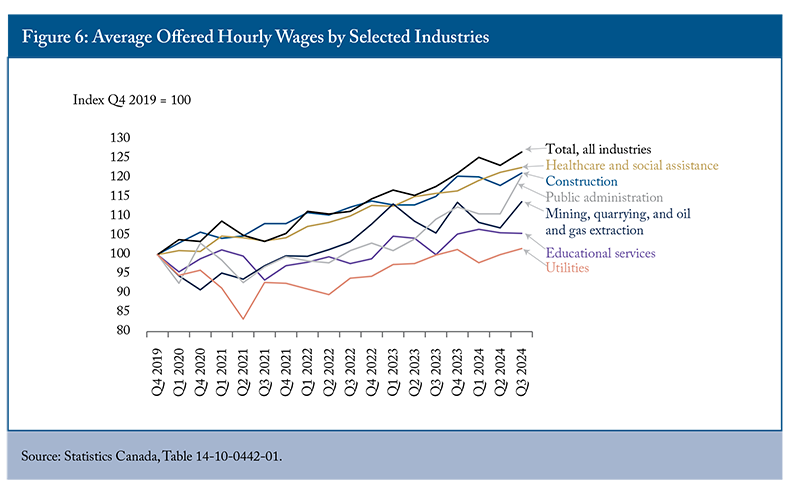
In Q3 2024, the average hourly offered wage in the utilities sector only increased by 2 percent compared to the pre-pandemic level, despite a 48 percent increase in job vacancies. Employers in this sector need to raise wages to attract and retain workers with the necessary skills. Otherwise, they will rely on their current workforce to work longer hours to maintain operations, which can lead to lower productivity per additional hour of work and retention challenges.

The average offered wage rate by occupation follows a similar trend (Appendix Figure A3). For example, despite a 59 percent increase in job vacancies, the wage rate for occupations in education, law and social, community and government services only rose by 16 percent, which is below the national average. This further highlights the need for employers to raise wages and improve working conditions to attract and retain workers.

Outcomes by Demographic Characteristics

While labour market indicators point to a strong post-pandemic recovery characterized by high employment, not all working-age Canadians have equally participated in and benefited from this resurgence, highlighting untapped potential across different population groups. Notably, recent demographic trends highlight that the older population and immigrants experience distinct labour market outcomes. Seniors (aged 65 and over) have substantially lower labour force participation rates compared to other demographics, raising concerns about both their economic security and potential contributions to the workforce. Additionally, immigrants frequently face employment barriers that limit their ability to fully integrate into the labour market and contribute to addressing the challenges posed by an aging population. Understanding the labour market outcomes for these groups is important for identifying the obstacles they face and formulating targeted policy recommendations to enhance their participation and success in the workforce.16

Age

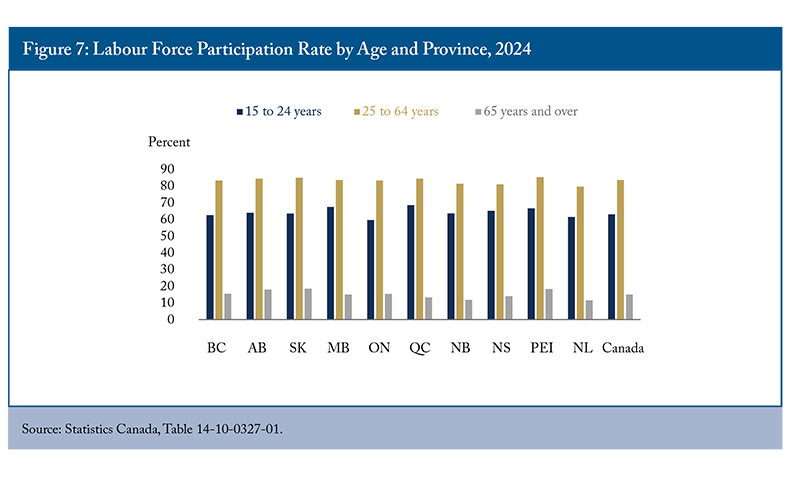
There are significant variations in labour force participation across age groups. As expected, seniors exhibit the lowest participation rates, with their engagement in the labour market declining substantially after age 65 (Figure 7). Seniors’ participation rate is low across all provinces, albeit with varying degrees. For instance, Saskatchewan has the highest participation rate for seniors at 18.5 percent, while Newfoundland and Labrador records a notably lower rate of 11.5 percent. The four provinces in the Atlantic region, where the aging problem is more severe, have the lowest participation rate. A lack of employment opportunities for seniors in this region seems to be a major driver, with their unemployment rate significantly higher than both the national average and their counterparts aged 25 to 64 (except for Nova Scotia) (Figure 8).

While seniors participate far less than other Canadians in the labour market, Figure 9 shows significant shifts in their average retirement age over time and notable differences across employment types. Self-employed workers consistently retire later than other workers, with their average retirement age exceeding 68 in recent years, while public sector workers tend to retire earlier. These trends likely reflect variations in pension structures, job security, and financial incentives across employment types. Between 1976 and 1998, the average retirement age of all workers declined by four years to 60.9, likely influenced by the introduction of early retirement pension schemes in order to free up jobs for younger workers (OECD 2017). However, this shift had no obvious impact on younger workers’ employment. Many economists also warned that these measures were shortsighted, as the aging of the baby boomer generation would eventually create new challenges. Meanwhile, concerns about the financial sustainability of pension systems grew due to the increasing life expectancy and subsequent rising costs of providing retirement income (Banks et al. 2010; Herbertsson and Orszag 2003; Jousten et al. 2008; Kalwij et al. 2010; OECD 2017).

In response, the federal government in 2012 increased financial penalties for early retirement to encourage longer working lives.17 Consequently, the average retirement age of all workers began to rise and reached 65.3 in 2024, slightly surpassing its 1976 level. However, the persistent gap between the public sector and self-employed workers suggests that policy adjustments – such as pension reform or incentives for longer careers in the public sector – could be considered to encourage more uniform retirement patterns across employment types. The recent influx of immigrants may also help to alleviate the impact of the retirement wave, as immigrants are more likely to keep working and retire later. According to Fan (2024), the average retirement age among immigrant workers is around 66 over the last decade, two years older than that for Canadian-born workers.

Accordingly, the LFPR of seniors has increased substantially from a historical low of 6 percent in 2001 to 15 percent in 2024. Termination of mandatory retirement, lack of sufficient savings, higher educational attainments, and better health conditions among seniors have contributed to these LFPR increases.18 Hicks (2012) predicts that social and economic pressures will lead to further delay in retirement in the future. For example, of all seniors aged 65 to 74, including both Canadian-born and immigrants, one in ten were employed in 2022 (Morissette and Hou 2024). Nine percent reported working by necessity, while immigrant seniors were more likely to do so than their Canadian-born counterparts.

In the long run, labour productivity growth is the primary driver of Canada’s GDP per capita growth, though the participation rate of seniors can also have a significant impact. Wang (2022) found that during the pandemic, declines in employment and participation rates driven by young people and seniors were major contributors to the sharp drop in GDP per capita. He estimated that if work intensity, the employment rate, and the participation rate had maintained their pre-pandemic momentum from 2010 onward, Canada’s GDP per capita could have been 4 percent higher in 2021 than it was.

As babyboomers are gradually retiring, their lower LFPR will continue to influence the overall participation rate. Vézina et al. (2024) found that the overall participation rate is expected to continue declining in the short term, regardless of the number of immigrants selected. Across various scenarios, the overall participation rate appears to be more sensitive to changes in the participation of seniors than to increases in immigration.19 As a result, keeping older workers, particularly those aged 55 and over, in the labour market could significantly impact the future overall participation rate. As more older workers remain employed, improvements in employment assistance, labour market flexibility, and skills upgrading will be essential (Vézina et al. 2024).

International Comparisons of Pension and Retirement Policies

An international comparison reveals that differences in pension and retirement policies play a crucial role in explaining disparities in employment and retirement decisions across countries (Figure 10). Factors such as the flexibility to choose between continuing to work or claiming a pension, legal provisions regarding age-based termination of employment, and employers’ retention strategies – such as offering on-the-job training and flexible work schedules – greatly influence retirement timing.

One of the most significant factors contributing to the variation in employment decisions across OECD countries is the normal age at which individuals can claim full pension benefits. For instance, in 2022, over 32 percent of Iceland’s population aged 65 and over was employed, although the normal retirement age is 67, with the earliest pension access at age 65. In contrast, only about 14 percent of Canada’s population in the same age group remained employed despite having a higher life expectancy. This discrepancy can be explained by Canada’s normal retirement age of 65, with pension benefits available as early as age 60.

Cross-country analyses show that policy reforms reducing financial incentives for early retirement were key drivers behind the increase in old-age employment (Coile et al. 2024). To address challenges related to aging populations, many countries such as Australia, Denmark, the UK, Japan and Italy have raised, or plan to gradually increase, the retirement age to encourage longer working lives. Denmark and Sweden have even indexed their mandatory retirement ages to life expectancy. Canada should consider similar approaches by raising the normal retirement age and delaying the earliest access age.

Immigrants

International immigration has significantly contributed to Canada’s population and labour force growth. Between 2019 and 2024, immigrants and non-permanent residents accounted for 68 percent of the population growth and over 88 percent of the increase in the labour force. However, immigrants often encounter various obstacles such as language barriers, a lack of Canadian work experience and varying recognition for foreign education and experience (Mahboubi and Zhang 2024). These challenges can limit their employment opportunities and earnings. Furthermore, as Canada faces an aging population, the challenge of integrating immigrants into the workforce becomes even more critical. While aging workers often possess valuable experience, they may struggle with the physical demands of certain jobs or require retraining. Newcomers, on the other hand, may not be immediately equipped to fill these gaps in employment. The productivity levels of immigrants can also be affected by their integration into the labour market, as they may require additional training and support to navigate workplace expectations and cultural nuances.

In 2024, immigrants aged 25 to 54 had a lower employment rate (by 4.3 percentage points) compared to non-immigrants (Figure 11). This gap has narrowed since 2006 and continued to decline even through the pandemic despite the latter’s greater impact on immigrants.20 The remaining gap is mainly due to the lower employment rate of female immigrants.

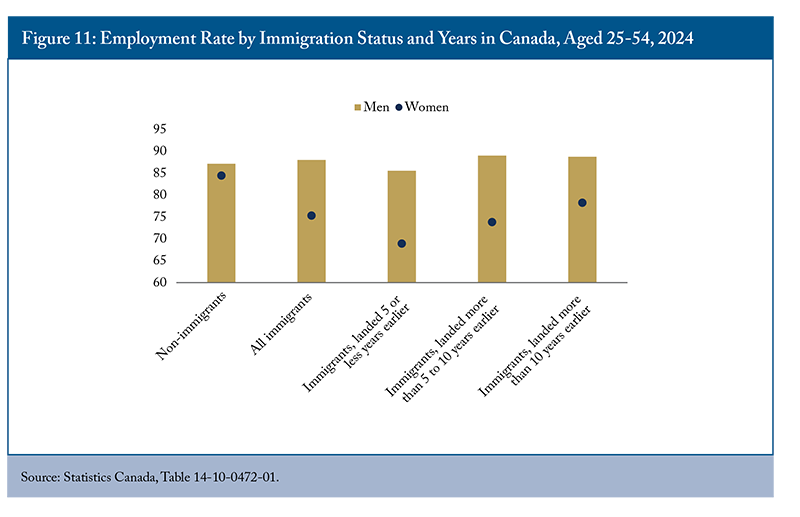
Employment outcomes of immigrants, particularly among women, depend predominantly on the number of years spent in Canada. For women aged 25-54, the employment gap between female non-immigrants and more recent immigrants (who landed less than 5 years) was 15.5 percentage points. This gap narrowed to 10.6 percentage points for immigrants who landed between 6 and 10 years and further to 6.2 percentage points for those who have been in Canada for more than 10 years.

Over the last decade, the improvements in immigrant employment rates are likely attributed to several factors. These include an increased selection of economic immigrants from non-permanent residents with Canadian work experience, the implementation of the Express Entry21 system for immigration selection, and favourable economic conditions where the demand and supply of immigrant labour are broadly aligned (Hou 2024). In addition, the growth in managerial, professional, and technical occupations accelerated in the late 2010s (Frenette 2023), which would benefit recent immigrants with a university education. Recent immigrants in the prime age group of 25 to 54 have seen faster employment rate growth since the early 2010s, with a notable increase of 13.1 percentage points from 2010 to 2024, compared to a 3.5 percentage point increase among non-immigrants.

However, it’s important to note that some of these conditions may change in the short term. For example, the employment rate for recent immigrants stalled from 2022 to 2023, a period when labour shortages eased, and levels of both permanent and non-permanent immigration rose rapidly (Hou 2024). As such, the dynamics of labour supply and demand have changed, particularly with the increases in the labour supply of new immigrants and non-permanent residents coupled with a cooling labour market and rising unemployment. This could negatively affect the employment outcomes of foreign-born residents in Canada more than those of Canadian-born individuals, as immigrants are often disproportionately affected during economic downturns. In 2024, there was a large increase in the unemployment rate of recent permanent immigrants, rising from 8 percent in 2023 to 9.9 percent. This is more than double the unemployment rate of non-immigrants, indicating the difficulties recent immigrants face in securing employment.

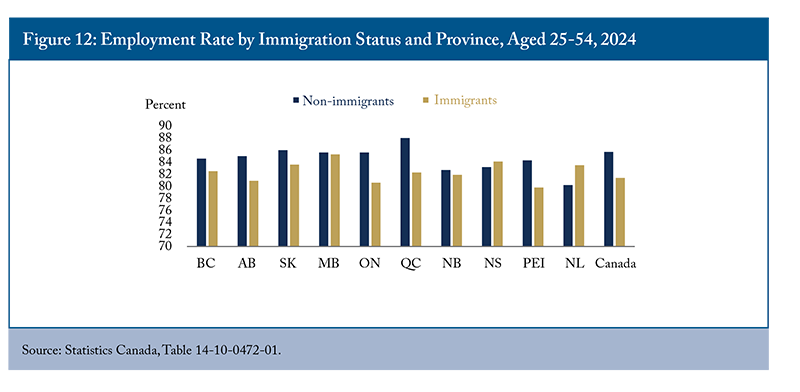
The employment rate of immigrants residing in some provinces is lower than the national rate, such as Ontario and PEI (Figure 12). The relatively poor employment outcomes among immigrants in these provinces may stem from specific employment barriers unique to immigrants, as the unemployment rate of non-immigrants in these provinces remains below the national rate. However, immigrants in Newfoundland and Labrador have a higher employment rate than non-immigrants. In contrast, the employment gap between immigrants and non-immigrants is most pronounced in Quebec, a province with the highest employment rate for non-immigrants in Canada. This gap can, to some extent, be due to a large gap in the unemployment rates of these two population groups. The unemployment rate of immigrants in Quebec is twice that of non-immigrants (or a gap of 3.5 percentage points). Grenier and Nadeau (2011) show that the lack of knowledge of French largely explains why the employment rate gap between immigrants and non-immigrants is larger in Montreal than in Toronto. Greater emphasis on official language training could enhance their ability to fully participate in the local labour market.

Policy Discussion

While the Canadian labour market has shown resilience post-pandemic and continued to perform relatively well in 2024, significant disparities across regions, industries, and demographic groups highlight opportunities to improve participation and employment outcomes. Further, Canada’s declining productivity poses a challenge to the labour market’s ability to drive sustained economic growth and competitiveness.

Demographic shifts, particularly an aging population, continue to affect participation rates and contribute to some shortages. Notably, the expansion of the health industry and the associated labour shortages are closely tied to Canada’s aging population. However, in some industries, average offered wages have not risen enough to attract a larger labour supply, and employers have not sufficiently adopted alternative strategies, such as capital investment and automation, to address their workforce needs.

Addressing these challenges requires a holistic approach. Beyond automation and higher wages, investing in existing workers and removing barriers to labour-market participation by underrepresented groups – such as women, youth, Indigenous Peoples, and seniors – can significantly improve labour market outcomes.

Regional differences in economic conditions contribute to provincial variations in the participation of seniors, while differences in pension and retirement policies play an important role in driving discrepancies in retirement timing across countries. Gradually increasing the normal retirement age is a strategy adopted by some countries to encourage later retirement among seniors. In Canada, the federal government in Budget 2019 offered a way to make later retirement financially more attractive by increasing the Guaranteed Income Supplement (GIS) earnings exemption, allowing seniors to retain more of their increased income if they choose to work. However, provincial measures aimed at boosting older workers’ labour force participation have had mixed results. For instance, Lacroix and Michaud (2024) found that a tax credit in Quebec designed to boost employment among older workers had no significant impact on transitions in or out of the labour force, with only modest effects on earnings for those aged 60 to 64. The study concluded that this measure was not a cost-effective way to increase public revenue or employment rates for older workers.

While the Conservative government in 2012 announced a plan to gradually raise the eligibility age for Canada’s Old Age Security benefits from 65 to 67 starting in 2023, the newly elected Liberal government cancelled the plan in 2016. However, with an aging population and increasing longevity, Canada should reconsider gradual adjustments to the normal retirement age and the earliest access age to help sustain public pension systems and ease demographic pressures. This approach aligns with successful international models, though it requires careful implementation to account for differences in job types and income levels.

Seniors today are healthier and living longer, and delaying retirement can offer both personal and economic benefits and ease demographic transitions (Robson and Mahboubi 2018). Longer working lives allow individuals to accumulate greater retirement savings, reducing the risk of financial insecurity in old age. Working longer has also been linked to better cognitive function, mental well-being, and social engagement.

That said, raising the retirement age would affect workers differently depending on their occupations and financial situations. While high-income, knowledge-based workers may benefit from extended careers through flexible work arrangements or hybrid options, many low-income workers in physically demanding jobs – such as those in construction, manufacturing, or caregiving – may find it challenging to work longer. Policies promoting flexible work options, lifelong learning initiatives, and encouraging and monitoring training program uptake22 can help older workers stay in the workforce longer and maintain their skills (Mahboubi and Mokaya 2021).23 Targeted support, such as enhanced workplace accommodations, phased retirement options, and retraining programs for workers in physically demanding jobs, could ensure that a later retirement age does not disproportionately burden lower-income individuals.

In response to population aging and existing labour shortages, Canada has increasingly relied on higher levels of immigration. However, the overqualification of immigrants’ skills and credentials, particularly among those from non-Western countries, remains a persistent issue. The successful integration of newcomers into the workforce is important to mitigate the short-term impact of an aging population on the labour market and enhance productivity. For example, recognizing the credentials of foreign-trained professionals in fields like healthcare could increase their productivity and earnings, helping to address the chronic shortage of healthcare workers. However, many skilled immigrants hold qualifications in regulated fields overseen by provincial regulatory bodies, which creates considerable barriers to entering the labour market. While these regulations aim to uphold public safety, they differ among provinces. Over the past few years, several provincial governments have taken steps to reduce barriers for foreign-trained immigrants. For instance, British Columbia and Nova Scotia have expedited credential assessments for foreign-trained healthcare professionals, which helped expand their healthcare workforce. Other provinces should consider adopting similar initiatives.

Licensed workers, either immigrants or non-immigrants, in these occupations also face barriers if they wish to change their province of residence. Easing provincial labour mobility in regulated professions could help reduce regional labour shortages in these sectors. Ensuring immigrants’ skills and qualifications are recognized and accepted by employers is also important.

Canada also needs to adopt more effective settlement strategies, with a strong emphasis on improving language proficiency for immigrants who struggle with communication skills. Language training tailored to workplace culture can also bridge language gaps and help newcomers obtain licences to integrate into the labour market. A notable example is the Health English Language Pro (HELP) program, which was launched by ACCES Employment to support internationally educated physicians. The program pairs Canadian physician volunteers with internationally trained medical graduates to help them acquire the necessary medical English skills. Furthermore, in recent years, the expansion of language training facilities has not kept pace with the explosive increase in the number of permanent and temporary immigrants. Governments need to systematically evaluate settlement service agencies to assess the returns on investment and enhance the effectiveness of these services in the labour market.

In addition to reducing regional disparities and improving labour market fluidity – making it easier for workers to transition between jobs – Canada should also focus on increasing GDP per capita by encouraging greater capital investment (Robson, Kronick and Kim 2019; Gu 2024; Robson and Bafale 2023 and 2024) and promoting the adoption of new technologies (e.g., AI, robotics, and automation), with a focus on increasing productivity and complementing the skills of the existing workforce.

Canada’s labour productivity has declined recently – a worrisome trend. Enhancing labour productivity involves addressing skill shortages, overqualification and mismatches. Policies that encourage training and promote automation, as well as higher wages in high-demand sectors, are essential. The potential of AI should also be explored to support labour productivity and mitigate skills and labour shortages (Mahboubi and Zhang 2023). However, it is equally important to provide support for the displacement of low-skilled workers who may be impacted by automation. Governments and employers should focus on training programs that align with the evolving demands of the labour market, including reskilling and upskilling initiatives for those at risk of displacement.

Conclusion

Addressing the challenges of an aging population, a lower senior participation rate, the overqualification of immigrants’ skills, and declining labour productivity requires comprehensive and targeted policy interventions. Canada’s labour market will benefit from proactive measures that support both its existing workforce and newcomers while addressing the demographic pressures ahead.

To ensure sustainable economic growth and greater labour market participation, the following policy actions should be considered:

  • The federal government should gradually raise the normal retirement age to 67 and assess the benefits of delaying the earliest access age for pension benefits, in line with successful international models.
  • Provincial governments should adopt targeted policies to support older workers, such as promoting flexible work arrangements, part-time career opportunities, and self-employment options, particularly in regions like the Atlantic provinces, where senior participation is notably low.
  • All levels of government should invest in high-quality training programs that equip individuals with the skills needed for the evolving labour market, such as digital skills and job search strategies, with a focus on underrepresented groups like seniors, Indigenous Peoples, and youth.
  • Provinces and regulatory bodies should collaborate to streamline the licensing process for skilled immigrants, enabling foreign-trained professionals to meet local regulatory requirements more efficiently. They should also work together to ease labour mobility in regulated occupations, ensuring that qualifications are recognized across regions without compromising service quality.
  • The federal government should invest in enhancing settlement strategies for immigrants, including providing language training tailored to workplace culture. It is also important to evaluate the effectiveness of existing programs to ensure they adequately support newcomers’ integration into the workforce.
  • Employers, in collaboration with governments, should integrate automation and advanced technologies such as AI to boost productivity while ensuring that workers’ skills align with the evolving demands of the economy.

By implementing these policies, Canada can better navigate labour market imbalances, enhance its labour force participation, and position itself for sustainable economic growth in the face of demographic and technological change.

Appendix

For the Silo, Parisa Mahboubj / Tingting Zahn.

The authors extend gratitude to Pierre Fortin, Mikal Skuterud, Steven Tobin, William B.P. Robson, Rosalie Wyonch, and several anonymous referees for valuable comments and suggestions. The authors retain responsibility for any errors and the views expressed.

References

Acemoglu, Daron, and Pischke, Jörn-Steffen. 1999. “The structure of wages and investment in general training.” Journal of Political Economy 107(3): 539-572.

Banks, James, et al. 2010. “Releasing Jobs for the Young? Early Retirement and Youth Unemployment in the United Kingdom.” In Social Security Programs and Retirement around the World: The Relationship to Youth Employment. University of Chicago Press, pp. 319-344.

Busby, Colin, and Ramya Muthukumaran. 2016. Precarious Positions: Policy Options to Mitigate Risks in Non-standard Employment. Commentary. Toronto: C.D. Howe Institute. December.

Casey, Bernard. 1998. “Incentives and Disincentives to Early and Late Retirement.” Working Paper AWP3.3. Paris: OECD.

Coile, Courtney, David Wise, Axel Börsch-Supan, Jonathan Gruber, Kevin Milligan, Richard Woodbury, Michael Baker, James Banks, Luc Behaghel, Melika Ben Salem, Paul Bingley, Didier Blanchet, Richard Blundell, Michele Boldrín, Antoine Bozio, Agar Brugiavini, Tabea Bucher-Koenen, Raluca Elena Buia, Eve Caroli, Naohiro Yashiro. 2025. “Social Security and Retirement around the World: Lessons from a Long-term Collaboration.” Journal of Pension Economics and Finance 24: 8-30.

Coile, Courtney, Kevin S. Milligan, and David A. Wise. 2018. “Social Security Programs and Retirement Around the World: Working Longer – Introduction and Summary.” National Bureau of Economic Research. Working Paper 24584. May.

Employment and Social Development Canada. 2023. “Canadian Occupational Projection System (COPS)-Information Documents.” Available at: https://occupations.esdc.gc.ca/sppc-cops/libdetails.jsp?lang=en&fbc=Y

Fan, Claire. 2024. “Immigrants participation in the labour force surpasses those born in Canada.” RBC Thought Leadership. Available at: https://thoughtleadership.rbc.com/proof-point-immigrants-participation-in-the-labour-force-surpasses-those-born-in-canada/?utm_medium=johnsocial&utm_source=linkedin.com&utm_campaign=Econ

Fortin, Pierre, 2024. “Does immigration help alleviate economy-wide labour shortages?” CLEF Working Paper Series 70, Canadian Labour Economics Forum (CLEF), University of Waterloo.

Fortin, Pierre, 2025. The Immigration Paradox: How an Influx of Newcomers Has Led to Labour Shortages. Commentary 677. Toronto: C.D. Howe Institute. February.

Gagnon, Morgan, Sithandazile Kuzviwanza. 2023. “Mapping Employment Supports for Québec’s Racialized and Immigrant English-speaking Communities.” Provincial Employment Roundtable (PERT). July.

Grenier, Gilles, and Serge Nadeau. 2011. “Immigrant access to work in Montreal and Toronto.” Canadian Journal of Regional Science 34(1): 19-32.

Gu, Wulong. 2024. “Investment Slowdown in Canada After the Mid-2000s: The Role of Competition and Intangibles.” Statistics Canada. DOI: https://doi.org/10.25318/11f0019m2024001-eng

Guillemette, Yvan. 2006. “Misplaced Talent: The Rising Dispersion of Unemployment Rates in Canada.” E-Brief 33. Toronto: C.D. Howe Institute.

Haun, Chris. 2023. “A Detailed Analysis of Canada’s Post-2000 Productivity Performance and Pandemic-Era Productivity Slowdown.” Center for the Study of Living Standards. Available at https://www.csls.ca/reports/csls2023-11.pdf

Herbertsson, Tryggvi Thor, and Mike Orszag. 2003. “The Early Retirement Burden: Assessing the Costs of the Continued Prevalence of Early Retirement in OECD Countries.” IZA Discussion Paper, No. 816, July.

Holland, Brian. 2018. “Defining and Measuring Workforce Development in a Post-Bipartisan Era.” GLO Discussion Paper Series # 234, Global Labour Organization (GLO).

___________. 2019. “The Design and Uses of an Employability Index to Evaluate the Vertical Workforce Development Process.” New Horizons in Adult Education and Human Resource Development 31(2): 41-59.

Hou, Feng. 2024. “The improvement in the labour market outcomes of recent immigrants since the mid-2010s.” Statistics Canada. February. DOI: https://doi.org/10.25318/36280001202400200004-eng

Jousten, Alain, Mathieu Lefèbvre, Sergio Perelman,and Pierre Pestieau. 2010. “The Effects of Early Retirement on Youth Unemployment: The Case of Belgium.” In Social Security Programs and Retirement Around the World: The Relationship to Youth Employment. University of Chicago Press, pp. 47-76.

Kalwij, Adriaan, Arie Kapteyn and Klass de Vos. 2010. “Retirement of Older Workers and Employment of the Young.” De Economist 158 (4): 341-359.

Lacroix, Guy, and Pierre-Carl Michaud. 2024. “Tax Incentives and Older Workers: Evidence from Canada.” HEC Montreal. Working Paper. September.

Lefebvre, Pierre, and Philip Merrigan. 2008. “Child-Care Policy and the Labour Supply of Mothers with Young Children: A Natural Experiment from Canada.” Journal of Labour Economics 26 (3): 519-48.

Lu, Yuqian, and Feng Hou. 2023. “Foreign workers in Canada: Distribution of paid employment by industry.” Statistics Canada. DOI: https://doi.org/10.25318/36280001202301200005-eng

Mahboubi, Parisa. 2017a. The Power of Words: Improving Immigrants’ Literacy Skills. Commentary 486. Toronto: C.D. Howe Institute. May.

___________. 2017b. “Talkin’ ‘Bout My Generation: More Educated, But Less Skilled Canadians.” E-Brief. Toronto: C.D. Howe Institute.

___________. 2024. Quality Over Quantity: How Canada’s Immigration System Can Catch Up With Its Competitors. Commentary 654. Toronto: C.D. Howe Institute. February.

Mahboubi, Parisa, and Amira Higazy. 2022. Lives Put on Hold: The Impact of the COVID-19 Pandemic on Canada’s Youth. Commentary 624. Toronto: C.D. Howe Institute. July

Mahboubi, Parisa, and Momanyi Mokaya. 2021. The Skills Imperative: Workforce Development Strategies Post-COVID. Commentary 609. Toronto: C.D. Howe Institute.

Mahboubi, Parisa, and Tingting Zhang. 2023. Empty Seats: Why Labour Shortages Plague Small and Medium-Sized Businesses and What to Do About It. Commentary 648. Toronto: C.D. Howe Institute. November.

___________. 2024. Harnessing Immigrant Talent: Reducing Overqualification and Strengthening the Immigration System. Commentary 672. Toronto: C.D. Howe Institute.

Mischke, Jan, Chris Bradley, Marc Canal, Olivia White, Sven Smit, and Denitsa Georgieva. 2024. “Investing in productivity growth.” McKinsey Global Institute. Available at: https://www.mckinsey.com/mgi/our-research/investing-in-productivity-growth?stcr=7A4A10A6D14341799125FD0D945DE5F4&cid=other-eml-alt-mip-mck&hlkid=72faf5b1056a4da5913de34ab992272c&hctky=13711536&hdpid=0f032b80-145b-4cc4-995d-dc2ef7d9468d

Morissette, René, and Feng Hou. 2024. “Employment by choice and necessity among Canadian born and immigrant seniors.” Statistics Canada. DOI:
https://doi.org/10.25318/36280001202400400002-eng

Organisation for Economic Co-operation and Development (OECD). 2017. Pensions at a Glance 2017: OECD and G20 Indicators. Paris: OECD Publishing. Retrieved from: https://www.oecd.org/en/publications/pensions-at-a-glance-2017_pension_glance-2017-en.html

OECD. 2024. Education at a Glance 2024: OECD Indicators. OECD Publishing. Paris. https://doi.org/10.1787/c00cad36-en

______. 2022. What has been the impact of the COVID-19 pandemic on immigrants? An update on recent evidence. OECD Publishing. Paris. https://doi.org/10.1787/65cfc31c-en

______. “Online OECD Family database.” OECD Publishing. Paris. Retrieved from: https://www.oecd.org/els/family/database.htm

Pastore, Francesco. 2018. “Why is youth unemployment so high and different across countries?” IZA World of Labour. Available at: https://wol.iza.org/articles/why-is-youth-unemployment-so-high-and-different-across-countries

Picot, Garnett, and Feng Hou. 2024. “Immigration and the shifting occupational distribution in Canada, 2001 to 2021.” Statistics Canada. DOI: https://doi.org/10.25318/36280001202400300006-eng

Picot, Garnett, and Tahsin Mehdi. 2024. “The Provision of Higher- and Lower-skilled Immigrant Labour to the Canadian Economy.” Statistics Canada. DOI: https://doi.org/10.25318/36280001202400900005-eng

Robson, William B.P. 2019. Thin Capitalization: Weak Business Investment Undermines Canadian Workers. Commentary 550. Toronto: C.D. Howe Institute. August.

Robson, William B.P., and Mawakina Bafale. 2024. Underequipped: How Weak Capital Investment Hurts Canadian Prosperity and What to Do about It. Commentary 666. Toronto: C.D. Howe Institute. September.

Robson, William B.P, and Mawakina Bafale. 2023. Working Harder for Less: More People but Less Capital Is No Recipe for Prosperity. Commentary 647. Toronto: C.D. Howe Institute. June.

Robson, William B.P., and Parisa Mahboubi. 2018. “Inflated Expectations: More Immigrants Can’t Solve Canada’s Aging Problem on Their Own.” E-Brief. Toronto: C.D. Howe Institute. November.

Robson, William B.P., Jeremy Kronick and Jacob Kim. 2018. Tooling Up: Canada Needs More Robust Capital Investment. Commentary 520. Toronto: C.D. Howe Institute. September.

Rogers, Carolyn. 2024. “Time to break the glass: Fixing Canada’s productivity problem.” Bank of Canada. Available at: https://www.bankofcanada.ca/2024/03/time-to-break-the-glass-fixing-canadas-productivity-problem/

Schimmele, Christoph, and Feng Hou. 2024. “Trends in Education–Occupation Mismatch among Recent Immigrants with a Bachelor’s Degree or Higher, 2001 to 2021.” Statistics Canada. May 22. DOI: https://doi.org/10.25318/36280001202400500002-eng

Skuterud, Mikal. 2023. “Canada’s Missing Workers: Temporary Residents Working in Canada.” E-Brief 345. Toronto: C.D. Howe Institute. September.

Skuterud, Mikal. 2025. “The Growing Data Gap on Canada’s Temporary Resident Workforce.” E-Brief 367. Toronto: C.D. Howe Institute. February.

Statistics Canada. 2022. “The COVID-19 pandemic disrupted the economic integration of many immigrants.” The Daily. December 5. Available at https://www150.statcan.gc.ca/n1/en/daily-quotidien/221205/dq221205b-eng.pdf?st=V29agyBR

Vézina, Samuel, Jean-Dominique Morency, Laurent Martel and François Pelletier. 2024. “Canadian Labour Force: What Will Happen Once Baby Boomers Retire?” Statistics Canada. Available at https://www150.statcan.gc.ca/n1/pub/75-006-x/2024001/article/00005-eng.htm

Wang, Weimin. 2022. “The COVID-19 Pandemic and Gross Domestic Product Per Capita Growth in Canada.” Statistics Canada. DOI: https://doi.org/10.25318/36280001202200500002-eng

Yong, Rebekah, and René Lalonde. 2024. “Raising the Bar, Not Just Lowering the Number: Canada’s Immigration Policy Confronts Critical Choices.” Scotiabank. Available at https://www.scotiabank.com/ca/en/about/economics/economics-publications/post.other-publications.insights-views.canada-s-immigration-policy–march-21–2024-.html

Stop Assuming Immigration Will Solve Canada’s Labour Crisis 

Newcomers increase consumption and spending, and are actually contributing to demand for labour in other sectors.

Study in Brief

  • This study investigates the effects of Canada’s expansive immigration policy, implemented between 2016 and 2024, on labour shortages. It explores how the influx of permanent and temporary immigrants has affected the balance between labour supply and demand, with attention to whether the policy has met one of its key objectives – alleviating shortages in labour markets.
  • It provides an analysis of labour market dynamics through the lens of the Beveridge curve, which tracks the joint path of unemployment and job vacancies over time. The study compares labour market tightness before, during, and after the pandemic and evaluates how rapidly rising immigration and the adoption of remote work have affected job vacancy rates in Canada.
  • The arrival of immigrant workers has expanded the supply of labour to employers, but has also generated additional income and spending, and hence greater demand for labour throughout the economy. The macroeconomic evidence from this study indicates that, on balance, the increase in demand generated by immigration has more than likely outpaced the additional supply, potentially making economy-wide labour shortages more widespread rather than alleviating them.

Introduction

Canada’s immigration levels began to accelerate in 2016, following a period of relative stability. From 2001 to 2015, the annual inflow of immigrants, including both permanent and temporary admissions, was reasonably stable at around 0.85 percent of the overall population. In the following years, despite a temporary contraction during the pandemic, this rate rose fourfold, reaching up to 3.2 percent of the population in 2023.

This post-2015 expansion was consistent with recommendations from the Advisory Council on Economic Growth, established by Minister of Finance Bill Morneau in 2016. The Council’s 2016 report suggested that the annual number of permanent economic immigrants should be increased from 300,000 in 2016 to 450,000 in 2021, and to nearly double this number later. Its stated objectives were to increase population growth, reduce the old age dependency ratio, generate a bigger GDP, and accelerate the rise in real GDP per capita by easing shortages of high-skilled workers and other means. Policymakers, encouraged by the perceived success of Canada’s immigration program, embraced the idea that higher immigration levels could deliver even greater economic and demographic benefits.1 The Council also urged the government to facilitate admissions of temporary workers and attract more international students. The government responded by increasing permanent immigration levels from 270,000 in 2015 to 480,000 in 2024, allowing uncapped increases in temporary immigration, and trying to address shortages of low- as well as high-skilled labour.

The C.D. Howe Institute’s research has shown that the benefits of immigration in mitigating population aging, and supporting the growth of GDP per capita, have been more limited than expected (Mahboubi and Robson 2018; Doyle, Skuterud and Worswick 2024). The present study is an attempt to assess whether the policy has succeeded in meeting the goal of easing the challenges employers face in finding suitable candidates for their job openings. The answer to this question has clearly been a big “yes” at the level of the individual employer. Many employers are benefiting from the contribution of their new immigrant workers, which is the basis for the unrelenting support for more immigration by representative national business organizations.

It is less clear whether immigration has helped alleviate labour shortages in the overall economy. Immigration not only expands the supply of labour, but also adds to the demand for labour. Putting more immigrants to work generates an expansionary multiplier effect on gross domestic product (GDP) and national income. As the additional income is spent on various consumption and investment goods by households, businesses and governments, the demand for labour increases. The net effect of immigration on the difference between supply and demand in the aggregate economy is, therefore, a priori uncertain. It could be negative or positive.

My goal in this study is to uncover what simple economic logic, and the statistical evidence from Canadian macrodata, reveal about the direction and quantitative importance of the net effect of rising immigration on the economy-wide balance between the demand for, and the supply of, labour. I find that the demand has likely matched or exceeded the supply and has therefore increased the overall job vacancy rate at any given level of unemployment.

Labour Shortages and Job Vacancies

What do “labour shortages” mean, and how have they evolved since Canada’s immigration rate began to increase eight years ago? Employers feel they are short of labour when the number of unfilled job openings significantly exceeds the number of available employees with the necessary skills and qualifications to meet their operational needs. Each month, Statistics Canada reports the extent of labour shortages in various sectors and regions from its Job Vacancy and Wage Survey. It is called the “job vacancy rate” and is an estimate of the number of job vacancies as a percentage of total labour demand, including all occupied and vacant salaried jobs.

Data on the job vacancy rate have been available since 2015 (Figure 1). After the oil-induced economic slowdown of 2014-2015, job vacancies increased from 2.3 percent of labour demand in mid-2016 to 3.3 percent in early 2020. No vacancy data were available from April to September 2020 due to a six-month pandemic-related pause in Statistics Canada’s survey. Moving through the spring 2020 recession, but with the unemployment rate still very high, job vacancies then increased swiftly, reaching a peak of 5.7 percent of all occupied and vacant jobs in the second quarter of 2022. But with the economic slowdown and slackened labour markets subsequently accompanying high interest rates, vacancies fell back to 3.0 percent of labour demand in the third quarter of 2024.

Immigration and Labour Supply and Demand

Since 2015, Canada’s job vacancy rate has fluctuated in response to three key macroeconomic factors: rising immigration, the pandemic, and fluctuations in aggregate economic activity.

Immigration has risen steadily in recent years, with both permanent and temporary entries increasing in each non-pandemic year (Figure 2). Permanent admissions rose from 272,000 in 2015 to 472,000 in 2023. This upward trend was guided by the multi-year immigration-level targets set each year since 2017 by the government in its Annual Report to Parliament on Immigration. For example, the target for permanent admissions in 2023 was set at 465,000 in the 2022 Report.

Temporary immigration includes holders of study or temporary work permits, asylum seekers, and their family members. They are collectively referred to as “non-permanent residents” by Statistics Canada. Prior to 2024, temporary immigration was excluded from the government’s annual targets. It was uncapped and followed demand from businesses and educational establishments. The net annual addition to temporary permits (new entries less exits to permanent residence and to abroad) rose from basically zero in 2015 to 190,000 in 2019, and 821,000 in 2023 (Figure 2).

Overall, total immigration – the sum of permanent and temporary immigration – increased fivefold from 263,000 in 2015, to 1,293,000 in 2023. Was this fivefold surge in immigration over eight years able to lower the job vacancy rate and reduce labour shortages in the aggregate Canadian economy? How could it not? Prima facie, the arrival of new immigrant workers increases the supply of labour, allowing recipient employers to ameliorate their personnel gap, at least in part. The addition of immigrant labour might suggest the “common sense” inference that labour scarcity has been effectively eased up throughout the economy.

However, it is erroneous to assume that simply because immigration solves the personnel shortage of individual employers, it will necessarily solve the problem of labour scarcity in the aggregate economy.

The error comes from focusing narrowly on increasing the supply of labour, while neglecting the simultaneous increase in the demand for labour that is generated by immigration. With more immigrants in the workforce, employers can produce more goods and services and generate more income for themselves, their employees, and their suppliers – a good thing. However, to assess the overall effect of immigration on labour scarcity, it is crucial to consider that this additional income will be spent on various consumer and investment goods. Immigrants allocate their new income, along with any savings brought from abroad, to essentials such as food, clothing, housing, transportation, personal care, and leisure. In turn, employers and their chains of suppliers invest more in construction, machinery and intellectual property. Furthermore, immigrants, employers and suppliers all contribute to taxes, which governments allocate to meet the increased demand for social services, including public housing, education, and healthcare. The growing demand for private and public goods and services will expand aggregate labour demand.

In other words, the hiring of immigrants initially adds to the supply of labour, but it also ends up adding to the demand for labour once the new income generated is spent throughout the economy and a multiplier effect is generated on GDP. On net, it is a priori uncertain whether the supply increases more than the demand, in which case labour would be made less scarce overall, or whether it is the demand that increases more than the supply, in which case labour would be made scarcer.

As a first attempt to clarify the picture, let us see how the excess of labour supply over labour demand evolved from 2016 to 2024 (Figure 3). I take labour supply to be the entire labour force (all workers who are employed or are looking for work), and labour demand to be the sum of employment and job vacancies (all jobs that are occupied or ready to be filled). Expressed as a percentage of the labour force, the difference between the two – excess supply – boils down to the difference between unemployment and job vacancies. Excess supply goes up or down depending on whether unemployment increases more or less than job vacancies.

Figure 3 shows that the excess supply of labour has fluctuated widely since 2016. In the pre-pandemic period 2016-2019, it declined from 5.4 percent to 2.9 percent of the labour force. Labour became scarcer. During the pandemic year 2020, it shot up to 6.1 percent of the labour force. But in the aftermath, labour demand outpaced supply again so that by mid-2022 excess supply had dropped to a low of 0.3 percent of the labour force. Since then, it has risen back to 4.1 percent.

The time path of the excess supply of labour cannot alone determine whether the rise in immigration since 2016 has increased labour supply more or less than labour demand. Excess supply results from the interplay of three simultaneous determinants: rising permanent immigration and accelerating temporary immigration, the disruptions caused by the pandemic and its potential after-effects, and fluctuations in aggregate activity. For example, the declining excess supply in the pre-pandemic period 2016-2019 was the combined outcome of rising immigration and aggregate economic expansion. But the impact of rising immigration cannot be separated out from that of aggregate economic expansion by just looking at the trend in excess supply. Correctly identifying the net effect of each of the two factors requires a more comprehensive economic and statistical analysis of the data.

The Shifting Beveridge Curve

To identify the net effect of immigration on labour shortages, I will use a well-established tool called the Beveridge curve. The Beveridge curve offers valuable insights by highlighting the observed inverse relation between vacancies and unemployment.

William Beveridge (Beveridge 1960) used the unemployment rate as a main marker of fluctuations in aggregate activity, a practice business cycle analysts still follow to this day (Romer and Romer 2019; Hazell et al. 2022). He observed that vacancies and unemployment typically move in opposite directions through business cycles. He attributed the negative relationship to the pressure exerted by aggregate activity on economic potential. When aggregate economic activity was moving up to its full potential (as in Canada in 2016-2019), there were fewer unemployed workers and more job vacancies. Conversely, when activity was moving away from potential (as in Canada in 2023-2024), there were more unemployed workers and fewer job vacancies. Since 1960, this inverse relation between the job vacancy rate and the unemployment rate – now called the Beveridge curve – has played a key role in macroeconomic analysis of labour markets. It has been abundantly studied by researchers and has been identified in job vacancy and unemployment data in many countries (e.g., Blanchard and Diamond 1989; Pissarides 2000; Archambault and Fortin 2001; Elsby, Michaels and Ratner 2018; Michaillat and Saez 2021).

It is instructive to examine the trajectory of the Canadian unemployment – job vacancy relation in two-dimensional space from 2015 to 2024 (Figure 4). First, following the 2015 economic slowdown, the economic expansion of 2016-2019 brought a decrease in the unemployment rate and an increase in the job vacancy rate along a path that was consistent with a negatively sloped Beveridge curve. The sudden outbreak of the pandemic in early 2020 shattered this trajectory. The unemployment – job vacancy pair was sent far outward toward the northeast corner of the chart. From then until the end of 2021, it followed a new Beveridge curve to the northwest. During the recovery following the pandemic recession in the spring quarter of 2020, the unemployment rate decreased and the job vacancy rate increased along a path that was about parallel to that of 2015-2019, but at a much higher level. For instance, whereas the unemployment rate was the same in the summer quarter of 2021 as in the winter quarter of 2016 (7.25 percent), the job vacancy rate was twice as large in the former (4.2 percent) as it was in the latter (1.9 percent). Finally, as the pandemic faded, the unemployment – job vacancy pair did a loop to the west. A new post-pandemic Beveridge curve emerged along a southeasterly trend that looked parallel to, but somewhat higher than, the old pre-pandemic path of 2015-2019.2

This visual check reveals that there have been three distinct periods in the inverse relationship between job vacancies and unemployment, known as the Beveridge curve: pre-pandemic, pandemic and post-pandemic. The start and end of the pandemic significantly affected the vertical position of the Beveridge curve in the unemployment – job vacancy space. Although the three branches are not perfectly aligned, they appear to be nearly parallel. According to the statistical results in Table 1 below, a one percent change in the unemployment rate corresponds to about a 1.5 percent change in the opposite direction in the vacancy rate – this is sometimes referred to as the Beveridge curve “elasticity.”

The shifts in the Canadian Beveridge curve during the pandemic are not an entirely unexpected development. Shifts have occurred from time to time in the past.3 As Figure 4 has shown, the Canadian Beveridge curve looked relatively stable before the pandemic in 2016-2019. Figure 5 is an idealized illustration of the position it occupied in the unemployment – job vacancy space in this period. However, starting in 2020, it shifted significantly. It first moved outward during the pandemic in 2020-2021 and then returned inward after the pandemic in 2022-2024.

As an initial assessment of the magnitude of these movements, I use the actual values of unemployment and job vacancies to calculate the implied monthly shifts in the Figure 5 Beveridge curve from January 2016 to October 2024. I then illustrate the implied vertical movements of the job vacancy rate corresponding to a given reference unemployment rate of 5.5 percent4 by averaging the results for each year from 2016 to 2024. The vertical height of the Beveridge curve calculated in this way increased from 2.8 percent in 2019 to nearly 6 percent in 2020-2021, and dropped back to 3.2 percent in 2024 (Figure 6).

The Beveridge curve’s elevation at around 3.2 or 3.3 percent in the post-pandemic period 2023-2024 is higher than its height of 2.8 or 2.9 percent in the pre-pandemic period 2018-2019. This can be attributed to shifts in the ratio of two background factors: the intensity of labour reallocation across occupations, industries and regions, and the efficiency of the matching process between job openings and job seekers (Blanchard, Domash and Summers 2022). At any given rate of unemployment, the job vacancy rate and the Beveridge curve will be higher in relation to the intensity of labour reallocation and the inefficiency of job matching.

The first factor, the intensity of labour reallocation, is captured by the monthly flow of hires as a percentage of the labour force. It is shown as an index with 2019 = 100 in Figure 7. It increased by some 10 percent during the pandemic of 2020-2021. Labour moved from transport industries and those requiring person-to-person contact toward electronic communications and home deliveries. There was a displacement from traditional businesses and occupations to those allowing work from home. However, in 2022-2024 labour reallocation calmed down and its intensity decreased by some 15 percent below its 2019 level. This pushed the Beveridge curve downward.

The second factor, the efficiency of job matching, reflects the capacity of labour markets to generate hires at the observed levels of unemployment and job vacancies. It is an index with 2019 = 100 in Figure 8. It experienced a sharp drop of nearly 20 percent during the pandemic (2020-2021). Factors contributing to this decline include the increasing physical distance between vacant positions and available candidates, as well as the widening gap between the demand for and supply of skills. Also, the rise in illnesses and the increased popularity of remote work during the pandemic likely may have contributed to a decline in job search intensity. As a result, employers found it more difficult to match job offers with suitable job seekers. Matching efficiency did not recover from 2022-2024. It remained some 20 percent below its pre-pandemic level of 2018-2019. This pushed the Beveridge curve upward.

Going from 2019 to 2024, movements in labour reallocation and matching efficiency had opposite effects on the height of the Beveridge curve. But the upward pressure on the curve from the 20 percent drop in matching efficiency was greater than the downward pressure from the 15 percent decline in labour reallocation. Therefore, as already pictured in Figures 4 and 6, the net outcome is that, going over the pandemic, the Beveridge curve wound up at a higher level in 2024 than in 2019, implying a higher job vacancy rate for any given unemployment rate.

So far, I have used the Beveridge relation between job vacancies and unemployment as a broad interpretive framework for macroeconomic developments in Canada over the 2015-2024 period. First, I have focused on the effect of fluctuations in aggregate economic activity (captured by changes in unemployment) on the job vacancy rate. Second, I have noted that the onset and ending of the pandemic have been big shifters of this unemployment – job vacancy trade off upward in 2020-2021 and downward in 2022-2024. Nevertheless, third, I have shown that, mainly due to a persistent 20 percent drop in job matching efficiency since 2019, the Canadian Beveridge curve was occupying a higher vertical position in 2023-2024 than before the pandemic.

In addition to the pandemic, Canada’s immigration policy, characterized by rising immigration levels, is another major development that has impacted labour markets in recent years. Like the pandemic, this policy may have affected the level of the unemployment rate along the Beveridge curve, as well as the vertical position of the curve, through its impacts on labour reallocation and matching efficiency. The following sections try to assess the existence and magnitude of these potential effects of immigration.

Economic Logic

The Beveridge framework can be used to explain how the expansion of immigration in Canada before and after the pandemic could have produced a lasting decrease or increase in labour shortages. Excluding the pandemic’s influence, rising immigration may affect aggregate labour shortages in two mechanical ways: by causing labour markets to slide up or down along the Beveridge curve, or by shifting the entire position of the Beveridge curve upward or downward, resulting in a larger or a smaller number of job vacancies for any given unemployment rate.

The first scenario involves a slide along the Beveridge curve. If rising immigration moves the economy up and to the northwest, unemployment decreases and vacancies increase; if the economy descends to the southeast, unemployment increases and vacancies decrease, as shown in Figure 5.

A permanent increase in unemployment along a given Beveridge curve is not what is generally hoped for by policymakers and the public. We want to achieve a permanent reduction in labour scarcity without being forced to suffer a permanent increase in unemployment. Nevertheless, it is important to understand how rising immigration could impact unemployment permanently, such that a higher or lower unemployment rate would be structurally needed to keep inflation low and stable over time.

A rough check on whether a higher immigration rate has raised or lowered the national unemployment rate consists of seeing if the excess of the national rate over the rate of the experienced group, formed by the Canadian-born plus the immigrants landed more than five years earlier, was higher or lower in 2023 than in 2015. Labour force data indicate that the excess of the national rate over the rate of this experienced group did increase in this period, but by just 0.1 percentage point, owing essentially to the rising labour force share of immigrants landed less than five years earlier. Seen in this light, rising immigration does not seem to have had a meaningful direct effect on structural unemployment. This result is consistent with research by Dion and Dodge (2023), who found no significant change in the national unemployment rate needed to keep inflation stable, known as the noninflationary rate of unemployment, that could be attributed to rising immigration.

It is a relief to see that rising immigration has not entailed a permanent reduction in the job vacancy rate by permanently pushing the national unemployment rate upward. There is evidence, though, that rising immigration has led to greater cyclical volatility of unemployment. First, the phenomenal expansion in the number of new residents since 2021 is known to have contributed to the strong demographic pressure on the demand for housing and, hence, to the significant increase in the cost of rented and owned accommodation. The Bank of Canada has acknowledged that the persistence of high shelter inflation consequently acts “as a material headwind against the return of inflation to the 2 percent target” (Bank of Canada 2024). In other words, through this channel, rising immigration is prolonging the current period of slower growth and higher unemployment. Second, the difference in cyclical sensitivity of the unemployment rate, between the above-defined experienced group and immigrants landed less than five years earlier, seems to have increased. In the economic slowdown during the spring quarter of 2024, the unemployment rate was 4.0 points higher than a year before for immigrants landed less than five years earlier, but only 0.7 point higher for the experienced group. The difference of 3.3 points between them was larger than in the 2009 and 2020 recessions. It could be due in part to the rising share of the low-skilled population of immigrant workers, which is more exposed to layoffs.

This study is primarily concerned with the permanent structural effects of rising immigration on unemployment, which look small, and not with the short-term economic and social costs associated with the greater cyclical volatility of unemployment around its steady state. Nevertheless, the possibility that these short-term costs are real should be kept in mind. Easing labour scarcity by tolerating more unemployment, whether of the short- or long-term variety, is an outcome our policies should try to avoid.

The other way rising immigration may have impacted aggregate labour shortages is by moving the vertical position of the entire Beveridge curve up or down in the unemployment-job vacancy space. Ultimately, we want to know whether rising immigration has increased the job vacancy rate and worsened labour shortages, or whether it has decreased the vacancy rate and alleviated the shortages, at every given level of unemployment.

The combined visual evidence presented by Figures 4 to 8 above implies that the Beveridge curve did shift upward somewhat from the pre-pandemic to the post-pandemic period, particularly due to a persistent 20 percent drop in job matching efficiency. Has rising immigration in Canada contributed to this evolution? Bowlus, Miyairi and Robinson (2016) conducted a longitudinal study of the job search behaviour of immigrants to Canada in 2002-2007. Results imply that heightened immigration may reduce matching efficiency in the short run, as new immigrants often face a lower rate of job offers than natives during their initial integration period. Based on US data, Barnichon and Figura (2015) focused on the two primary determinants of aggregate matching efficiency: worker heterogeneity and labour market segmentation. They pointed out that matching efficiency would decline if workers with a lower-than-average search efficiency became more represented among job seekers, or if the dispersion between tight labour submarkets and slack ones increased. These two conditions would seem to apply to the Canadian context with rising immigration. Lu and Hou (2023) have identified a major shift of immigration toward lower-skilled workers, and a significant relative tightening of labour markets such as construction, accommodation, food, business support services, education, healthcare, and social services. The statistical analysis below will provide a test of whether in recent years rising immigration has in fact shifted the Beveridge curve upward and intensified labour scarcity, or not.

Rising immigration is not the only macroeconomic development that may conceivably have affected aggregate labour shortages in the post-pandemic period. It is entirely conceivable that some of the changes triggered suddenly by the pandemic shock may have persisted into the post-pandemic era. Potentially, the most important of these is the widespread shift to work from home (Aksoy et al. 2023). The pandemic can be seen as a mass natural experiment that brought millions of workers in Canada, and other countries, to suddenly experience more work from home, to value its benefits, and to stick to it thereafter, often with a surprising upside in productivity.

The percentage of Canadian workers aged 15 to 69 who work most of their hours from home was 7 percent in early 2020. It sprang to 41 percent in the great confinement month of April 2020, and then declined as the pandemic evolved and faded out. But it was still holding up around 20 percent in the first half of 2024, which was three times as large as the 7 percent of early 2020.

The large increase in the percentage of Canadians working primarily from home has introduced an increase in worker heterogeneity compared to the pre-2020 period. With more workers satisfied with their work from home, fewer are incentivized to seek new jobs, particularly of the traditional variety. Following the Barnichon and Figura (2015) result, this could partly explain the reduction in job matching efficiency that has so far kept the Beveridge curve at a higher level than otherwise.

The economic logic developed in this section suggests that rising immigration and increased work from home may have contributed to the 20 percent loss of matching efficiency that has kept the post-pandemic height of the Canadian Beveridge curve at a level higher than before the pandemic. (However, fully confirming this hypothesis is beyond the scope of this study).

Statistical Analysis

This section summarizes an analysis of the factors influencing job vacancies in Canada, focusing on immigration and the rise of work-from-home arrangements. Introducing the rate of work from home as a factor is done to verify whether the shift to work from home that was initiated by the pandemic, but persisted in 2022-2024 (Schirle 2024), affected the position of the Beveridge curve.5

The analysis spans six Canadian regions – Atlantic Canada, Quebec, Ontario, the Prairies (Manitoba and Saskatchewan), Alberta, and British Columbia – across the periods from 2015 to 2019 (pre-pandemic) and 2022 to 2024 (post-pandemic).

Table 1 summarizes the key findings of the statistical results. Consistent with expectations, it shows that the Beveridge relationship between vacancies and unemployment is negative, with a precisely estimated elasticity of -1.42 in the two models. The results also show that immigration has been a significant contributor to the rise in job vacancies in Canada. Specifically, Model 1 estimates that a one percentage point increase in the immigration rate is associated with an 8.12 percent increase in the job vacancy rate after one year. It suggests that rising immigration has pushed the Beveridge curve upward, increasing the job vacancy rate at each unemployment rate over the period. However, when accounting for the rise in work-from-home arrangements in Model 2, the effect of immigration is smaller, at 3.21 percent,6 reflecting the additional impact of remote work.7 The positive effect of work-from-home arrangements is estimated at 0.85 percent.

These results suggest that both factors – immigration and remote work – have played a significant role in pushing the Beveridge curve upward, making it more difficult to match available workers with job openings.

While both factors contribute to the rise in job vacancies, their high correlation complicates the ability to isolate their individual effects. The correlation between immigration and remote work is particularly strong, which makes it challenging to assess their independent impacts.8 As a result, the evidence for immigration’s effect on job vacancies in Model 2 is less powerful than it would be if the data allowed sharper estimation.9 However, the findings from Model 2 indicate that the combined effects of both immigration and remote work have contributed to higher job vacancies, suggesting that increasing immigration alone is unlikely to solve labour shortages in the short term.

To be specific, statistical calculation of Model 2 indicates an 82 percent chance that rising immigration has left the job vacancy rate unchanged or raised it, and only an 18 percent chance that it has lowered it.10 In other words, increased immigration is more than four times as likely to have raised the aggregate demand for labour by as much as, or more than, the supply than to have increased it by less than the supply. In short, it is unlikely that rising immigration in Canada has helped the country solve its economy-wide problem of labour shortages by reducing the job vacancy rate at any given unemployment rate.

A natural question is whether the effect of immigration on job vacancies varies between permanent and temporary immigration. So far, an expanded version of Model 2, which distinguishes between these factors by analyzing the permanent and temporary immigration rates separately, has found no significant difference in their four-quarter total effects.11 Future analyses could benefit from disaggregating data by industry, as the impact of immigration and working from home may vary across sectors. For instance, remote work affects sectors like technology differently than it does retail or construction.

Discussion and Conclusion

This paper’s conclusion, drawn from statistical analysis of the macrodata runs, is contrary to the views of business organizations, which have campaigned relentlessly in favour of increases in permanent and temporary economic immigration in the past several years (e.g., Business Council of Canada 2022; Canadian Manufacturers & Exporters 2023; Canadian Federation of Independent Business 2021; Conseil du patronat du Québec 2022). Their position is understandable and grounded in a genuine concern to address labor shortages. By filling the vacancies, economic immigration enables firms to produce more and maintain or increase profitability.

The evidence presented here does not question the important role immigration can play for individual employers, whose need for additional employees is acute and urgent. However, in economics, everything depends on everything. The direction and importance of a phenomenon, confirmed at a microeconomic level with regard to a particular business, government organization, or sector, can be different or even reversed at the macroeconomic level, once all spillovers into the rest of the economy are accounted for. In his 1955 introductory textbook, the renowned American economist Paul Samuelson warned against the risk of the “fallacy of composition,” where it is assumed that what is true for individual parts is automatically true for the whole economy.

In the case of immigration, the fallacy of composition consists of believing that the advantages accruing to employers that hire immigrants can simply be added up and said to extend to the whole economy. What the present study has uncovered is that this belief is not corroborated by the macroeconomic evidence from the recent experience of Canadian regions. It is true that immigration eases up the dearth of personnel in firms that hire newcomers, which is clearly a good thing. But it is also true, conversely, that it worsens the shortage of labour in industries that must cater to the additional demand for goods and services generated by the addition to total GDP. The induced increase in the demand for labour in the aggregate economy can offset or even exceed the initial expansion of supply, so that it contributes to amplify economy-wide labour shortages on net. The insights I have extracted from Canadian regional data suggest that rising immigration has more likely redistributed or increased labour scarcity across the economy than reduced it overall. The political implication is that, if labour shortages persist or increase in the whole of the country despite fast-rising immigration, the insistent demand of business organizations for more immigration will not calm down; labour shortages will persist or intensify.

The vision of immigration as an economy-wide offset to labour scarcity is also reductionist. To take account solely of the hoped-for benefits accruing directly to employers of new immigrants overlooks the fact that immigration is a global and transformative phenomenon. The purpose of immigration is not only to serve the interests of a particular group. It is of concern to a whole society for reasons that are no doubt partly economic, but also demographic, cultural, social, and humanitarian. Society is morally obligated to welcome and integrate all immigrants in the most humane manner. This requires much time and money. Society must also make sure that the pace of immigration is not so fast that it leads ethnic groups to “hunker down” (as Putnam 2007 found) and provokes serious economic disequilibria in sectors that must absorb the induced increase in demand, such as construction, housing, health, education and social services. The overall pace and composition of immigration must balance individual interests against the challenges it brings to society.

Among these costs are the negative potential repercussions on productivity and wage growth stemming from the open-door immigration policy that Canada has followed until recently. Two key implications merit attention. First, investment in housing, business investment to equip newcomers with required physical and human capital, and government investment in public infrastructure to provide social services have not been able to keep pace with fast-rising immigration. Second, the open-door policy has made it easy for employers to rely on low-skilled foreign workers to meet high labour demand, which has been concentrated in low-wage industries (Lu and Hou 2023). While immigration alleviates immediate labour shortages, it may suppress wage increases that would otherwise occur as labour markets tighten and affect capital investments.

For example, in the 12 months leading to 2024Q3, overall wages increased by 4 percent, outpacing inflation at 2 percent, but sectoral differences were stark: wages grew by 3.2 percent in the business sector compared to 6.3 percent in the non-commercial sector. These dynamics suggest that wage growth patterns are influenced by a blend of short-term factors and structural shifts, including immigration trends.

Data also show that business sector labour productivity in Canada is on a slippery slope. From 2021Q3 to 2024Q3, output per hour went down cumulatively by 2.3 percent, whereas it would have gone up by 3.2 percent if it had increased at the same rate as in 1999-2019 (Statistics Canada, table 36-10-0206). While there are many factors behind this slowdown in productivity growth, the high immigration rate may have been a contributor.

In March 2024, the government suddenly announced a reversal of its immigration policy. Immigration Minister Marc Miller committed his department to cutting Canada’s non-permanent resident population from 6.5 percent of the overall population in early 2024 to 5 percent in early 2027. In November, details of the plan were set in the 2024 Annual Report to Parliament on Immigration (Government of Canada 2024, Annex 4). There would be 446,000 fewer entries of new non-permanent residents than exits in each of 2025 and 2026. Annual temporary immigration would be negative to this extent. The Annual Report also announced that the annual target for admissions to permanent immigration would be reduced from 485,000 in 2024 to 395,000 in 2025, 380,000 in 2026 and 365,000 in 2027.

If implemented as intended, scaling back the number of temporary and permanent immigrants will impact Canada’s aggregate labour supply significantly in 2025-2027. The working-age (15-64) population will stagnate instead of increasing by 800,000 or more, as it did in each of 2023 and 2024. An implication of the evidence reported above in Table 1 is that labour demand will likely decline alongside the reduction in labour supply because there will be 800,000 fewer consumers in the Canadian economy. While this policy reversal may not directly address the job vacancy rate, it could reduce vacancies by decreasing the overall demand for labour. As a result, while Canada’s aggregate GDP may contract, GDP per capita could increase, particularly if a smaller portion of national savings is directed toward demographic investments and the composition of immigration shifts toward fewer low-skilled immigrants.

The government’s policy reversal is a first step toward moderation. While it presents challenges, it also offers opportunities for improvement. When employers do not have the luxury of recruiting a rising stream of newcomers who are willing to accept low wages, it may push them to invest more in technology and work reorganization, and hence increase productivity. Furthermore, with a more moderate immigration level, the issue of the lack of absorptive capacity in the economy to provide enough skill-equivalent jobs to high-skilled immigrants will be less acute. Immigrants will see their skill utilization increase and their overqualification rate decrease. This shift could enhance Canada’s ability to attract global talent, aligning with the 2016 recommendation from the Advisory Council on Economic Growth that immigration should help address the shortage of high-skilled workers.

Appendix: Statistical Methodology and Data

This appendix provides a detailed description of the statistical analysis conducted to assess the factors influencing the job vacancy rate in Canada. The analysis spans 27 non-pandemic quarters, covering two periods: 2015Q2 to 2019Q4 (pre-pandemic) and 2022Q4 to 2024Q3 (post-pandemic). It includes data from six Canadian regions – Atlantic Canada, Quebec, Ontario, the Prairies (Manitoba and Saskatchewan), Alberta, and British Columbia. Each of these regions has a population of more than 2 million.

The dataset consists of 162 observations, representing the six regions across the 27 quarters. All labour market and population data are sourced from publicly available Statistics Canada tables. The job vacancy rate and unemployment rate are expressed as ratios of seasonally adjusted job vacancies and unemployment to the labour force. These variables are logarithmically transformed to account for the convexity of the Beveridge curve.

To estimate the relationship between job vacancies and its key determinants, two regression models are specified:

• Model 1 includes the unemployment rate, the immigration rate (measured as the total number of new permanent immigrants and net additional non-permanent residents relative to the population, annualized), and three unconstrained lagged values of the immigration rate.

• Model 2 builds upon Model 1 by including the rate of work from home as an additional explanatory variable. The work-from-home rate is the fraction of workers aged 15 to 69 who work most of their hours from home in their main jobs. This model tests whether the pandemic-induced shift to remote work, which persisted post-pandemic, has affected the Beveridge curve and the job vacancy rate.

Both models incorporate regional and seasonal fixed effects to account for regional disparities and seasonal fluctuations in the labour market.

For the Silo, Pierre Fortin.

The author is grateful to Mario Fortin, Gilles Grenier, Jeremy Kronick, Nicolas Marceau, Parisa Mahboubi, Pascal Michaillat, Mario Polèse, Statistics Canada data analysts, Mikal Skuterud, Daniel Schwanen, Christopher Worswick and several anonymous referees for valuable comments and suggestions. The author retains responsibility for any errors and the views expressed.

References

Advisory Council on Economic Growth. 2016. “The Path to Prosperity: Resetting Canada’s Growth Trajectory.” Report of the Advisory Council on Economic Growth to the Minister of Finance of Canada. October.

Ahn, Hie Joo, and Leland Crane. 2020. “Dynamic Beveridge curve accounting.” Finance and Economic Discussion Series 2020-27. Board of Governors of the Federal Reserve System, Washington. March.

Aksoy, Cevat Giray, Jose Maria Barrero, Nicholas Bloom, Steven Davis, Mathias Dolls and Pablo Zarate. 2023. “Working from home around the world.” Brookings Papers on Economic Activity, Fall 2022, 281-330.

Archambault, Richard, and Mario Fortin. 2001. “The Beveridge Curve and Unemployment Fluctuations in Canada.” Canadian Journal of Economics 34(1): 58-81.

Bank of Canada. 2024. Monetary Policy Report. Ottawa, January.

Barlevy, Gadi, Jason Faberman, Bart Hobijn and Ayşegül Şahin. 2024. “The Shifting Reasons for Beveridge Curve Shifts.” Journal of Economic Perspectives 38(2): 83-106.

Barnichon, Régis, and Andrew Figura. 2015. “Labor market Heterogeneity and the Aggregate Matching Function.” American Economic Journal: Macroeconomics 7(4): 222-249.

Beveridge, William. 1960. Full Employment in a Free Society. Second edition. London: Allen & Unwin.

Blanchard, Olivier, and Peter Diamond. 1989. “The Beveridge Curve.” Brookings Papers on Economic Activity (1)1-67.

Blanchard, Olivier, Alex Domash, and Lawrence Summers. 2022. “Bad news for the Fed from the Beveridge space.” Policy Brief. Peterson Institute for International Economics. July.

Bok, Brandyn, Nicolas Petrosky-Nadeau, Robert Valetta, and Mary Yilma. 2022. “Finding a soft landing along the Beveridge curve.” Economic Letter. Federal Reserve Bank of San Francisco. August.

Bowlus, Audra, Masashi Miyairi and Chris Robinson. 2016. “Immigrant job search assimilation in Canada.” Canadian Journal of Economics 49(1): 5-52.

Business Council of Canada. 2022. Report on Canada’s Immigration Advantage. Ottawa, June. At Canada’s immigration advantage | Business Council of Canada (thebusinesscouncil.ca)

Canadian Federation of Independent Business. 2021. “Using Immigration Programs to Overcome Labour Shortage Problems.” Ottawa. May. At Using immigration programs to overcome labour shortage problems | CFIB (cfib-fcei.ca)

Canadian Manufacturers & Exporters. 2023. Manufacturing Canada’s Future. Ottawa, November. At 2023-CME-Report-Manufacturing-Canadas-Future_Final-2_web.pdf (cme-mec.ca)

C.D. Howe Institute. 2024. “Graphic of the week: Canada’s plan to cut non-permanent residents by 30 percent by early 2027.” At Graph of the Week: Canada’s Plan to Cut Non-Permanent Residents by 30 Percent by Early 2027 | C.D. Howe Institute | Canada Economy News | Canadian Government Policy (cdhowe.org)

Century Initiative. 2024. “Canada’s Immigration Reality Check.” In National Scorecard on Canada’s Growth and Prosperity. Ottawa. November. At 665f8b1d9f801b398e1926db_Century Initiative Full Report 2024 – EN.pdf (website-files.com)

Conseil du patronat du Québec. 2022. Livre blanc sur l’immigration: Portait et solutions. Montréal, May. At Livre blanc sur l’immigration – Portrait et solutions | Conseil du patronat du Québec (cpq.qc.ca)

Dion, Richard, and David Dodge. 2023. “Labour force growth and labour market gap in Canada: 2011 to 2032.” Working Paper. Ottawa: Bennett Jones, May.

Doyle, Matthew, Mikal Skuterud and Christopher Worswick. 2024. Optimizing Immigration for Economic Growth. Commentary No. 662. Toronto: C.D. Howe Institute.

Elsby, Michael, Ryan Michaels and David Ratner. 2015. “The Beveridge Curve: A Survey.” Journal of Economic Literature 53(3): 571-630.

Fortin, Pierre.2024. “Does immigration help alleviate economy-wide labour shortages?” Working Paper #70, Canadian Labour Economics Forum, University of Waterloo. May.

Government of Canada. 2024. 2024 Annual Report to Parliament on Immigration. Immigration, Refugees and Citizenship Canada. October.

Hazell, Jonathon, Juan Herreño, Emi Nakamura, and Jón Steinsson. 2022. “The Slope of the Phillips Curve: Evidence from US states.” Quarterly Journal of Economics 137(3): 1299-1344.

Lam, Alexander. 2022. “Canada’s Beveridge curve and the outlook for the labour market.” Staff Analytical Note 2022-18, Bank of Canada, Ottawa. November.

Lu, Yuqian, and Feng Hou. 2023. “Foreign workers in Canada: distribution of paid employment by industry.” Economic and Social Reports. Catalogue No. 36-28-0001. Ottawa: Statistics Canada. December.

Mahboubi, Parisa, and William Robson. 2018. “Inflated Expectations: More Immigrants Can’t Solve Canada’s Aging Problem on Their Own.” E-Brief. Toronto: C.D. Howe Institute.

Michaillat, Pascal, and Emmanuel Saez. 2021. “Beveridgean unemployment gap.” Journal of Public Economics Plus 2. December.

Morissette, René, Vincent Hardy and Voltek Zolkiewski. 2023. “Working most hours from home: new estimates for January to April 2022.” Analytical Studies Branch Research Papers Series. Catalogue no. 11F0019M, No. 472. Ottawa: Statistics Canada. July.

Pissarides, Christopher. 2000. Equilibrium Unemployment Theory. Cambridge MA: MIT Press.

Putnam, Robert. 2007. “E Pluribus Unum: Diversity and community in the twenty-first century: The 2006 Johan Skytte Prize Lecture.” Scandinavian Political Studies 30(2): 137-174.

Romer, Christina, and David Romer. 2019. “NBER business cycle dating: Retrospect and prospect.” Paper prepared for the session “NBER and the Evolution of Economic Research, 1920–2020” at the ASSA Annual Meeting, San Diego, California, January 2020. Department of Economics, University of California, Berkeley.

Samuelson, Paul. 1955. Economics: An Introductory Analysis. New York: McGraw-Hill.

Schirle, Tammy. 2024. “Settling into a New Normal? Working from Home across Canada.” E-Brief. Toronto: C.D. Howe Institute.

Shimer, Robert. 2012. “Reassessing the Ins and Outs of Unemployment.” Review of Economic Dynamics 15(2): 127-148.

Statistics Canada. 2024. Job vacancies, third quarter 2023. January 18. https://www150.statcan.gc.ca/n1/en/daily-quotidien/240118/dq240118c-eng.pdf?st=36gTb__Z

World Economic Forum- Global Cooperation At Crossroads

The Global Cooperation Barometer indicates that international cooperation has “flatlined”, driven by heightened geopolitical tensions and instability, but positive momentum in climate finance, health and innovation offers hope.
In an era of heightened volatility, leaders will need to embrace “disordered” cooperation and dynamic, solutions-driven decision-making to deliver tangible results and build trust. AI and other emerging technologies are reshaping the global landscape and driving upheaval. Concerted cooperation will be critical to harness benefits and minimize risks.

Geneva, Switzerland, January 2025 – The World Economic Forum’s Global Cooperation Barometer offers a critical assessment of the state of global cooperation, showing a world grappling with heightened competition and conflict, while also identifying various areas where leaders can drive progress through innovative collaboration. Released amid geopolitical, technological and sociopolitical upheaval, the Forum’s flagship annual report underscores the urgency of addressing shared challenges and offers leaders guidance on what cooperation can look like in a shifting world.
 
The Global Cooperation Barometer 2025, developed in collaboration with McKinsey & Company, uses 41 indicators to measure the current state of global cooperation. The aim is to offer leaders a tool to better understand the contours of cooperation broadly and along five pillars: trade and capital flows, innovation and technology, climate and natural capital, health and wellness, and peace and security. Now in its second edition, the Barometer draws on new data to provide an updated picture of the global cooperation landscape, with a particular focus on the impact of the new technological age.
 
“The Barometer is being released at a moment of great global instability and at a time when many new governments are developing agendas for the year, and their terms, ahead,” said Børge Brende, President and CEO of the World Economic Forum. “What the Barometer shows is that cooperation is not only essential to address crucial economic, environmental and technological challenges, it is possible within today’s more turbulent context.”
 
“This second edition of the Global Cooperation Barometer focuses on where cooperation stands today and what it can look like in the new technological age,” said Bob Sternfels, Global Managing Partner, McKinsey & Company. “Advancing global innovation, health, prosperity and resilience cannot be done alone. Leaders will need new mechanisms for working together on key priorities, even as they disagree on others, and the past several years have shown this balance is possible.”

The latest edition of the Barometer highlights that global cooperation is at a critical juncture. The report’s analysis reveals that after trending positively for a decade and surpassing pre-pandemic levels, overall cooperation has stagnated.

This has been driven by a sharp decline of the peace and security pillar of the Barometer over the past seven years, caused by mounting geopolitical tensions and competition which have significantly eroded global collective security. Levels of conflict and attendant humanitarian crises have increased in the past year to record levels, driven by crises including, but not limited to, the Middle East, Ukraine and Sudan.

As the largely stable cooperative order that defined the post-Cold War period is giving way to a more fragmented landscape, solutions to pressing challenges – from climate action to technological governance – require collaboration. And despite the global security crises, the new findings indicate that collaboration has continued in various areas including vaccine distribution, scientific research, renewable energy development, and more – offering models for future cooperation.
Notably, peace and security have declined sharply in recent years, but other pillars of the Barometer have remained resilient and reveal emerging opportunities for international cooperation,

Innovation and technology. While geopolitical competition is rising in regard to certain frontier technologies such as semiconductors, overall global cooperation on technology and innovation advanced in 2023, in part due to digitization of the global economy. This helped drive the adoption of new technologies, a strong ramp-up in the supply of critical minerals – and a related drop in price of lithium batteries – and a rebound in student mobility. However, rapid disruption from emerging technologies such as AI is reshaping the global landscape, raising the possibility of a new frontline of geostrategic competition or even an “AI arms race”. Cooperative leadership and inclusive strategies will be key to harness its vast potential while tackling risks.

Climate and natural capital: Cooperation on climate goals improved over the past year, with increased finance flows and higher trade in low-carbon technologies such as solar, wind and electric vehicles. Yet, urgent action is required to meet net-zero targets as global emissions continue to rise. Greater global cooperation will be essential to scale up technologies and secure the financing needed to meet climate goals by 2030.

Health and wellness: Some health outcomes, including life expectancy, continued to improve post-pandemic, but overall progress is slowing compared to pre-2020. While cross-border assistance and pharmaceutical R&D have declined, and cooperation on trade in health goods and international regulations stalled, various health metrics including child and maternal mortality remain strong. Given rising health risks and ageing populations, leaders should invest in global cooperation to bolster public health and sustainable health systems.

Trade and capital flows: Metrics related to the flow of goods and services, trade, capital and people had mixed outcomes in 2023. Goods trade declined by 5%, driven largely by slower growth in China and other developing economies, while global fragmentation continued to reduce trade between Western and Eastern-aligned blocs. Despite this, global flows of services, capital and people showed resilience. Foreign direct investment surged, particularly in strategic sectors like semiconductors and green energy, while labour migration and remittances rebounded strongly, surpassing pre-pandemic levels.Looking ahead, leaders will need to find ways to work together, even as competition increases, as tangible results will be crucial to maintain public trust and support. The report concludes by underscoring the urgent need for adaptive, solutions-driven leadership to navigate a turbulent global landscape. By pivoting towards cooperative solutions, leaders can rebuild trust, drive meaningful change and unlock new opportunities for shared progress and resilience in the complex years ahead.
 
About the Global Cooperation Barometer Methodology
 
The Global Cooperation Barometer – first launched in 2024 – evaluates global collaboration across five interconnected dimensions: trade and capital, innovation and technology, climate and natural capital, health and wellness, and peace and security. The Barometer is built on 41 indicators, categorized as cooperative action metrics (evidence of tangible cooperation, such as trade volumes, capital flows, or intellectual property exchanges) and outcome metrics (broader measures of progress like reductions in greenhouse gas emissions or improvements in life expectancy). Spanning 2012–2023 and indexed to 2020 to reflect pandemic-era shifts, the Barometer normalizes data for comparability (e.g., financial metrics relative to global GDP and migration metrics to population levels) and weights it equally within and across pillars.
 
About the Annual Meeting 2025
 
The World Economic Forum Annual Meeting 2025, taking place in Davos-Klosters from 20 to 24 January, convenes global leaders under the theme, Collaboration for the Intelligent Age. The meeting will foster new partnerships and insights to shape a more sustainable, inclusive future in an era of rapidly advancing technology, focusing on five key areas: Reimagining Growth, Industries in the Intelligent Age, Investing in People, Safeguarding the Planet, and Rebuilding TrustClick here to learn more.

Canada Should Embrace Trump Presidency Opportunities

From: Chris Christie
To: Nervous Canadians 
Date: November 6, 2024 
Re: Canada Should Embrace the Opportunities of a Second Trump Presidency

A second Donald Trump presidency, if approached strategically, offers Canada more opportunities than risks.

Donald Trump’s campaign rhetoric is often erratic, of that there is no doubt. And I, as you might have heard, am not a Donald Trump advocate.

But what happens in governance under Trump is a far cry from his provocative online posts or bombastic speeches, as I argued in the latest C.D. Howe Institute Regent Debate. His track record speaks for itself, and whether you choose to acknowledge it or not, Canada has already benefitted from Trump-era policies.

Let’s take the US-Mexico-Canada Agreement – CUSMA in the Canadian rendering – as a prime example. Trump’s renegotiation of NAFTA wasn’t just about putting “America first.” It was about reshaping trade relationships in North America to benefit all three countries. The agreement secured economic ties between the US, Canada, and Mexico in a way that ensures long-term growth for all parties involved.

Trump views that agreement as one of his crowning achievements, and rest assured, it’s not going anywhere. It is a durable platform for growth in North American trade.

Looking forward, the question isn’t whether Trump is unpredictable. It’s whether Canada can recognize and leverage the opportunities his policies present.

With Trump re-elected, his administration will continue to focus on policies that drive economic growth – lower taxes, reduced regulations, and energy independence. A booming US economy means a stronger Canada, as our two economies are deeply intertwined. When one prospers, the other stands to benefit through increased trade and investment.

Trump’s approach to trade – especially tariffs – has often been misunderstood. Yes, his speech-making is aggressive. But we need to separate rhetoric from reality. Trump’s actual policies were more measured than many anticipated. And they will be again. 

The real adversary for Donald Trump is China, not Canada. If Trump tightens the screws on China’s unfair trade practices, it could create space for Canadian companies to flourish on a more level playing field, particularly in sectors like technology and intellectual property, where China has been a major violator.

Trump’s economic philosophy – focused on cutting taxes and regulations to unleash private-sector growth – should also serve as a wake-up call for Canada. Under Prime Minister Trudeau, Canada has taken a ruinous policy road, with higher taxes and more government intervention in business.

But what if Canada aligned itself more closely with the pro-growth policies Trump advocates? 

Imagine the potential for Canadian businesses if they operated in an environment with fewer barriers to growth. A thriving private sector in Canada would strengthen the economy and create more opportunities for collaboration and trade with the US.

I won’t pretend that a second term comes without challenges. But instead of focusing on the personality occupying the Oval Office, Canada should focus on how to navigate the opportunities presented by our shared future as neighbours and trade partners.

It’s time to stop seeing Trump as an unpredictable threat and start recognizing the potential opportunities his policies can bring. Canada stands to benefit if it plays its cards right. For the Silo, Chris Christie.

Chris Christie was the 55th Governor of New Jersey and a participant in the C.D. Howe Institute’s recent Regent Debate. Send comments to Chris via this link.

Alleged Terrorist Plotter Was Seeking Refugee Status in Canada

The Pakistani national who allegedly plotted to travel to New York to murder Jews was seeking refugee status in Canada, according to an immigration consultant.

Muhammad Shahzeb Khan, who came to Canada in June 2023 on a student visa, was arrested on Sept. 4 by the RCMP for allegedly intending to carry out a mass shooting targeting Jews in New York City. He was charged by U.S. authorities with attempting to provide material support and resources to a designated foreign terrorist organization, the Islamic State of Iraq and al-Sham (ISIS), and the United States is seeking to have him extradited.

Fazal Qadeer, an immigration consultant who had worked with Khan, said Khan was applying for refugee status on the basis of sexual orientation, saying he is gay, CBC reported on Oct. 7.

It is not known what Khan’s refugee claim status was when he was arrested, but Qadeer said Khan had recently had a lengthy interview with Immigration, Refugee and Citizenship Canada (IRCC).

Immigration Minister Marc Miller said in September that Khan entered Canada on a student visa.

According to a U.S. criminal complaint that was unsealed in September 2024, Khan repeatedly expressed his support for ISIS and his intention to carry out a terrorist attack around November 2023.

That month, he began interacting online with an undercover FBI agent, and explained his plan to attack Jewish religious centres in the United States around the time of the one-year anniversary of Hamas’s Oct. 7 terrorist attack against Israel.

Pakistani National Charged in Murder-for-Hire Plot Against US Official

What We Know About the Alleged ISIS Terror Plot by Pakistani National Arrested in Canada

In a statement, IRCC said it would not comment on individual cases, but that all asylum claimants receive an “independent and fair assessment on the individual merits of their claim,” which included whether they fear persecution based on race, religion, political opinion, nationality, or if they are LGBT.

Minister ‘Confident’ in Screening System

Khan’s arrest came months after a father and son were arrested by the RCMP in Richmond Hill, Ont., for allegedly being in the “advanced stages of planning a serious, violent attack in Toronto.” The two are facing nine terrorism charges, including conspiracy to commit murder on behalf of ISIS.

Ahmed Eldidi had been admitted into Canada in 2019 and later given citizenship, while Mostafa Eldidi was granted refugee status, according to documents provided by IRCC.

Miller defended Ottawa’s immigration system when appearing before the House of Commons public safety committee in September, saying the government remains “confident in the way our biometric system works in the progressive screening that operates in our country.”

Miller told the committee that Ahmed Eldidi had his initial temporary resident visa application refused because of concerns he would not leave Canada at the end of his authorized stay, but his second application was approved after an officer was satisfied he merely intended to visit Canada. He was given a favourable recommendation, Miller said, and officers found no issues that made him inadmissible to Canada.

Conservative MPs on the committee questioned screening procedures and accused the Liberal government of removing the mandatory requirement for police background checks for arrivals from some countries including Pakistan in 2018.

The IRCC’s website currently states that those applying for permanent residence, citizenship, or the International Experience Canada program “may need to provide a police certificate for any other programs” if they have a prior criminal record, but does not specifically mention Pakistan. For the Silo, Matthew Horwood.

Featured image- RCMP logo is seen outside the force’s ‘E’ division headquarters in Surrey, B.C., on March 16, 2023. The Canadian Press/Darryl Dyck.


Canada’s Digital Services Tax is in US Crosshairs 

From: Jon Johnson
To: Global Affairs Canada 

On August 30, the US requested consultations respecting Canada’s Digital Services Tax Act under the dispute settlement procedure set out in the Canada-US-Mexico Agreement (CUSMA). The US maintains that by imposing the tax, Canada has failed to provide US service providers and investors treatment no less favourable than it provides to Canadian service providers and investors. Given Canada’s unique trade relationship with the US, this could have major implications.

The essence of the complaint is that Canada is violating a specific CUSMA obligation to grant US firms terms that are no less favourable than its own companies receive.

This is called national treatment. The crux of the US argument is that the revenue and earnings thresholds are so high that no Canadian service provider would be subject to the tax, but at least some US providers would be. While the DST is not discriminatory on its face, its practical effect is discriminatory. 

Canada’s taxation of digital services has been an on-going contentious issue with the US. The new legislation entered into effect on June 20 and imposes a 3-percent levy – retroactive to January 1, 2022 – on revenue (not income) earned from digital services when certain thresholds are met. Annual gross revenues in a calendar year must exceed €750 million for the tax to apply. The taxpayer must also earn at least C$20 million in Canadian digital services revenue in a calendar year. Affected companies are to start paying the tax next June 30. 

On August 1, the Congressional Research Office released a paper outlining multiple concerns. It cites industry associations that maintain that Canada’s DST could “cost US exporters and the US tax base up to $2.3 billion annually and could directly result in the loss of thousands of full-time US jobs.” The paper also cites possible violations of CUSMA and WTO obligations. 

The paper also notes that the United States Trade Representative (USTR) has applied sanctions under Section 301 of the 1974 Trade Act against digital services taxes enacted by other countries. Section 301 is much broader in its application than either CUSMA or the WTO.

The CUSMA panel could decide for the US if the facts establish that only US companies meet the €750 million threshold for overall earnings and whose Canadian digital earnings exceed C$20,000,000. 

Aside from the possibility of an adverse panel decision and action by the US under Section 301, there are other factors that Global Affairs Canada should consider before the Canadian government commences with the retroactive portion of the tax.  

CUSMA is up for renegotiation on July 1, 2026. The process on the US side starts with a USTR report to Congress, due by the end of 2025, that will include an assessment of CUSMA’s operation, as well as a recommendation on CUSMA extension. As Canadian initiatives to impose digital taxes have been a US concern for years now, the recommendation will doubtless address the question of Canada’s DST regime. If that regime remains an open issue and US concerns are not satisfied, the stage could be set for the ultimate demise of CUSMA in 2036.

CUSMA Article 32.6 also provides that a party can withdraw from CUSMA upon giving six months’ notice to the other parties.  

Decision time for the Canadian government falls on June 30, 2025, and it has to decide whether to go ahead and start collecting its retroactive DST and face the inevitable hostile reaction of its largest trading partner. This has to be carefully managed, or this small issue could become a big one. For the Silo, Jon Johnson.

Jon Johnson is a former advisor to the Canadian government during NAFTA negotiations and is a Senior Fellow at the C.D. Howe Institute.

Pafi Muara Bungo Pharmacists Fight Indonesian Colonialism

Pharmacists In Indonesia A Cut Above

The Indonesian Pharmacist Association or more popularly abbreviated as Pafi is a forum for pharmacists in Indonesia to participate in improving the level of public welfare, especially in the fields of Public Health and Pharmacy, in addition to their daily duties.

One of the active branches that continues to strive to improve the quality of pharmaceutical services is Pafi Muara Bungo. For more complete information, check the website .

To facilitate providing the best service to the community, Pafi Muara Bungo continues to develop various initiatives and programs, including providing online registration for pharmacist members in the district.

The PAFI organization is a Professional Organization that is Work and Service-oriented.

In this case, it has 4 goals, such as:

Realizing a Just and Prosperous Society based on Pancasila and the 1945 Constitution quoted from the central PAFI, in fact, Indonesian Pharmacists have existed since the Proclamation of Independence of the Unitary State of the Republic of Indonesia on August 17, 1945, have fought side by side with all groups of society, to eliminate colonialism from the face of the earth of Indonesia, and have actively participated in defending the Unitary State of the Republic of Indonesia and then participated in Community and State Development.

Therefore, Indonesian Pharmacists are one of the development potentials that have never been absent in the struggle for state development until today, continuing to optimize services to the Indonesian people.

Realizing Optimal Health for the Indonesian People

The second goal of PAFI is to realize optimal health for the Indonesian people. In this case, PAFI Muara Bungo is actively disseminating information about health and the importance of proper drug use. Such as, recommendations to increase awareness before consuming these drugs, consulting with doctors and pharmacists before using drugs, and providing education related to disease prevention.

Developing and improving Indonesian Pharmaceutical Development

Developing and improving development in the world of automatic pharmacy can also increase efficiency and accuracy in providing services to the wider community.

Both the central Pafi and Pafi Muara Bungo in particular have developed an integrated pharmaceutical information system. It is expected to be able to provide faster and more accurate information online. So that health information is easily accessible to various levels of society.

Improving Member Welfare

One of the main goals of Pafi Muara Bungo is to improve the competence and welfare of its members. Various training and seminar information for Muara Bungo pharmacy experts is updated on the website.

It is hoped that with the increasing competence possessed, the welfare of Pafi members will also increase. Good news for pharmacists can join the training, the first step, register first to become a member of Pafi Muara Bungo.

Training and seminars on pharmacy management, the use of technology in pharmacy services, and the development of soft skills such as communication and auto services can be followed. In addition, there is a lot of job vacancy information for fresh graduates and pharmacists for better jobs. For the Silo, Anna Melnikova.

Third Swing At Canada Carbon Tax Analysis By PBO

Let’s Hope for Solid Hit from the PBO’s Third Swing at Carbon Tax Analysis

The “corrected” analysis by the Parliamentary Budget Office of the carbon tax and rebates is due soon. One hopes it will get more things right in this third crack at evaluating the government of Canada’s assurance that most Canadians will receive enough from the carbon tax rebates to cover their cost of paying the tax.

Reporting in 2022 and in an update last year, the PBO analysis confirmed the government assertion so long as induced economic effects from the carbon levy are not included. However, once the economic damage from the levy is included, the PBO concluded that the rebates fall short of keeping family budgets whole. 

The PBO’s conclusion was seized on by Conservative politicians and others to justify calls to revoke the carbon tax. Now, more knives have come out. The NDP says it would scrap the tax on households and put the burden on large emitters, but it does not yet explain how it would square that with the current big-emitter carbon tax. And BC, where carbon taxing began in Canada, has said it would drop the tax if Ottawa removed the legal requirement.

Much is at stake with this third PBO swing.

After the second report, the PBO admitted that its analysis had included, in addition to the carbon tax on households, the tax on large emitters as well. The economic impacts had been taken from work passed over to the PBO by Environment and Climate Change Canada (ECCC), which included the effects of the tax as applied to both industrial and household payers. The budget officer said the error was small and had little consequence for the analysis and promised a corrected version this fall. 

The Canadian Climate Institute estimates that 20-48 percent of the emissions reduction by 2030 will come from the levy on large emitters compared to 8-14 percent from households. Given the scale of the large emitters tax, it is likely that it has significant economic effects on any forecast. Fixing this should not, however, be the most consequential revision to its analysis. 

The PBO’s first two efforts had an analytical asymmetry. It measured the economic cost originating in the tax, exaggerated as it turned out, but did not attempt to capture the economic benefits (not to mention any health gains) from the effects of the household carbon levy in mitigating climate change. Put differently, their work was, in effect, based upon the faulty premise that climate change brings no economic damage. The massive and growing costs of cleaning up fire and flood damage and adapting to the many other consequences of global warming bear evidence of such costs. The PBO could and should do its own analysis of those climate change costs and, hence, the benefits of mitigation. Or it could more easily tap into the substantial body of available literature.

Lowering Canada’s Gross Domestic Product

In Damage Control, the Canadian Climate Institute estimated climate change would lower the Gross Domestic Product by $35 billion from what it would otherwise have been in 2030; the impact would rise to $80 to $103 billion by 2055. Through cutting emissions, the household carbon tax will reduce this cost. International literature is rich, and the PBO could review it for applicability to Canada. As but one example, Howard and Sterner’s (2017) meta-analysis on the impacts of climate change concluded most studies underestimated them. Their preferred estimate points to a GDP hit of between 7 and 8 percent of GDP if there are no catastrophic damages and 9 to 10 percent if there are. Conceptual thinking is also advancing. Consideration is being given to there being “tipping points” where a certain degree of climate change may have much more non-linear dramatic economic effects. Some, like Stern and Stigliz, even question the worth of comparing an economic outlook with mitigation action against a status quo baseline as the PBO has done. They argue that without mitigation, there may not be a sustainable economic outcome. 

Finally, those still inclined to think that a corrected Fall 2024 PBO report will provide ammunition to “axe the tax” need to ask themselves two questions.

First, is there value in the emissions reduction resulting from the household carbon tax? The Canadian Climate Institute concludes that the 8-14 percent contribution to emissions reduction by 2030 will grow in later years. Even with the tax and all the other policies announced to date, there is a 42-megatonne gap in Canada’s 2030 emissions reduction target. More than 200 Canadian economists signed an open letter asserting that “carbon pricing is the lowest cost approach because it gives each person and business the flexibility to choose the best way to reduce their carbon footprints. Other methods, such as direct regulations, tend to be more intrusive and inflexible, and cost more.” If not the household carbon tax, then what else?  

Let us hope the PBO’s third carbon tax report gives evidence to form a more balanced perspective. For The Silo, Don Drummond/C.D. Howe Institute.

Don Drummond is the Stauffer-Dunning Fellow in Global Public Policy and Adjunct Professor at the School of Policy Studies at Queen’s University and a Fellow-In-Residence at the C.D. Howe Institute.

Basic Living Standard Arithmetic For Ottawa And All Governments

September , 2024

To: Canadians concerned about prosperity 
From: Don Wright 
Date: September 4, 2024
Re: Some Basic Living Standard Arithmetic for Governments

Governments often talk about “creating jobs,” but what they really do is choose some jobs at the expense of others. With their myriad spending, taxing and regulatory decisions, all governments try to direct job growth to different sectors – public or private, services or goods, resources or non-resources, and so on.

We all hope governments choose wisely.

It would help if they started paying more explicit attention to one factor: The impact of their decisions on Canadians’ standard of living.

A country’s standard of living is largely determined by the wages and net government revenue its tradeable goods and services sector can pay while remaining competitive against international competitors. If a company or sector is uncompetitive, it will have to either lower its wages, pay less tax or go out of business. These pressures on companies are never-ending. They determine both the wages a sector can afford to pay, and, through the interconnectedness of labour markets, average wages across the economy.

Some industries are so productive they can pay relatively high wages and significant taxes and yet remain competitive.

Industries that aren’t as productive can only pay lower wages and less tax.

Governments whose policies have the effect of moving labour from one sector to another had better pay attention to such facts.

Canadians may not like it but many of the country’s best-paying and most tax-rich jobs are found in natural resources. I was head of British Columbia’s public service. For most of B.C.’s history the province’s economic base has been dominated by natural resource industries – forestry, mining, oil and gas, agriculture and fishing. For a variety of reasons, these industries face strong political headwinds. Many groups press to constrain them and diversify away from them. The alternatives proposed include technology, film and tourism.

A few years ago, I asked officials in the province’s finance ministry to assess the relative performance of these different industries along the two key dimensions of average wages and net government revenue. In 2019-20 B.C. spent approximately $11,700 per citizen. Half the population was employed that year. So, to “break even” (i.e., have a balanced budget), the province had to collect $23,400 per employed person. If you look at things this way, each industry’s “profit” or “loss” is simply its revenue per employee less $23,400.

No such calculation will be exact, of course.

Several assumptions have to be made to get to an average “profit” or “loss” per employee. But, with that caveat, the numbers the officials brought back were telling. The industry with the biggest return to the province was oil and gas, at $35,500 per employee. Forestry was next, at $32,900. Then mining, at $14,900, and technology, though only at $900.

By this measure of profit and loss, however, film was a money loser, at -$13,400, and so was tourism, at -$6,900.

The negative numbers for the film industry reflect the very significant subsidies that B.C. (like many other provinces) provides to this sector. The negative number for the tourism sector primarily reflects low average wages per employee, which translate into relatively low personal income tax, sales tax and other taxes paid by employees.

These “profit or loss” numbers are not in any way a judgment about workers in these sectors. People find the best employment available to them in the labour market. Relative demands in that market are determined by many factors, none of which workers control. That said, if governments consciously move resources from the “profit” industries to the “loss” industries, they had better be aware of the consequences for wages, taxes and the overall standard of living.

The numbers I’ve cited were for a single year in British Columbia. The same analysis for other provinces or for Canada as a whole would likely produce different numbers – though I’d be surprised if the overall pattern were much different. Voters will draw their own conclusions about the impact on British Columbians’ standard of living from constraining the resource industries and promoting other industries instead.

Unfortunately, this type of analysis is rarely done when Canadian governments make decisions about what types of jobs they want to give preference to through their taxation, spending and regulatory decisions. They should do more of it. Ultimately, if [they] care about Canadians’ standard of living, governments need to start paying attention to the basic arithmetic of that standard of living.

Don Wright, senior fellow at the C.D. Howe Institute and senior counsel at Global Public Affairs, previously served as deputy minister to B.C.’s premier, cabinet secretary and head of the public service.

How Canada Can Make Faster Major Project Decisions

June,2024 – Lengthy delays and regulatory uncertainty is deterring investment in major infrastructure projects in Canada, according to a new report from the C.D. Howe Institute. In “Smoothing the Path: How Canada Can Make Faster Major-Project Decisions”, authors Charles DeLand and Brad Gilmour find that Canada’s regulatory approval process is creating high costs for investors and preventing critical projects in hydrocarbon production, mining, electricity generation, electricity transmission, ports and other infrastructure from being built.

Sectors that have historically driven business investment and productivity in Canada—mining, oil and gas—are most affected by complex regulatory procedures.

While investments in these sectors have supported high incomes for workers and high revenues for government in the past, they are now trending downwards. “Canada is struggling to complete large infrastructure projects in a reasonable time frame and at a reasonable price and the proposed amendments to the Impact Assessment Act (IAA) are insufficient,” says Gilmour.

  • Canadians have been debating whether Canada’s regulatory and permitting processes strike the right balance between attracting investments in major resource projects and mitigating potential harm from those investments.
  • These regulatory processes typically apply to complex and expensive projects, such as mines, large hydrocarbon production projects (oil sands, liquefied natural gas [LNG], offshore oil), electricity generation (hydroelectric dams, nuclear), electricity transmission (wires), ports and oil or natural gas pipelines. These projects often involve multiple levels of jurisdiction and can prove particularly slow to gain government approval.
  • Canada struggles to complete large infrastructure projects, let alone cheaply and quickly. We propose improving major project approval processes by: (a) ensuring that provincial and federal governments respect jurisdictional boundaries; (b) leaving the decision-making to the expert, politically independent tribunals that are best positioned to assess the overall public interest of an activity; (c) drafting legislation with precision that focuses review on matters that are relevant to the particular project being assessed; and (d) confirming the need to rely on the regulatory review process and the approvals granted for the construction and operation of the project.

The Full Report

Open Letter To The West On The New World Order

Paul Jenkins – The West and a Workable New World Order?

From: Paul Jenkins

To: Global governance observers

Date: May 2, 2024

Re: The West and a Workable New World Order?

One can describe the so-called liberal world order as a set of ideas for organizing world democracies. While openness and trade, rules and institutions, and co-operative security have been the principles that have shaped the liberal order, it also required sovereign nation states to provide the foundation for the creation and development of a system of intergovernmental organizations, or system of global governance.

In the aftermath of the Second World War, the system was designed primarily for the advancement, economically and politically, of Europe and the United States. Yet since 1945 the liberal world order has evolved, giving impetus to the steady increase in global economic integration to the benefit of many nations and people. 

Advances in science and technology have been critical to the evolution of the liberal order, but there has also been a need for the structures of global governance to evolve and keep pace.

On the economic front, for example, the collapse of the Bretton Woods system of fixed exchange rates, following Richard Nixon’s 1971 decision to abandon the dollar’s link to gold, gave rise to the creation of the G7. And the Asian Crisis of 1999 led to the creation of the G20.

Throughout the entire postwar period, however, tensions inherent between the sovereign authority of the nation-state and the need for collective global governance increasingly challenged the liberal order.

Indeed, the advent of the Cold War led to the liberal world order becoming hegemonic, organized around the economic and political strength of the United States with its dominance of global governance through the various institutions making up the global governance system. 

But over the years, pushback took hold. As the benefits of global economic integration spread and the United States was no longer the singular engine of growth, both democratic and autocratic countries found voice and began to resist the principles that shaped the liberal order. Even core nations of the liberal order began to voice their concerns in the aftermath of the Global Financial Crisis as the market-based financial system failed to self-regulate (as had been advertised), and as the liberal order proved unable to provide social protection for those adversely affected by globalization.

Effectively, a new world order began to unfold, with the resulting slowing and even fragmentation [DS1] [PJ2] of global economic integration.

At the same time though, virtually all nations, regardless of regime or stage of development, are facing the same challenges: Financial instabilities, rising inequality, weak productivity growth, climate change, spread of infectious disease, AI, cyber security and on and on.

These vulnerabilities represent global risks that can only be tackled and minimized through collective action. This in turn requires a new world order that treats the world as it is, not how we wish it to be. 

What does this mean for the West, and in particular the United States and Canada?

The unique advantages of the United States are its open society, fair and law-based market economy, and allure for talent from around the world. To sustain these advantages, maintaining its wealth and its position as the centre of the free world, it cannot close its doors to further global economic integration.

Geopolitically, what might this look like?

John Ikenberry argues that the answer can be found in the principles of sovereignty, territorial integrity, and non-intervention of the Westphalian system, the 1648 treaties that ended the Thirty Years’ War and established the modern nation state. The key insight of the Westphalian system is that all countries are vulnerable to the same global risks. The leap forward in mindset that is required is the acceptance that states are the rightful political units of legitimate rule. 

For the West, and the United States in particular, this implies the need to accept these new realities, and in so doing, the need to work together to build a new world order that preserves their liberal democratic values, and those of its allies, while at the same time recognizing that the economic challenges they face are not unique to them.

The unfolding relationship between the United States and China will define whether we achieve a workable new world order.

The economic incentives are there for this to happen. 

For China, the incentive is further progress in closing both its internal income gap as well as the gap between itself and the developed world. The payoff would be setting in place the foundation for a sustained rise in living standards for all its citizens. 

For the United States, the incentive is in preserving its strength as an open society and its vision of the world that has considered the interests of others. In many respects, it remains uniquely capable of playing the central role in sustaining the global economic system.

The challenge in re-imagining such a new world order is geopolitical. The task is to renew global governance with today’s realities in sharp focus.

Paul Jenkins. Mister Jenkins is a former senior deputy governor of the Bank of Canada and a senior fellow at the C.D. Howe Institute.

Deadly Virus Flew From Canada To China On Commercial Flight

Minister Says He Was Taken Aback After Learning Deadly Viruses Were Shipped From Winnipeg Lab to Wuhan

Report first published via friends at The Epoch Times

Minister Says He Was Taken Aback After Learning Deadly Viruses Were Shipped From Winnipeg Lab to Wuhan
Canada Minister of Public Safety Dominic LeBlanc speaks in the Foyer of the House of Commons on Parliament Hill in Ottawa, on March 20, 2024. (The Canadian Press/Spencer Colby)

After learning that samples of deadly Ebola and Nipah viruses had been sent from Canada’s top-security lab in Winnipeg to China, Public Safety Minister Dominic LeBlanc said his reaction was similar to that of an MP who expressed incredulity upon learning of the move.

“I’m really concerned about the March 2019 incident where [Winnipeg lab scientists Xiangguo Qiu and Keding Cheng] were implicated in a shipment of live Ebola in Hanipah [Nipah] viruses on a commercial Air Canada flight. How the hell did that happen?” NDP MP Charlie Angus asked during a House of Commons Canada-China committee meeting on April 15.

In response, Mr. LeBlanc said, “When I saw that report, and publicly, I had the same reaction as you.”

A partly redacted national memo sent by the prime minister’s national security advisor to Prime Minister Justin Trudeau on June 29, 2017.

The minister deferred Mr. Angus’ question to the Public Health Agency of Canada, saying, “I don’t have any [information], but I had the same reaction as you, Mr. Angus.”

Mr. LeBlanc, who became minister of public safety in July 2023, was previously minister of intergovernmental affairs starting in July 2018.

The National Microbiology Laboratory (NML) in Winnipeg shipped 15 different strains of Nipah and Ebola viruses to the Wuhan Institute of Virology (WIV) in China on March 31, 2019. The package was sent from Winnipeg to Toronto and then on to Beijing via a commercial Air Canada flight.

Timeline: What Declassified Documents Reveal About the Fired Winnipeg Lab Scientists

Ms. Qiu and Mr. Cheng

The request to the NML management for the shipment of the viruses was facilitated by Ms. Qiu. The shipment was eventually approved by the NML management.

Ms. Qiu and Mr. Cheng, a married couple, were escorted out of the NML in July 2019 while under RCMP investigation. The couple were fired from their positions on Jan. 20, 2021, for having undisclosed ties to Chinese regime entities.

In 2021, in response to MPs’ questions about why the NML shipped virus samples to the Wuhan lab, laboratory management said the shipment followed all proper protocols and was in response to a letter from the Chinese lab indicating that they were to be used to understand their pathophysiology—the nature of infection—and the development of antivirals.

Declassified intelligence documents show that Ms. Qiu also sent antibodies and other materials to China without prior approval.

Shipments included antibodies for the China National Institute for Food and Drug Control, as well as small amounts sent to laboratories in the United Kingdom and the United States for testing.

The documents show that Ms. Qiu discussed the shipment of Ebola and Nipah with WIV employees in July 2018, and initially suggested that a formal agreement is not necessary as “no one owns the IP.” She also expressed “hope there is another way around” rather than issuing a formal agreement.

The documents also show that Ms. Qiu signed on to a project at WIV involving research on Ebola, and that some of the virus strains that were shipped from NML were meant for this project. Ms. Qiu had asked that the project remain a secret to her Canadian management as WIV was in the process of requesting the transfer of the virus strains from NML, the documents say.

Researchers work in the National Microbiology Laboratory in Winnipeg, Man., where the ZMapp antibody “cocktail” was created to fight Ebola. PHOTO BY HANDOUT

The Wuhan lab has been involved in synthetic biology research on the deadly Nipah virus, according to testimony from a U.S. scientist. Synthetic biology involves creating or redesigning biological entities and systems.

“The Nipah virus is a smaller virus than SARS2 [the virus causing COVID-19] and is much less transmissible,” Dr. Steven Quay, a Seattle-based physician-scientist, told a U.S. Senate subcommittee hearing on Aug. 3, 2022. “But it is one of the deadliest viruses, with a greater than 60 percent lethality” and 60 times deadlier than SARS2, he said. “This is the most dangerous research I have ever encountered.”

Chinese Talent Recruitment

During the April 15 House committee meeting, Mr. LeBlanc acknowledged revelations from the declassified documents that Ms. Qiu was involved in China’s Thousand Talents Program. The program was recognized by U.S. authorities as China’s efforts to “incentivize its members to steal foreign technologies needed to advance China’s national, military, and economic goals.”

It is clear that “elements from a Chinese-sponsored recruitment program were involved” at the Winnipeg lab, Mr. LeBlanc said. “It is well known that such programs are one way that China seeks to incentivize academics to participate in activities that exploit advancements in Canadian technologies.”

China is using the programs “to improve its military and intelligence capabilities, as well as the economic competitiveness all at the expense of Canada’s national interest,” the minister said.

He declined to address concerns raised by Conservative MP Michael Cooper regarding the delay in removing Ms. Qiu from the NML, saying it should be addressed to the health minister whose department is in charge of the Public Health Agency of Canada, which in turn oversees the NML.

Although concerns about the two were first raised in 2018, they weren’t fired until three years later. For The Silo, Andrew Chen. Omid Ghoreishi and Noé Chartier contributed to this report

Supplemental– Bio-warfare experts question why Canada was sending lethal viruses to China.

Supplemental- Canada sent untested ebola vaccine to World Health Organization.

Former Canada Finance Minister’s Thank-You Letter to WEF Suggests More Collaboration Than Disclosed

Former Finance Minister’s Thank-You Letter to WEF Suggests More Collaboration Than Disclosed
A press photographer works next to the logo of the World Economic Forum (WEF) at the opening of their annual meeting in Davos on Jan. 15, 2024. (Fabrice Coffrini/AFP via Getty Images)
Noé Chartier

By our friends at Epoch Times/ Noé Chartier

Close interactions between Canadian cabinet ministers and the World Economic Forum are well-documented, but a newly revealed letter suggests forum staff may have been doing more work with the federal government than previously disclosed.

In an undated letter to a WEF official, former Finance Minister Bill Morneau praised the organization and its collaboration to achieve “common” objectives.

“I would also like to take this opportunity to express my sincere appreciation to the WEF staff, for the support provided to the Government of Canada,” wrote Mr. Morneau in the letter obtained through the access-to-information regime.

Neither the WEF nor the Canadian government typically advertise what support the forum provides. The finance department has not replied to a request for information about the date of the letter and details of how WEF staff helped the government.

The letter was addressed to Philipp Rösler, a former German politician who served as a WEF manager and head of its Centre for Regional Strategies.

The federal government is known to have been involved in at least two WEF policy initiatives: the Known Traveller Digital Identification (KTDI) project and the Agile Nations network.

Poilievre Reaffirms Ban on WEF Ties in Conservative Party, Calls Davos Crowd ‘Hypocrites’

John Robson: The Feds’ Green Dreams Touted at WEF Are Detached From Reality

KTDI was a pilot project between Canada, the Netherlands, and private sector interests to develop a system of digital credentials for airplane travel between countries. Agile Nations is a group of countries working to streamline regulations to usher in the WEF-promoted “Fourth Industrial Revolution” that includes gene editing and artificial intelligence.

KTDI began in 2018, and Canada signed onto Agile Nations in November 2020, a few months after Mr. Morneau resigned during the WeCharity scandal. Both projects were worked on while Mr. Morneau was finance minister from 2015 to 2020.

Since both these projects fell outside of Mr. Morneau’s portfolio as finance minister, it seems to suggest that his letter of appreciation to the WEF was referring to other joint collaborations.

Canada's then-minister of Finance Bill Morneau speaks to the Canadian Club of Canada in Toronto, on March 6, 2020. (Cole Burston/The Canadian Press)
Canada’s then-minister of Finance Bill Morneau speaks to the Canadian Club of Canada in Toronto, on March 6, 2020. (Cole Burston/The Canadian Press)

The WEF’s mission statement says it is dedicated to “improving the state of the world.” It gathers leaders in the fields of politics, business, and activism to promote progressive policies on issues like climate change and making capitalism more “inclusive.” As is routine with the organization, it did not respond to requests for comment.

Critics of the WEF, which gathers world elites to shape global policies, often disagree with its progressive agenda and warn about its influence on countries.

“No staff, no ministers, no MPs in my caucus will be involved whatsoever in that organization,” Conservative Party Leader Pierre Poilievre said in January.

He added that officials who attend the forum’s annual meeting in Davos are “high flying, high tax, high carbon hypocrites” who travel in private jets while telling average citizens not to “heat their homes or drive their pickup trucks.”

Alberta Premier Danielle Smith has also criticized the WEF, saying in 2022 she finds it “distasteful when billionaires brag about how much control they have over political leaders, as the head of that organization has.”

Ms. Smith was likely referring to comments made by WEF founder and chairman Klaus Schwab in 2017, when he said said he was “very proud” to “penetrate the cabinets” of world governments, including that of Prime Minister Justin Trudeau.

“I know that half of his cabinet or even more than half of his cabinet are actually Young Global Leaders of the World Economic Forum,” Mr. Schwab told an audience at Harvard University.

WEF founder Klaus Schwab delivers a speech during the "Crystal Award" ceremony at the World Economic Forum annual meeting in Davos, on Jan. 16, 2023. (Fabrice Coffrini/AFP via Getty Images)
WEF founder Klaus Schwab delivers a speech during the “Crystal Award” ceremony at the World Economic Forum annual meeting in Davos, on Jan. 16, 2023. (Fabrice Coffrini/AFP via Getty Images)

Davos Links

Mr. Morneau’s letter to the WEF comes from internal Finance Department records and is the only document in the release package that pertains to Mr. Morneau. It consists mostly of praise for the organization.

“As a Steward of Economic Growth and Social Inclusion, I have had the privilege of observing first-hand and benefiting from the WEF’s important contributions to foster public and private collaboration towards developing concrete solutions for strong, broad-based economic growth,” he wrote, adding that WEF analysis of different topics such as “structural reform priorities” was “helpful to develop substantive policy measures.”

He wrote that “as we enter another ambitious year for the WEF, I look forward to a continued fruitful collaboration to pursue our common objective of achieving stronger, sustainable and more inclusive growth.”

Other department records relate to current Finance Minister Chrystia Freeland and her involvement with the WEF. She is a board member of the forum and also an alumnus of the Young Global Leaders program that Mr. Schwab referenced.

Mr. Morneau, who resigned as minister in 2020, is listed on the WEF website as an “agenda contributor“ and a ”digital member.” He was a regular participant at the group’s annual meetings in Davos, Switzerland, while he was in office.

During those years, the Finance Department’s media relations office wasn’t shy about advertising ministerial trips to Davos.

“Canada’s strong presence at the Forum underscores the importance of this meeting for shaping the international agenda and advancing economic opportunities for Canadians,” read a January 2020 press release from the department announcing Mr. Morneau’s trip.

The Finance Department has not returned inquiries in recent years pertaining to Ms. Freeland’s involvement with the WEF, nor has it issued press releases referencing her involvement.

Some have questioned whether Ms. Freeland’s role as deputy prime minister and finance minister as well as a forum board member constitutes a conflict of interest. The Office of the Conflict of Interest and Ethics Commissioner said in its 2022 annual report it received more than 1,000 requests in a two-month period from members of the public to investigate the participation of MPs and ministers in the WEF.

The office said the requests “did not provide sufficient information to warrant an investigation.” Ms. Freeland’s leadership position with the WEF has been declared to the office and has therefore been cleared.

Featured image: Original paintings by R. Delaney.

Arab Public Opinion Poll About Israeli War On Gaza

Doha, January 2024 // The Arab Center for Research and Policy Studies announced the results of their public opinion poll regarding the Israeli war on Gaza on Wednesday 10 January 2024. The poll was carried out on a sample of 8000 respondents (men and women) from 16 Arab countries. The survey questions were selected to determine the opinions of citizens in the Arab region on important topics related to the Israeli war on Gaza.

The results of the survey demonstrate the locality of the war as felt by Arab public opinion, with 97% of respondents expressing psychological stress (to varying degrees) as a result of the war on Gaza. 84% expressed a sense of great psychological stress.

Extent of psychological stress felt during the war on Gaza

About 80% of respondents reported that they regularly follow news of the war, compared to 7% who said that they do not follow it, a further indication that the Arab public sees this war as a local event. To access the news 54% of respondents relied on television, compared to 43% who relied on the internet.

Extent of news followship about Israel’s war on Gaza

It is noteworthy that the results highlighted that Arab public opinion does not believe that the military operation carried out by Hamas on 7 October 2023 was in pursuit of a foreign agenda. 35% of respondents considered that the most important reason for the operation was the continued Israeli occupation of the Palestinian territories, while 24% attributed it mostly to defence against Israel’s targeting of Al-Aqsa Mosque, and 8% saw it as a result of the ongoing siege of the Gaza Strip.

The most important motivations for Hamas to carry out the military operation on 7 October 2023

 Most importantSecond most important
The ongoing Israeli occupation of Palestinian land3513
Defending al-Aqsa Mosque against attacks2421
The ongoing blockade of Gaza812
Ongoing and expanding settlement on Palestinian land68
Liberating Palestinian detainees and prisoners in Israeli prisons613
Israel’s rejection of the establishment of a Palestinian state45
The United States’ failure to achieve a just peace23
The international community’s disregard for Palestinian rights and the ongoing occupation45
Halting the normalization process between Arab governments and Israel23
Carrying out the plan or agenda of a foreign power such as Iran22
Other21
Don’t know / Declined to answer50
No second option014
Total100100

While 67% of respondents reported that the military operation carried out by Hamas was a legitimate resistance operation, 19% reported that it was a somewhat flawed but legitimate resistance operation, and 3% said that it was a legitimate resistance operation that involved heinous or criminal acts, while 5% said it was an illegitimate operation.

Assessments of Hamas’ military operation on 7 October 2023

The results showed that there is an Arab consensus of 92% expressing solidarity with the citizens of the Arab region with the Palestinian people in Gaza. While 69% of respondents expressed their solidarity with Palestinians and support for Hamas, 23% expressed solidarity with Palestinians despite opposing Hamas, and 1% expressed a lack of solidarity with the Palestinians.

Solidarity with Palestinians and support for Hamas

The majority of respondents rejected comparisons between Hamas and ISIS made by predominately Israeli and Western politicians and media personalities.

Comparisons between Hamas and ISIS

When asked about the responses of regional and international powers to Israel’s war on Gaza, 94% considered the US position negatively, with 82% considering it very bad. In the same context, 79%, 78%, and 75% of respondents viewed positions of France, the UK, and Germany negatively. Opinion was split over the positions of Iran, Turkey, Russia, and China. While (48%, 47%, 41%, 40%, respectively) considered them positively (37%, 40%, 42%, 38%, respectively).

Evaluation of international and regional positions

In the same context, 76% of respondents reported that their position toward the United States following the Israeli war on Gaza had become more negative, indicating that the Arab public has lost confidence in the US. Furthermore, respondents demonstrated a near consensus (81%) in their belief that the US government is not serious about working to establish a Palestinian state in the 1967 occupied territories (The West Bank, Jerusalem, and Gaza).

About 77% of respondents named the United States and Israel as the biggest threat to the security and stability of the region. While 51% saw the United States as the most threatening, 26% considered the biggest threat to be Israel. While 82% of respondents reported that US media coverage of the war was biased towards Israel, only 7% saw it as neutral.

How opinion on US policy in the Arab region has changed since the war on Gaza

Evaluation of US seriousness in establishing a Palestinian state in the 1967 Occupied Palestinian lands

Biggest threats to the peace and stability of the region

 Greatest ThreatSecond Greatest Threat
Gaza war202220202018Gaza War202220202018
United States5139444325252328
Israel2641373733283840
Iran77101310131915
Russia46238847
France222110531
Turkey22213252
China12102220
Other12
Don’t know / Declined to answer61220
No second option071767
Aggregate100100100100100100100100

Evaluation of US media coverage of the war on Gaza

Arab public opinion sees the Palestinian Cause as an Arab issue, and not exclusively a Palestinian issue. A consensus of 92% believe that the Palestinian question concerns all Arabs and not just the Palestinians. On the other hand, 6% said that it concerns the Palestinians alone and they alone must work to solve it. It is worth noting that this percentage is the highest recorded since polling began in 2011, rising from 76% at the end of 2022, to 92% this year. Some countries recorded significant increases. In Morocco, it rose from 59% in 2022 to 95%, in Egypt from 75% to 94%, in Sudan from 68% to 91%, and in Saudi Arabia from 69% to 95%, a statistically significant increase that represents a fundamental shift in the opinions of the citizens of these countries.

Consideration of the Palestinian Cause as an Arab issue over time

Arab public opinion is almost unanimous in rejecting recognition of Israel, at a rate of 89%, up from 84% in 2022, compared to only 4% who support its recognition. Of particular note is the increase in the percentage of those who rejected recognition of Israel in Saudi Arabia from 38% in the 2022 poll to 68% in this survey. Such a statistically significant increase also applies to other countries such as Morocco, where the percentage rose from 67% to 78%, and Sudan, where it increased from 72% to 81%.

Support/opposition for recognizing Israel over time

When asked about their opinions on what measures Arab governments should take in order to stop the war in Gaza, 36% of respondents stated that Arab governments should suspend all relations or normalization processes with Israel, while 14% of them stated that aid and support should be brought into Gaza without Israeli approval, and 11% said that the Arab governments should use oil as a weapon to assert pressure on Israel and its supporters.

Measures that should be taken by Arab governments to stop the war on Gaza

 Most important measureSecond most important measure
Suspend relations or normalization with Israel3615
Deliver aid to Gaza without Israeli approval1416
Use the oil weapon to pressure Israel and its supporters1113
Establish a global alliance to boycott Israel911
Provide military aid to Gaza810
Announce military mobilization56
Reconsider relations with the United States46
Reconsider relations with states that support Israel’s war on Gaza35
Build alliances with states that have taken practical steps against Israel34
Other32
Don’t know / Declined to answer40
No second option012
Total100100

There is a near consensus among Palestinian respondents from the West Bank (including Jerusalem), around 95%, that safety and freedom of movement between the governorates and cities of the West Bank and their sense of security and personal safety have been affected negatively since 7 October 2023.

Negative effects experienced in the West Bank since 7 October 2023

A further 60% of Palestinian respondents in the West Bank said that they had been subjected to or were witnesses to raids by the occupation army forces, while 44% said that they were subjected to arrest or interrogation by the Israeli army, and 22% reported that they were subjected to harassment by settlers.

Frequency of witnessing or happening upon incidences of raids, arrests, or settler harassment in the West Bank since 7 October 2023

This survey is the first of its kind to gauge public opinion on the topic across the Arab region. The field work was conducted from 12 December 2023 to 5 January 2024 in Mauritania, Morocco, Algeria, Tunisia, Libya, Egypt, Sudan, Yemen, Oman, Qatar, Kuwait, Saudi Arabia, Iraq, Jordan, Lebanon, and the West Bank, Palestine (including Jerusalem). The surveyed communities represent 95% of the population of the Arab region and its far-flung regions. The sample in each of the aforementioned communities was 500 men and women, drawn according to cluster and self-weighted sampling methods to ensure that every individual in each country had an equal probability of appearing in the sample.

For the Silo, Dr Ahmed Hussein, researcher at the Arab Center for Research and Policy Studies.

Disinformation Tops Global Risks 2024 

  • Misinformation and disinformation are biggest short-term risks, while extreme weather and critical change to Earth systems are greatest long-term concern, according to Global Risks Report 2024.
  • Two-thirds of global experts anticipate a multipolar or fragmented order to take shape over the next decade.
  • Report warns that cooperation on urgent global issues could be in short supply, requiring new approaches and solutions.
  • Read the Global Risks Report 2024 here, discover the Global Risks Initiative, watch the press conference here, and join the conversation using #risks24.

Geneva, Switzerland, January 2024 – Drawing on nearly two decades of original risks perception data, the World Economic Forum’s Global Risks Report 2024 warns of a global risks landscape in which progress in human development is being chipped away slowly, leaving states and individuals vulnerable to new and resurgent risks. Against a backdrop of systemic shifts in global power dynamics, climate, technology and demographics, global risks are stretching the world’s adaptative capacity to its limit.

These are the findings of the Global Risks Report 2024, released today, which argues that cooperation on urgent global issues could be in increasingly short supply, requiring new approaches to addressing risks. Two-thirds of global experts anticipate a multipolar or fragmented order to take shape over the next decade, in which middle and great powers contest and set – but also enforce – new rules and norms.

The report, produced in partnership with Zurich Insurance Group and Marsh McLennan, draws on the views of over 1,400 global risks experts, policy-makers and industry leaders surveyed in September 2023. Results highlight a predominantly negative outlook for the world in the short term that is expected to worsen over the long term. While 30% of global experts expect an elevated chance of global catastrophes in the next two years, nearly two thirds expect this in the next 10 years.

“An unstable global order characterized by polarizing narratives and insecurity, the worsening impacts of extreme weather and economic uncertainty are causing accelerating risks – including misinformation and disinformation – to propagate,” said Saadia Zahidi, Managing Director, World Economic Forum. “World leaders must come together to address short-term crises as well as lay the groundwork for a more resilient, sustainable, inclusive future.” 

Rise of disinformation and conflict

Concerns over a persistent cost-of-living crisis and the intertwined risks of AI-driven misinformation and disinformation, and societal polarization dominated the risks outlook for 2024. The nexus between falsified information and societal unrest will take centre stage amid elections in several major economies that are set to take place in the next two years. Interstate armed conflict is a top five concern over the next two years. With several live conflicts under way, underlying geopolitical tensions and corroding societal resilience risk are creating conflict contagion.

Economic uncertainty and development in decline
The coming years will be marked by persistent economic uncertainty and growing economic and technological divides. Lack of economic opportunity is ranked sixth in the next two years. Over the longer term, barriers to economic mobility could build, locking out large segments of the population from economic opportunities. Conflict-prone or climate-vulnerable countries may increasingly be isolated from investment, technologies and related job creation. In the absence of pathways to safe and secure livelihoods, individuals may be more prone to crime, militarization or radicalization.

Planet in peril


Environmental risks continue to dominate the risks landscape over all timeframes. Two-thirds of global experts are worried about extreme weather events in 2024. Extreme weather, critical change to Earth systems, biodiversity loss and ecosystem collapse, natural resource shortages and pollution represent five of the top 10 most severe risks perceived to be faced over the next decade. However, expert respondents disagreed on the urgency of risks posed – private sector respondents believe that most environmental risks will materialize over a longer timeframe than civil society or government, pointing to the growing risk of getting past a point of no return.

Responding to risks


The report calls on leaders to rethink action to address global risks. The report recommends focusing global cooperation on rapidly building guardrails for the most disruptive emerging risks, such as agreements addressing the integration of AI in conflict decision-making. However, the report also explores other types of action that need not be exclusively dependent on cross-border cooperation, such as shoring up individual and state resilience through digital literacy campaigns on misinformation and disinformation, or fostering greater research and development on climate modelling and technologies with the potential to speed up the energy transition, with both public and private sectors playing a role.

Carolina Klint, Chief Commercial Officer, Europe, Marsh McLennan, said: “Artificial intelligence breakthroughs will radically disrupt the risk outlook for organizations with many struggling to react to threats arising from misinformation, disintermediation and strategic miscalculation. At the same time, companies are having to negotiate supply chains made more complex by geopolitics and climate change and cyber threats from a growing number of malicious actors. It will take a relentless focus to build resilience at organizational, country and international levels – and greater cooperation between the public and private sectors – to navigate this rapidly evolving risk landscape.”

John Scott, Head of Sustainability Risk, Zurich Insurance Group, said: “The world is undergoing significant structural transformations with AI, climate change, geopolitical shifts and demographic transitions. Ninety-one per cent of risk experts surveyed express pessimism over the 10-year horizon. Known risks are intensifying and new risks are emerging – but they also provide opportunities. Collective and coordinated cross-border actions play their part, but localized strategies are critical for reducing the impact of global risks. The individual actions of citizens, countries and companies can move the needle on global risk reduction, contributing to a brighter, safer world.”

About the Global Risks Initiative


The Global Risks Report is a key pillar of the Forum’s Global Risks Initiative, which works to raise awareness and build consensus on the risks the world faces, to enable learning on risk preparedness and resilience. The Global Risks Consortium, a group of business, government and academic leaders, plays a critical role in translating risk foresight into ideas for proactive action and supporting leaders with the knowledge and tools to navigate emerging crises and shape a more stable, resilient world.

RICO EXPERT COMMENTS ON TRUMP’S RECUSAL BID 

Los Angeles, CA … Lawyers for Donald Trump on Monday asked the federal judge presiding over his election subversion case in Washington to recuse herself, saying her past public statements about the former president and his connection to the January 6, 2021, riot at the U.S. Capitol call into question whether she can be fair. 

“Regardless of anyone’s personal opinion on the matter, Donald Trump’s motion for recusal has merit under the express provisions of 28 U.S.C. § 455, which requires a judge to recuse himself or herself in any proceeding in which [her] impartiality might reasonably be questioned. It is irrelevant whether the judge is actually biased. The U.S. Supreme Court squarely addressed this issue in Liljeberg v. Health Services Acquisition Corp., 486 U.S. 847, 860, which held that recusal is required even when a judge lacks actual knowledge of the facts indicating his interest or bias.

Judge Chutkan

Here, Judge Tanya Chutkan has made previous comments such as ‘Presidents are not kings, and Plaintiff is not a President’ and, in a December 2021 sentencing hearing, she stated, ‘the issue of who has or has not been charged is not before me. I don’t have any influence on that. I have my opinions, but they are not relevant.’ She has therefore publicly acknowledged her bias, which, at the very least, creates an appearance of partiality. This is nevertheless an uphill battle, as the motion has been submitted to Judge Chutkan, who will rule on this motion.

Having litigated this issue extensively in Angelica Limcaco v. Steve Wynn, Case No. 19-15949 (9th Cir. 2020), Donald Trump has to navigate a difficult path because the optics are problematic for him. The Justice Department will likely argue that Judge Chutkan has no financial interest, or something to that effect. Of course, if the motion is denied, the decision could result in an interlocutory appeal that may delay the case,” explained Jordan Matthews, a litigation partner at Weinberg Gonser LLP.

Burkina Faso is the world’s most neglected crisis

For the first time, Burkina Faso tops the list of the world’s most neglected displacement crises, according to a new report from the Norwegian Refugee Council (NRC). Redirection of aid and attention towards Ukraine has increased neglect of some of the world’s most vulnerable people.  

The annual list of neglected displacement crises is based on three criteria: lack of humanitarian funding, lack of media attention, and a lack of international political and diplomatic initiatives. The crisis in the Democratic Republic of Congo ranks second, having appeared first or second on the list every year since its inception seven years ago. Colombia, Sudan, and Venezuela follow in this grim ranking. 

“Tell the world we have suffered. We have suffered a lot. Our neighbours have suffered. Our friends have suffered. Our relatives have suffered. We lost many. Most of them killed. I am thanking God because none of my family was left there, and we are all in safety. I do not want to return, but I am asking God for peace, for peace in this place,” says Halimata (35). Together with her family, she fled fighting in the east of Burkina Faso and sought safety in Kaya.

“Neglect is a choice – that millions of displaced people are cast aside year after year without the support and resources they so desperately need is not inevitable,” said Jan Egeland, NRC’s Secretary General. 

“The powerful response to the suffering inflicted by the war in Ukraine demonstrated what the world can deliver for people in need. Political action for Ukrainians has been impactful and swift, borders kept open, funding plenty, and media coverage extensive. Those in power need to show the same humanity towards people affected by crises in places such as Burkina Faso and the Democratic Republic of the Congo.” 

More than five times more articles were written about the Ukrainian displacement crisis last year than about all the world’s ten most neglected crises in total. For every dollar raised per person in need in Ukraine in 2022, just 25 cents were raised per person in need across the world’s ten most neglected crises.  

The Democratic Republic of Congo continued to make the list this year. Patient* 43, lives with his 6 children in the town of Bule, Djugu Territory, Ituri Province, DR Congo. ‘We fled in February 2021. We’ve moved around a lot, and now we are trying to build a new home. During the war, we’ve never had enough to eat, and we have no money to buy medicines if the children get sick. We used to live in a beautiful village, and had a big house. Now, all we have is this shelter. When it rains a lot, the water will come through the roof’. *Name changed for security reasons.

The repeated warnings of increased disparity due to the reallocation of resources to the Ukraine response have now become reality. The redirection of a large amount of aid money towards Ukraine and towards hosting refugees in donor countries means that many crises have seen a drop in assistance, despite growing needs. Total aid to Africa, where we find seven out of the ten most neglected crises, was 34 billion USD in 2022, representing a drop of 7.4 per cent compared to 2021.  

The Ukraine crisis also contributed to an increase in food insecurity in many of the countries featured in the report, worsening already dire crises, and increasing the number of people in need. 

“The world has failed to support the most vulnerable, but this can be reversed. The lives of millions of people suffering in silence can improve, if funding and resources are allocated based on need, not geopolitical interest, and media headlines of the day,” said Egeland. “Last year the gap between what was needed and what was delivered in humanitarian assistance was 22 billion USD. This is a huge sum of money, but no more than Europeans spend on ice cream a year. We need donors to increase support and new donor countries to step up to share responsibility.” 

Burkina Faso’s decline since the crisis broke out five years ago has been swift and devastating. More than 2 million people have been forced to flee their homes, and nearly a quarter of the population now requires humanitarian aid. Across the country, 800,000 people are living in areas under blockade by armed groups where they have no access to even basic services. The situation is increasingly dire with some people forced to eat leaves to survive. 

Maïga Abibou is an Internally Displaced Person (IDP) from Wapassi in the North region of Burkina Faso. Because of rampant insecurity in Wapassi, she made her first move with her family to Naoubé, a village in the Center North. A few months later, she fled again with her family to Louda, a village located a few kilometers from Kaya. There, she has been living with dozens of other families out in the open for over a month while hoping to get shelters soon before the rainy season begins in Burkina Faso. “We want the world to know about our difficulties, about what is worrying us now. We fled from far away to come here. This is our second escape. We could not bring anything with us. We moved with our carts; we were in the bush and there were no vehicles,” Abibou said.

“We must do more to end the suffering in Burkina Faso before despair becomes entrenched and it is added to the growing list of protracted crises. That this crisis is already so deeply neglected shows a failure of the international system to react to newly emerging crises, as it also fails those lost in the shadows for decades. Ultimately, greater investment in diplomatic solutions is needed if we hope to pull crises off this list,” said Egeland.  For the Silo, Jessica Wanless. Featured image: FILE – Children wait for their turn to buy water from a privately-owned water tower, amid an outbreak of the coronavirus disease, in Taabtenga district of Ouagadougou, Burkina Faso, April 3, 2020.

Facts and figures:   

  • Each year, the Norwegian Refugee Council (NRC) publishes a list of the ten most neglected displacement crises in the world. The purpose is to focus on the plight of people whose suffering rarely makes international headlines, who receive no or inadequate assistance, and who never become the centre of attention for international diplomacy efforts. The report is available here
  • The neglected displacement crises list for 2022 analyses 39 displacement crises based on three criteria: lack of funding, lack of media attention, and lack of international political and diplomatic initiatives. Full details on the methodology can be found in the report. 
  • The full list in order this year is: Burkina Faso, DR Congo, Colombia, Sudan, Venezuela, Burundi, Cameroon, Mali, El Salvador, Ethiopia. 
  • Burkina Faso has appeared on this list for the previous four years. It ranked second on last year’s report, seventh in 2020, and third in 2019.  
  • DR Congo is a textbook example of a neglected crisis. It has topped the list three times (2021, 2020 and 2017). It previously ranked second on the list in 2019, 2018 and 2016. 
  • Colombia and El Salvador appear in this report for the first time this year. 
  • The total funding to the Burkina Faso humanitarian response plan was 339 million USD in 2022, of the 805 million USD requested – making the response just 42 per cent funded (OCHA). 
  • In 2022, 3.5 million people were in need of humanitarian assistance in Burkina Faso – by the end of the year this has skyrocketed to 4.9 million people. This is a 40% increase and nearly equal to 1 in 4 Burkinabè (OCHA). 
  • There are almost 2 million internally displaced people in Burkina Faso (IDMC). 
  • 800,000 people are living in 23 blockaded towns and cities in Burkina Faso, unable to access aid regularly. Half of them are in the city of Djibo (Access Working Group). 
  • The average humanitarian appeal was just over half funded in 2022, while the Ukraine appeal was almost 90% funded (OCHA).  
  • The gap between the total humanitarian appeals by the UN and partners and the money actually received amounted to 22 billion USD in 2022 (OCHA). 
  • Total aid to Africa was USD 34 billion in 2022 (overseas development assistance, including development aid and humanitarian), representing a drop of 7.4% compared to 2021 (OECD).  
  • Collectively the world’s most powerful donor countries used more of their aid on the reception of refugees at home than on overseas humanitarian assistance in 2022 (OECD).  
  • The European Ice Cream Market was estimated to be valued at $21.7 Billion in 2021 (Research and Markets). 
  • 212 USD was raised per person in need inside Ukraine, while 52 USD was raised per person in need across the world’s ten most neglected crises in 2022 (OCHA). 
  • In total, 375,000 articles were written in the English media about the world’s ten most neglected displacement crises last year, according to statistics from Meltwater. In comparison, 1.98 million articles were written in English about the displacement crises in Ukraine during the same period (Meltwater).  

USA, Germany Ratings Weaker As Russia Suffers Global Rebuke

U.S. leadership ratings retreated after the U.S. withdrew from Afghanistan, with most of the world disapproving of Russia’s leadership after its invasion of Ukraine 

Washington, D.C. — A new Gallup report based on interviews in 137 countries in 2022 shows the honeymoon is over for U.S. President Joe Biden, and Germany’s image has lost some of its clout under new Chancellor Olaf Scholz. Though global approval ratings of the U.S. and Germany dipped in 2022, both countries are still in much stronger positions than Russia — which saw its ratings plunge after its invasion of Ukraine — and China.

German Chancellor Olaf Scholz (L) with Canada Prime Minister Justin Trudeau (R)

Here are some of the key findings from Gallup’s Rating World Leaders 2023 report:

  • U.S. leadership ratings around the world rebounded in 2021 in the first year of Biden’s presidency but declined in his second.
  • Ratings for the U.S. first slipped after withdrawal from Afghanistan in August 2021.
  • There were double-digit decreases in U.S. leadership approval in 36 countries between 2021 and 2022 — mostly in Europe and the Americas.
  • Russia’s approval ratings plunged worldwide after the invasion of Ukraine, and the majority of adults around the world now disapprove of Russia’s leadership.
  • Majorities in 81 of the 137 countries surveyed disapproved of Russian leadership.

A look back to last year’s rankings and previous years.

Implications Beyond 2023:

One of the biggest foreign policy challenges facing the U.S. and its allies in 2023 and beyond will be to ensure the transatlantic unity that was so greatly tested in 2022 does not fracture as Russia’s war against Ukraine continues.

The images of the U.S. and Germany are in slightly weaker positions than before the war started, but they are still in much stronger positions than Russia. But perhaps more importantly, the soaring disapproval of Russia’s leadership in all parts of the world shows they are not the only countries that care.

MPP Brady Intros Farmland Protection Legislation

QUEEN’S PARK – Haldimand-Norfolk MPP Bobbi Ann Brady has introduced legislation that, if passed, will protect Ontario’s farmland.

“Land use planning affects our daily lives and Ontario’s farmland and arable land is an essential resource for the sustainability and security of our food systems, environment and local economies,” Brady said. “Farmland and arable land is productive, valuable and essential but most importantly it is finite and non-renewable, which is vital to consider in the face of increasing pressure to develop housing in the province.”

With Ontario having 52 per cent of the country’s prime arable land, and much of that being adjacent to cities, Brady said protecting these lands should be paramount. Further, according to census data, Ontario is losing 319 acres of farmland each day. Brady feels this is unsustainable. Constituents in Haldimand-Norfolk have also raised this same concern with the MPP since well before her election.

“As the government continues with its target to create 1.5 million new homes in Ontario, it is vital to put in place policies that will protect our farmers and their land, as well as the province’s food security, both now and in the future,” she said.

The bill requires the Minister of Agriculture, Food and Rural Affairs to develop a strategic action plan that aims to protect Ontario’s farmland and arable land from development, aggregate mining and the effects of fluctuating commodity prices and the availability of vacant land. It also stipulates a stakeholder-led Farmland and Arable Land Advisory Committee be set up to advise the Minister of Agriculture, Food and Rural Affairs. For the Silo, Jeff Helsdon.

The bill will be back before the Legislature for second reading debate on March 8.

For more information, contact MPP Bobbi Ann Brady directly at 519-428-0446 or 905-765-8413 or babrady-co@ola.org Please mention The Silo when contacting.

How to Engage In Or Avoid A Political Conversation

So how do you respond when someone brings you into the conversation?  How do you answer when they ask you for your opinion or who you’re going to vote for?

You could always just doodle on a receipt like this one from J. Barker :)
You could always just doodle on a receipt like this one from J. Barker 🙂

Sharon Schweitzer, an international etiquette expert, author and founder of Protocol & Etiquette Worldwide, says you have options.

Has politics become a reality TV show? Tonight's debate is being called the "Lisa Simpson versus Bart Simpson" debate.
Has politics become a reality TV show? 

  1. You don’t want to respond

Keeping your opinion to yourself can be difficult; however, it is possible. Say something like, “In the midst of such a contentious political season, I feel it’s best to keep my opinion to myself. I do appreciate your interest and wish you the best in your political decisions.”

By acknowledging and thanking them for their genuine interest, you are able to get out of sticky political conversations but retain your well-mannered and ever sophisticated demeanor.

  1. If they push again

If they keep pushing for a response, you can play the undecided card and change the subject.

“I’m still evaluating the candidates and the issues and haven’t made up my mind yet.  It will be interesting to see how it plays out.”

To get them off the topic for good, ask them about something meaningful to them that they will want to talk about.  “I hear your son got accepted to Ohio State. Congratulations!”  “Great job on closing that account.  How did you do it?”  “Tell me about your trip to the mountains a few weeks ago. I hear it is beautiful this time of year.”

  1. You want to respond

If you would like to express your beliefs, the best way to do so is to cite research and concrete reasons why your views align a certain way, as this will encourage more of an intellectual conversation than a possible war of opinions.  Just as you want to express your beliefs, be courteous and let the person you are speaking to express his or her beliefs, even if you disagree.

  1. If you disagree

It’s inevitable that disagreements will arise, but when they do, handle them with grace, dignity and respect. Say something like, “That’s an interesting way to look at it and you bring up some valid points; however, I feel that…” Never raise your voice, show anger, abruptly walk away or make it personal.

  1. Either way

Whether you decide to respond or not, be tactful, polite, and remember that educated responses will help you either to cordially engage, or graciously decline whenever these inevitable conversations cross your path. For the Silo, Alex Smith.

Indy MPP Brady Frustrated With Both Parties Re Bill 28

Brady stands up for educational workers and students

QUEEN’S PARK –   Haldimand-Norfolk MPP Bobbi Ann Brady over the past two days, stood in the House and implored the government and CUPE to tone down the rhetoric, work together through negotiations, and stop using education workers and students as political pawns.

“To this government, to CUPE, stop using some of the province’s lowest paid education workers and stop using our kids as political pawns,” MPP Brady stated in the Legislature.

The government declared Bill 28 to operate the notwithstanding clause during the dispute involving school board employees represented by the Canadian Union of Public Employees.  The notwithstanding clause blocks the ability of the union employees to walk off the job and keep students from class.

As an Independent member of the Legislature, MPP Brady has the unique position of viewing legislation genuinely and providing honest feedback about how it will affect her constituents as well the rest of the province.   

Through her question and statement on Tuesday and Wednesday respectively, Brady expressed her frustration with both sides of the House. She then questioned which side actually cares about education workers and students. 

“I’m a bit cranky with what is happening here.  Who here actually cares about our education workers? Who cares about our students?”

Brady is fearful that if the lives of students are impacted, education workers will be blamed by Ontario parents who are frustrated with kids being in and out of school the past few years. 

https://bobbiannbrady.com/

In a line of questioning yesterday, MPP Brady encouraged the government to do treat educational workers fairly and do what is right for Ontario students.

For more information, contact MPP Bobbi Ann Brady at babrady-co@ola.org or 519-428-0446 Please mention The Silo when contacting.

Handling of Trump Mar-a-Lago Raid Breeding Distrust in Law Enforcement: Expert

Unless trust is restored, the FBI’s Mar-a-Lago raid may begin the “collapse” of U.S. law enforcement, according to police expert Michael Letts.

Over the past few years, the FBI has acted politically often enough that many Americans now struggle to trust it, Letts said. He runs In-Vest USA, a nonprofit that provides bulletproof vests to police departments.

Without explanations, acts such as the Mar-a-Lago raid create distrust between local and federal law enforcement, he said. They also create civilian distrust for law enforcement in general.

“Mar-a-Lago is just another nail in the coffin,” he said.

U.S. law enforcement runs on trust, according to Letts. Without trust, the system collapses into “Third-World status,” where police serve power instead of enforcing the law.

“Then, you have coup d’états, you have overthrows, riots. And then, whatever power happens to win at that particular day tries to solidify. The forces that it controls run out and eliminate everybody that’s not on their bandwagon,” he said.

Lack of Transparency in Politically Sensitive Case

The FBI made several decisions at Mar-a-Lago that could catastrophically damage trust in law enforcement, Letts said.

First, the raid itself shouldn’t have happened, he said.

Presidents often take many documents with them when they leave the White House. Often, staff accidentally pack at least a few secret documents by mistake. Most of the time, the federal government doesn’t punish this mistake, according to Letts.

Trump’s predecessor, former President Barack Obama, turned over 30 million documents to the National Archives.

“More often than not, they look at and realize [the document] no longer needs to be classified anymore,” he said.

But the FBI raided Trump’s home for the documents.

The FBI also refused to let Trump’s lawyer observe the search. Without someone else present, law enforcement could potentially plant fake evidence or steal a suspect’s property, Letts said. This has led many to now wonder whether the FBI demanded secrecy for alleged misconduct.

“They should have never provided fodder to the American people to have these kinds of questions,” he said.

Finally, FBI and DOJ leaders have failed to provide the public with a clear explanation as to why the raid had to happen.

Epoch Times Photo
In-Vest USA CEO Michael Letts. (Image courtesy of In-Vest USA)

Although the government released the warrant and receipt for property taken, these things didn’t provide enough of an answer, Letts said.

Since then, reports have been spreading about an internal FBI and Department of Homeland Security bulletin, leaked in part by CNN, NBC, and CBS, of an increase in bomb threats made online to law enforcement and officials following the Mar-a-Lago raid.

If the government truly wants to calm the situation, it needs to provide a full explanation, according to Letts.

“We need straight and direct answers,” he said. “We need congressional leadership. It needs to be a bipartisan effort.”

Trust: Cornerstone of the American System

The distrust from the FBI raid doesn’t only affect politics, Letts said. It also affects the inner workings of law enforcement.

Law enforcement agencies have to cooperate to do their work, he said. Federal and state police often join forces for investigations.

In these investigations, trust is crucial, according to Letts. If the FBI and local police don’t trust each other, they can’t cooperate.

Even law enforcement on drug dealing will fall apart if the FBI and police don’t trust each other, he said. If the FBI targets conservative politicians today, it might target anyone tomorrow.

“Is there something else behind the scenes? You’re willing to lie on FISA reports to courts. Are you willing to lie about this?” he asked.

The FBI’s Mar-a-Lago raid will also cause the public to distrust state and local police, as most of the time, the public doesn’t see the difference between local police, state police, and federal law enforcement, according to Letts.

“If anybody’s wearing a badge—sheriff, deputy, city police—they all get mixed into the same boat,” he said. “And now they all get vilified.”

In the past few years, law enforcement’s trust foundations have been weakened from a number of events, Letts said. Some media outlets have villainized them for alleged racism, which the police deny, during deaths in custody, while some city councils have cut their budgets. Officers faced immense pressure from all angles during the COVID-19 pandemic. Many police officers have resigned; few are recruited.

“They’re having to pull extra shifts. They’re at the highest stress rates. I mean, look at their divorce rates. They have some of the lowest morale we’ve ever seen in history,” he said of the police.

At some point, the “thin blue line” will snap, according to Letts.

“Who will they call when somebody is banging on their door to try to break in?” he asked.

We hope you enjoy our coverage! As you are visiting us today, we’d like to ask you one question —  How much do you think news media outlets actually impact your life? …Probably more than you realize. For the Silo/Epoch Times, Jackson Elliott.

Featured image: Protesters gather in front of the Federal Building in Los Angeles on Aug. 13, 2022, to voice anger over FBI’s Mar-a-Lago raid. (Linda Jiang/The Epoch Times)

Report: Regulations on U.S. arms exports often skirted, rarely enforced

SOMERVILLE, Mass.—While the United States likes to claim it has the gold standard of arms export control measures, in practice the measures offer few restrictions on U.S. presidents’ ability to ship arms wherever they like, according to a new report from the World Peace Foundation (WPF) at Tufts University’s The Fletcher School of Law and Diplomacy.

The Arms Export Control Act (AECE) of 1976, as well as the United States’ international obligations, are meant to ensure decisions to export arms take into account the potential to escalate conflict or fall into the hands of U.S. enemies. The AECA sets up Congress as a check on presidential decisions.

“The potential for arms sales to exacerbate a conflict rarely stops a sale,” said report author Jennifer Erickson, associate professor of political science and international studies at Boston College. “When we do restrain exports, more often than not, political calculations are at work, rather than the legal checks and balances Congress put in place.”

Among the key findings of On the Front Lines: Conflict Zones and U.S. Arms Exports:

  • Conflict is not a consistent deterrent for U.S. arms exports. The United States usually prioritizes diplomatic and economic ties in export decision making—regardless of the conflict status of the recipient.
  • Presidents face few restrictions on using arms sales to meet policy goals. U.S. law sets an almost unreachable vote threshold for Congress to block or modify arms sales.
  • Even when the U.S. chooses not to supply weapons to conflict zones, it can and does use alternative means, such as common allies, to get arms to combatants.
  • There is no realistic way for the U.S. government to guarantee the weapons it sells are used only by the buyer, in ways that conform with U.S. interests. We cannot ensure weapons are only used defensively, for instance. And arms have staying power. Years after initial sales, they may be used instead for priorities the U.S. opposes.
  • Interpretation of regulations may become looser still as the U.S. enters a “New Cold War” with China or Russia.

In coming to these conclusions, the report examines U.S. arms sales, and restraint, connected to recent conflicts in Libya, Nigeria, South Sudan, Syria and Yemen. The World Peace Foundation commissioned similar studies on arms sales by the governments of the United Kingdom and France.

These studies follow earlier research by the WPF on which nations send arms into conflict zones, available on the website, Who Arms War? 

“The United States has all the regulations and policy tools it needs to ensure we do not make already dangerous places even more deadly,” said Alex de Waal, World Peace Foundation executive director and research professor at The Fletcher School. “We have mechanisms that can minimize the risk of America arming deadly actors. What we don’t seem to have is the political will to actually use those mechanisms. On numerous occasions American arms have made the world a more dangerous place, including for Americans.”

ABOUT THE WORLD PEACE FOUNDATION

Established by the publisher Edwin Ginn in 1910, the World Peace Foundation aims to “educate the people of all nations to a full knowledge of the waste and destructiveness of war and of preparation for war, its evil effects on present social conditions and on the wellbeing of future generations, and to promote international justice and the brotherhood of man, and generally by every practical means to promote peace and goodwill among all mankind.”

How Covid Affects Ontario Legislature

The past week has been a whirlwind of activity in Ontario politics.    Some have asked about my absence from the Legislature for the vote on May 31.    

With the advent of COVID-19, all political parties decided to divide the sitting members of the Legislature into two groups with equal representation from all parties. 

Separate groups in the Legislature are an attempt to diminish the spread of COVID-19.  

The Legislature is divided into two groups or cohorts in case COVID-19 swept through the sitting members, which could result in all members being in quarantine and the Legislature grinding to a halt. Instead, with two groups, only part of the Legislature would end up in quarantine and the other half could take over.   

My group was not designated to be in the Legislature May 31. For this reason, I was not present in the House. All parties agreed to not have remote voting in the Ontario Legislature. I am presently working from home, including serving virtually on Standing Committees.    

The motion passed on Monday relates to the ability to extend and amend existing orders under the Reopening Ontario Act. Orders made under the Act’s authority have always been, and will continue to be, required to be extended in 30-day increments by Cabinet. All orders may also be amended by Cabinet at any time to loosen or tighten restrictions as necessary. These Orders have been the mechanism that we use to implement the COVID-19 response since last July, including the colour-coded framework, the shutdown, and now the roadmap to reopening.   

Please note that the declaration of emergency and Stay-at-Home orders have expired as a result of key indicators for COVID-19 trending in the right direction and significant progress being made in vaccinations.   

However, because of the new, fast-growing Indian B.1.617.2 and to allow for higher vaccination rates, our government made the difficult decision to continue with remote learning for all elementary and secondary students across the province for the remainder of this school year. This will allow the province to continue its focus on accelerating COVID-19 vaccinations to support a safe summer and return to in-person learning in September for the 2021-22 school year.   

The health and safety of Ontario students, staff, educators and families remains a top priority.  

On a personal note, my wife Cari and I both contracted COVID-19 and have completely recovered.  Cari is home from Joseph Brant Hospital and is doing very well after a week-and-a-half there, including one week in Intensive Care. We have ended our self-isolation, although we continue to follow public health guidelines.     

We can’t begin to express our appreciation for all the messages of support and concern – thank you everyone!!    

My positive test for the N501Y mutation of the UK B.1.1.7 variant was a result of picking up the virus just prior to my vaccination.

The changing face of the pandemic: New COVID-19 variants spark concern

We must also be vigilant as the new B.1.617.2 variant, which was first identified in India and entered the province through Canada’s international borders, grew in Ontario by 600 per cent from May 12 to May 19.  

The threat of new variants reinforces my belief that we all must continue to be cautious because of this highly transmissible disease.    For the Silo, Toby Barrett MPP for Haldimand-Norfolk.   

Cons: Federal Libs C-10 Bill Has Massive Potential for Abuse of Power

Ottawa, ON – The Hon. Erin O’Toole, Leader of Canada’s Conservatives and the Leader of the Official Opposition, issued the following statement calling on Justin Trudeau to withdraw Bill C-10:
 
“In a democratic society, abuses of power and authority can and should be called out without fear of retribution. Social media has rapidly become the platform for this purpose, from cellphone videos of interactions with police to social media posts by survivors of sexual assault and harassment leading to the #MeToo movement.

“But in the midst of a pandemic, while Canadians are stuck at home and relying on social media for information, connectivity, and entertainment more than ever before, the Liberal government is quietly moving to radically change how Canadians use the internet.
 
“In a society that values freedom of speech and expression, Bill C-10 leaves the door open for a massive abuse of power on the rights of Canadians. 
 
“Canada’s Conservatives support creating a level playing field between large foreign streaming services and Canadian broadcasters, and championing Canadian arts and culture. A Conservative government would do so without compromising Canadians’ fundamental rights and freedoms.
 
“We are calling on Justin Trudeau to withdraw Bill C-10 today. If this is not done, a Conservative government will stand up for Canadians and repeal this deeply flawed legislation. While the NDP and the Bloc may look the other way on the freedom of expression, Canada’s Conservatives will not.” 
 
Le chef des conservateurs Erin O’Toole demande à Justin Trudeau d’annuler le projet de loi C-10 

 
Ottawa (Ontario) – L’honorable Erin O’Toole, chef des conservateurs du Canada et de l’Opposition officielle, a fait la présente déclaration demandant à Justin Trudeau d’annuler le projet de loi C-10 :
 
« Dans une société démocratique, les abus de pouvoir et d’autorité peuvent et doivent être dénoncés sans crainte ni représailles. Les médias sociaux sont rapidement devenus la principale plateforme à cet effet, qu’il s’agisse de vidéos d’interactions avec la police réalisées à l’aide de téléphones portables ou de messages publiés sur les médias sociaux par des victimes d’agressions et de harcèlement sexuels, qui ont donné naissance au mouvement #MeToo.
 
« Or, en pleine pandémie, alors que les Canadiens sont coincés chez eux et dépendent des médias sociaux pour obtenir de l’information, se connecter et se divertir, plus que jamais auparavant, le gouvernement libéral a discrètement tenté de changer radicalement comment les Canadiens peuvent utiliser les médias sociaux.
 
« Dans une société qui valorise la liberté de parole et d’expression, le projet de loi C-10 ouvre la porte à un abus de pouvoir et à une atteinte aux droits des Canadiens.
 
« Les conservateurs soutiennent des conditions égales entre les gros services de diffusion continue étrangers et les radiodiffuseurs canadiens, ainsi que la défense des arts et de la culture du Canada. Un gouvernement conservateur le ferait sans compromettre les droits fondamentaux et la liberté d’expression des Canadiens.

« Nous demandons à Justin Trudeau d’annuler le projet de loi C-10 aujourd’hui. Si cela n’est pas fait, un gouvernement conservateur défendra les intérêts des Canadiens et abrogera cette loi profondément défectueuse. Le NPD et le Bloc peuvent fermer les yeux sur la liberté d’expression, mais pas les conservateurs. » 
Copyright © 2021 Conservative Caucus
Our mailing address is:
Conservative CaucusBusiness131 Queen StOttawa, ON K1P 0A1Canada

Cost Of Marijuana In 120 Cities And How Much Tax Revenue If Legalized

First a few quick facts….

‏Tokyo, Japan has the most expensive cannabis‏ ‏, at 32.66 USD per gram. ‏

‏Quito, Ecuador has the least expensive marijuana‏ ‏, at 1.34 USD per gram.‏

‏Based on the average US marijuana tax rates currently implemented, ‏ ‏New York City could generate the highest potential tax revenue by legalizing weed‏ ‏, with 156.40 million USD per year. New York City also has the highest consumption rate of cannabis, at 77.44 metric tons per year.‏

‏Cannabis costs ‏ ‏$7.82 per gram in Toronto, Canada‏ ‏. ‏

‏Berlin, Germany – ‏ ‏Automatic cultivator device, ‏ ‏Seedo‏ ‏, after much research and data gathering, previously released the 2018 Cannabis Price Index, detailing the cost of marijuana in 120 global cities. Seedo is one of the many new ventures embracing the newly legalized cannabis industry. Their main goal is to allow both medicinal and recreational consumers to grow their own supply, avoiding extra taxes and bypassing harmful pesticides. The aim of this study is to illustrate the continuous need for legislative reform on cannabis use around the world, and to determine if there are any lessons to be learned from those cities at the forefront of marijuana legalisation.

‏Although Seedo’s technology enables smokers to get off the grid, this study considers one of the biggest byproducts of legalising cannabis—the potential tax revenue for the local government body. For this reason, Seedo decided not only to research the cost of cannabis around the world, but also to calculate how much potential tax a city could generate if they were to legalise marijuana. ‏

‏The study began first by selecting 120 cities across the world, including locations where cannabis is currently legal, illegal and partially legal, and where marijuana consumption data is available. Then, they looked into the price of weed per gram in each city. To calculate how much potential tax a city could make by legalising weed, Seedo investigated how much tax is paid on the most popular brand of cigarettes, as this offers the closest comparison. They then looked at what percentage marijuana is currently taxed in cities where it’s already legalised in the US. ‏

‏“This study has revealed some incredible insights into the kind of tax revenue that legalising weed could generate.” says Uri Zeevi, CMO at Seedo. “Take New York City for instance, which has the highest consumption level in the study at 77.44 metric tons of cannabis per year. If they taxed marijuana at the average US cannabis tax level, the city could make $‏ ‏156.4‏ ‏ million in potential tax revenue per year. This is equivalent to providing nearly 3 months worth of free school meals to every single public school kid in New York City.” ‏

‏The table below reveals a sample of the results for ‏ ‏Toronto, Canada‏ ‏:‏

‏City‏

‏Legality‏

‏Price per gram, US$‏

‏Total possible tax collection, if taxed at cigarette level, mil US$‏

‏Total possible tax collection, if taxed at average US marijuana taxes, mil US$‏

‏Total consumption in metric tons‏

‏Toronto‏

‏Partial‏

‏7.82‏

‏124.15‏

‏33.38‏

‏22.75‏

‏The table below shows the ‏ ‏top 10 most and least expensive cities for cannabis‏ ‏:‏

‏Top 10 Most Expensive Cities‏

‏Top 10 Least Expensive Cities‏

‏#‏

‏City‏

‏Country‏

‏Legality‏

‏Price per gram, US$‏

‏#‏

‏City‏

‏Country‏

‏Legality‏

‏Price per gram, US$‏

‏1‏

‏Tokyo‏

‏Japan‏

‏Illegal‏

‏32.66‏

‏1‏

‏Quito‏

‏Ecuador‏

‏Partial‏

‏1.34‏

‏2‏

‏Seoul‏

‏South Korea‏

‏Illegal‏

‏32.44‏

‏2‏

‏Bogota‏

‏Colombia‏

‏Partial‏

‏2.20‏

‏3‏

‏Kyoto‏

‏Japan‏

‏Illegal‏

‏29.65‏

‏3‏

‏Asuncion‏

‏Paraguay‏

‏Partial‏

‏2.22‏

‏4‏

‏Hong Kong‏

‏China‏

‏Illegal‏

‏27.48‏

‏4‏

‏Jakarta‏

‏Indonesia‏

‏Illegal‏

‏3.79‏

‏5‏

‏Bangkok‏

‏Thailand‏

‏Partial‏

‏24.81‏

‏5‏

‏Panama City‏

‏Panama‏

‏Illegal‏

‏3.85‏

‏6‏

‏Dublin‏

‏Ireland‏

‏Illegal‏

‏21.63‏

‏6‏

‏Johannesburg‏

‏South Africa‏

‏Illegal‏

‏4.01‏

‏7‏

‏Tallinn‏

‏Estonia‏

‏Partial‏

‏20.98‏

‏7‏

‏Montevideo‏

‏Uruguay‏

‏Legal‏

‏4.15‏

‏8‏

‏Shanghai‏

‏China‏

‏Illegal‏

‏20.82‏

‏8‏

‏Astana‏

‏Kazakhstan‏

‏Illegal‏

‏4.22‏

‏9‏

‏Beijing‏

‏China‏

‏Illegal‏

‏20.52‏

‏9‏

‏Antwerp‏

‏Belgium‏

‏Partial‏

‏4.29‏

‏10‏

‏Oslo‏

‏Norway‏

‏Partial‏

‏19.14‏

‏10‏

‏New Delhi‏

‏India‏

‏Partial‏

‏4.38‏

‏N.B. These tables are a sample of the full results. To find the complete results for all 120 cities, please see the bottom of the press release. ‏

‏The table below shows the ‏ ‏top 10 cities who could generate the most potential tax ‏ ‏by legalising cannabis, if taxed at the same rate as the most popular cigarette brand:‏

‏#‏

‏City‏

‏Country‏

‏Legality‏

‏Price per gram, US$‏

‏% of cigarette tax‏

‏Possible tax revenue, mil US$ ‏

‏1‏

‏Cairo‏

‏Egypt‏

‏Illegal‏

‏16.15‏

‏73.13‏

‏384.87‏

‏2‏

‏New York‏

‏USA‏

‏Partial‏

‏10.76‏

‏42.54‏

‏354.48‏

‏3‏

‏London‏

‏UK‏

‏Illegal‏

‏9.20‏

‏82.16‏

‏237.35‏

‏4‏

‏Sydney‏

‏Australia‏

‏Partial‏

‏10.79‏

‏56.76‏

‏138.36‏

‏5‏

‏Karachi‏

‏Pakistan‏

‏Illegal‏

‏5.32‏

‏60.7‏

‏135.48‏

‏6‏

‏Melbourne‏

‏Australia‏

‏Partial‏

‏10.84‏

‏56.76‏

‏132.75‏

‏7‏

‏Moscow‏

‏Russia‏

‏Partial‏

‏11.84‏

‏47.63‏

‏128.97‏

‏8‏

‏Toronto‏

‏Canada‏

‏Partial‏

‏7.82‏

‏69.8‏

‏124.15‏

‏9‏

‏Chicago‏

‏USA‏

‏Partial‏

‏11.46‏

‏42.54‏

‏119.61‏

‏10‏

‏Berlin‏

‏Germany‏

‏Partial‏

‏13.53‏

‏72.9‏

‏114.77‏

‏N.B. % of cigarette tax refers to the tax percentage on the most popular brand. Possible tax revenue refers to the total possible tax collection per year, if taxed at cigarette level. For a full explanation of how the study was conducted, please see the methodology at the bottom of the press release. ‏

‏The table below shows the ‏ ‏top 10 cities who could generate the most potential tax‏ ‏ by legalising cannabis, if taxed at the average US marijuana tax rate:‏

‏#‏

‏City‏

‏Country‏

‏Legality‏

‏Price per gram, US$‏

‏Possible tax revenue, mil US$‏

‏1‏

‏New York‏

‏USA‏

‏Partial‏

‏10.76‏

‏156.4‏

‏2‏

‏Cairo‏

‏Egypt‏

‏Illegal‏

‏16.15‏

‏98.78‏

‏3‏

‏London‏

‏UK‏

‏Illegal‏

‏9.20‏

‏54.22‏

‏4‏

‏Chicago‏

‏USA‏

‏Partial‏

‏11.46‏

‏52.77‏

‏5‏

‏Moscow‏

‏Russia‏

‏Partial‏

‏11.84‏

‏50.82‏

‏6‏

‏Sydney‏

‏Australia‏

‏Partial‏

‏10.79‏

‏45.75‏

‏7‏

‏Melbourne‏

‏Australia‏

‏Partial‏

‏10.84‏

‏43.9‏

‏8‏

‏Karachi‏

‏Pakistan‏

‏Illegal‏

‏5.32‏

‏41.89‏

‏9‏

‏Houston‏

‏USA‏

‏Partial‏

‏10.03‏

‏39.32‏

‏10‏

‏Toronto‏

‏Canada‏

‏Partial‏

‏7.82‏

‏33.38‏

‏N.B. Possible tax revenue refers to the total possible tax collection per year, if taxed at average US marijuana tax rate.‏

‏The table below shows the‏ ‏ top 10 cities with the highest and lowest consumption of cannabis, ‏ ‏per year:‏

‏Highest Consumers of Cannabis‏

‏ Lowest Consumers of Cannabis‏

‏#‏

‏City‏

‏Country‏

‏Legality‏

‏Price per gram, US$‏

‏Total consumption, metric tons‏

‏#‏

‏City‏

‏Country‏

‏Legality‏

‏Price per gram, US$‏

‏Total consumption, metric tons‏

‏1‏

‏New York‏

‏USA‏

‏Partial‏

‏10.76‏

‏77.44‏

‏1‏

‏Singapore‏

‏Singapore‏

‏Illegal‏

‏14.01‏

‏0.02‏

‏2‏

‏Karachi‏

‏Pakistan‏

‏Illegal‏

‏5.32‏

‏41.95‏

‏2‏

‏Santo Domingo‏

‏Dominican Rep.‏

‏Illegal‏

‏6.93‏

‏0.16‏

‏3‏

‏New Delhi‏

‏India‏

‏Partial‏

‏4.38‏

‏38.26‏

‏3‏

‏Kyoto‏

‏Japan‏

‏Illegal‏

‏29.65‏

‏0.24‏

‏4‏

‏Los Angeles‏

‏USA‏

‏Legal‏

‏8.14‏

‏36.06‏

‏4‏

‏Thessaloniki‏

‏Greece‏

‏Partial‏

‏13.49‏

‏0.29‏

‏5‏

‏Cairo‏

‏Egypt‏

‏Illegal‏

‏16.15‏

‏32.59‏

‏5‏

‏Luxembourg City‏

‏Luxembourg‏

‏Partial‏

‏7.26‏

‏0.32‏

‏6‏

‏Mumbai‏

‏India‏

‏Partial‏

‏4.57‏

‏32.38‏

‏6‏

‏Panama City‏

‏Panama‏

‏Illegal‏

‏3.85‏

‏0.37‏

‏7‏

‏London‏

‏UK‏

‏Illegal‏

‏9.20‏

‏31.4‏

‏7‏

‏Reykjavik‏

‏Iceland‏

‏Illegal‏

‏15.92‏

‏0.44‏

‏8‏

‏Chicago‏

‏USA‏

‏Partial‏

‏11.46‏

‏24.54‏

‏8‏

‏Asuncion‏

‏Paraguay‏

‏Partial‏

‏2.22‏

‏0.46‏

‏9‏

‏Moscow‏

‏Russia‏

‏Partial‏

‏11.84‏

‏22.87‏

‏9‏

‏Colombo‏

‏Sri Lanka‏

‏Illegal‏

‏9.12‏

‏0.59‏

‏10‏

‏Toronto‏

‏Canada‏

‏Partial‏

‏7.82‏

‏22.75‏

‏10‏

‏Manila‏

‏Philippines‏

‏Illegal‏

‏5.24‏

‏0.6‏

‏N.B. Total consumption is calculated per annum. ‏

‏Additional quotes:‏

‏“The way that the legalised cannabis industry is rapidly evolving alongside new technologies shows how innovative emerging tech companies are today.” says Uri Zeevi, CMO at Seedo. “Take the way that cannabis and cryptocurrency have joined forces, with ‏ ‏examples such as HempCoin or nezly, which manage processes and payments in the new marijuana industry.‏ ‏ When you consider too the potential that these new technologies have to disrupt the cannabis industry, there’s no denying that these are very exciting times.” ‏

‏“At Seedo, we’ve built technology that helps regular smokers to grow cannabis plants of the utmost quality from the comfort of their own home, avoiding pesticides and taking ownership of their personal supply.” says Uri Zeevi, CMO at Seedo. “We believe that by understanding the cost of weed around the world, we can help to educate smokers about the potential financial benefits of hydroponic growing technology.” ‏

‏“That illegal cannabis use is so high in countries that still carry the death penalty, such as Pakistan and Egypt, those in power ought to see how desperately new legislation is needed.” comments Uri Zeevi, CMO at Seedo. “By removing the criminal element from marijuana, governments will then able to more safely regulate production, take away power from underground gangs, and as we’ve shown in this study, generate huge tax revenues.”‏

‏Further findings:‏

‏New York City, USA has the highest consumption rate of cannabis‏ ‏, at 77.44 metric tons per year.‏

‏Boston, USA has the most expensive cannabis of all the cities where it’s legal‏ ‏, at 11.01 USD, while Montevideo, Uruguay has the least expensive at 4.15 USD. ‏

‏While Tokyo, Japan has the most expensive cannabis of all cities where it’s illegal, at 32.66 USD, ‏ ‏Jakarta, Indonesia has the least expensive at 3.79 USD, despite being classed as a Group 1 drug with harsh sentences such as life imprisonment and the death penalty.‏ ‏ ‏

‏For cities where cannabis is partially legal, Bangkok, Thailand has the most expensive at 24.81 USD, while Quito, Ecuador has the least expensive at 1.34 USD. ‏

‏Bulgaria has the highest tax rates for the most popular brand of cigarettes, at 82.65%, while Paraguay has the lowest, with rates of 16%. ‏

‏Cairo, Egypt would gain the most revenue in tax if they were to legalise cannabis‏ ‏ and tax it as the same rate as cigarettes, at 384.87 million USD. Singapore, Singapore would gain the least, at 0.14 million USD, due in part to the city’s low consumption of marijuana at 0.02 metric tons per annum.‏

‏Based on the average US marijuana tax rates currently implemented,‏ ‏ New York City could generate the highest potential tax revenue by legalising weed, with 156.4 million USD per year‏ ‏. Singapore, Singapore would gain the least, at 0.04 million USD

‏About “Seedo”‏ ‏: Seedo is a fully automated hydroponic growing device which lets you grow your own medicinal herbs and vegetables from the comfort of your own home. Seedo controls and monitors the growing process, from seed to plant, while providing optimal lab conditions to assure premium quality produce year-round. Seedo’s goal is to simplify the growing process, making it accessible for everyone, without compromising on quality. ‏

‏The full results of the 2018 Cannabis Price Index:‏

‏#‏

‏City‏

‏Country‏

‏Legality‏

‏Price per gram, US$‏

‏Taxes of cigarettes, % of the most sold brand‏

‏Total possible tax collection, if taxed at cigarette level, mil US$‏

‏Total possible tax collection, if taxed at average US marijuana taxes, mil US$‏

‏Total Consumption in metric tons‏

‏1‏

‏Tokyo‏

‏Japan‏

‏Illegal‏

‏32.66‏

‏64.36‏

‏32.14‏

‏9.37‏

‏1.53‏

‏2‏

‏Seoul‏

‏South Korea‏

‏Illegal‏

‏32.44‏

‏61.99‏

‏31.61‏

‏9.57‏

‏1.57‏

‏3‏

‏Kyoto‏

‏Japan‏

‏Illegal‏

‏29.65‏

‏64.36‏

‏4.64‏

‏1.35‏

‏0.24‏

‏4‏

‏Hong Kong‏

‏China‏

‏Illegal‏

‏27.48‏

‏44.43‏

‏19.72‏

‏8.33‏

‏1.62‏

‏5‏

‏Bangkok‏

‏Thailand‏

‏Partial‏

‏24.81‏

‏73.13‏

‏99.11‏

‏25.44‏

‏5.46‏

‏6‏

‏Dublin‏

‏Ireland‏

‏Illegal‏

‏21.63‏

‏77.80‏

‏29.31‏

‏7.07‏

‏1.74‏

‏7‏

‏Tallinn‏

‏Estonia‏

‏Partial‏

‏20.98‏

‏77.24‏

‏22.13‏

‏5.38‏

‏1.37‏

‏8‏

‏Shanghai‏

‏China‏

‏Illegal‏

‏20.82‏

‏44.43‏

‏49.12‏

‏20.75‏

‏5.31‏

‏9‏

‏Beijing‏

‏China‏

‏Illegal‏

‏20.52‏

‏44.43‏

‏43.10‏

‏18.21‏

‏4.73‏

‏10‏

‏Oslo‏

‏Norway‏

‏Partial‏

‏19.14‏

‏68.83‏

‏19.28‏

‏5.26‏

‏1.46‏

‏11‏

‏Washington, DC‏

‏USA‏

‏Partial‏

‏18.08‏

‏42.54‏

‏47.51‏

‏20.96‏

‏6.18‏

‏12‏

‏Cairo‏

‏Egypt‏

‏Illegal‏

‏16.15‏

‏73.13‏

‏384.87‏

‏98.78‏

‏32.59‏

‏13‏

‏Reykjavik‏

‏Iceland‏

‏Illegal‏

‏15.92‏

‏56.40‏

‏3.97‏

‏1.32‏

‏0.44‏

‏14‏

‏Belfast‏

‏Ireland‏

‏Illegal‏

‏15.81‏

‏77.80‏

‏13.55‏

‏3.27‏

‏1.10‏

‏15‏

‏Minsk‏

‏Belarus‏

‏Illegal‏

‏15.80‏

‏51.15‏

‏9.08‏

‏3.33‏

‏1.12‏

‏16‏

‏Athens‏

‏Greece‏

‏Partial‏

‏14.95‏

‏79.95‏

‏7.42‏

‏1.74‏

‏0.62‏

‏17‏

‏Auckland‏

‏New Zealand‏

‏Partial‏

‏14.77‏

‏77.34‏

‏106.03‏

‏25.73‏

‏9.28‏

‏18‏

‏Munich‏

‏Germany‏

‏Partial‏

‏14.56‏

‏72.90‏

‏50.90‏

‏13.10‏

‏4.80‏

‏19‏

‏Helsinki‏

‏Finland‏

‏Partial‏

‏14.42‏

‏81.53‏

‏27.12‏

‏6.24‏

‏2.31‏

‏20‏

‏Singapore‏

‏Singapore‏

‏Illegal‏

‏14.01‏

‏66.23‏

‏0.14‏

‏0.04‏

‏0.02‏

‏21‏

‏Berlin‏

‏Germany‏

‏Partial‏

‏13.53‏

‏72.90‏

‏114.77‏

‏29.55‏

‏11.64‏

‏22‏

‏Stuttgart‏

‏Germany‏

‏Partial‏

‏13.50‏

‏72.90‏

‏20.20‏

‏5.20‏

‏2.05‏

‏23‏

‏Thessaloniki‏

‏Greece‏

‏Partial‏

‏13.49‏

‏79.95‏

‏3.17‏

‏0.75‏

‏0.29‏

‏24‏

‏Stockholm‏

‏Sweden‏

‏Illegal‏

‏13.20‏

‏68.84‏

‏15.06‏

‏4.11‏

‏1.66‏

‏25‏

‏Vienna‏

‏Austria‏

‏Partial‏

‏12.87‏

‏74.00‏

‏59.21‏

‏15.02‏

‏6.22‏

‏26‏

‏Copenhagen‏

‏Denmark‏

‏Partial‏

‏12.47‏

‏74.75‏

‏20.65‏

‏5.18‏

‏2.22‏

‏27‏

‏Moscow‏

‏Russia‏

‏Partial‏

‏11.84‏

‏47.63‏

‏128.97‏

‏50.82‏

‏22.87‏

‏28‏

‏Hamburg‏

‏Germany‏

‏Partial‏

‏11.64‏

‏72.90‏

‏50.16‏

‏12.92‏

‏5.91‏

‏29‏

‏Chicago‏

‏USA‏

‏Partial‏

‏11.46‏

‏42.54‏

‏119.61‏

‏52.77‏

‏24.54‏

‏30‏

‏Philadelphia‏

‏USA‏

‏Partial‏

‏11.30‏

‏42.54‏

‏68.37‏

‏30.16‏

‏14.22‏

‏31‏

‏Bucharest‏

‏Romania‏

‏Partial‏

‏11.18‏

‏75.41‏

‏17.23‏

‏4.29‏

‏2.04‏

‏32‏

‏Cologne‏

‏Germany‏

‏Partial‏

‏11.14‏

‏72.90‏

‏28.51‏

‏7.34‏

‏3.51‏

‏33‏

‏Geneva‏

‏Switzerland‏

‏Partial‏

‏11.12‏

‏61.20‏

‏5.90‏

‏1.81‏

‏0.87‏

‏34‏

‏Boston‏

‏USA‏

‏Legal‏

‏11.01‏

‏42.54‏

‏28.59‏

‏12.61‏

‏6.10‏

‏35‏

‏Adelaide‏

‏Australia‏

‏Partial‏

‏10.91‏

‏56.76‏

‏41.60‏

‏13.75‏

‏6.72‏

‏36‏

‏Istanbul‏

‏Turkey‏

‏Partial‏

‏10.87‏

‏82.13‏

‏21.79‏

‏4.98‏

‏2.44‏

‏37‏

‏Melbourne‏

‏Australia‏

‏Partial‏

‏10.84‏

‏56.76‏

‏132.75‏

‏43.90‏

‏21.58‏

‏38‏

‏Sydney‏

‏Australia‏

‏Partial‏

‏10.79‏

‏56.76‏

‏138.36‏

‏45.75‏

‏22.59‏

‏39‏

‏New York‏

‏USA‏

‏Partial‏

‏10.76‏

‏42.54‏

‏354.48‏

‏156.40‏

‏77.44‏

‏40‏

‏Düsseldorf‏

‏Germany‏

‏Partial‏

‏10.70‏

‏72.90‏

‏15.82‏

‏4.07‏

‏2.03‏

‏41‏

‏Brisbane‏

‏Australia‏

‏Partial‏

‏10.63‏

‏56.76‏

‏66.88‏

‏22.12‏

‏11.09‏

‏42‏

‏Hanover‏

‏Germany‏

‏Partial‏

‏10.51‏

‏72.90‏

‏13.46‏

‏3.47‏

‏1.76‏

‏43‏

‏Prague‏

‏Czech Rep.‏

‏Partial‏

‏10.47‏

‏77.42‏

‏63.95‏

‏15.50‏

‏7.89‏

‏44‏

‏Frankfurt‏

‏Germany‏

‏Partial‏

‏10.29‏

‏72.90‏

‏18.06‏

‏4.65‏

‏2.41‏

‏45‏

‏Wellington‏

‏New Zealand‏

‏Partial‏

‏10.11‏

‏77.34‏

‏19.53‏

‏4.74‏

‏2.50‏

‏46‏

‏Dallas‏

‏USA‏

‏Partial‏

‏10.03‏

‏42.54‏

‏51.01‏

‏22.50‏

‏11.95‏

‏47‏

‏Houston‏

‏USA‏

‏Partial‏

‏10.03‏

‏42.54‏

‏89.13‏

‏39.32‏

‏20.89‏

‏48‏

‏Vilnius‏

‏Lithuania‏

‏Illegal‏

‏10.00‏

‏75.76‏

‏5.20‏

‏1.29‏

‏0.69‏

‏49‏

‏Zurich‏

‏Switzerland‏

‏Partial‏

‏9.71‏

‏61.20‏

‏10.33‏

‏3.17‏

‏1.74‏

‏50‏

‏Montpellier‏

‏France‏

‏Illegal‏

‏9.70‏

‏80.30‏

‏12.21‏

‏2.85‏

‏1.57‏

‏51‏

‏Canberra‏

‏Australia‏

‏Partial‏

‏9.65‏

‏56.76‏

‏10.96‏

‏3.63‏

‏2.00‏

‏52‏

‏Zagreb‏

‏Croatia‏

‏Partial‏

‏9.43‏

‏75.26‏

‏24.35‏

‏6.07‏

‏3.43‏

‏53‏

‏Nice‏

‏France‏

‏Illegal‏

‏9.40‏

‏80.30‏

‏15.80‏

‏3.69‏

‏2.09‏

‏54‏

‏Phoenix‏

‏USA‏

‏Partial‏

‏9.35‏

‏42.54‏

‏58.26‏

‏25.71‏

‏14.65‏

‏55‏

‏Paris‏

‏France‏

‏Illegal‏

‏9.30‏

‏80.30‏

‏102.25‏

‏23.90‏

‏13.69‏

‏56‏

‏Miami‏

‏USA‏

‏Partial‏

‏9.27‏

‏42.54‏

‏16.24‏

‏7.16‏

‏4.12‏

‏57‏

‏San Francisco‏

‏USA‏

‏Legal‏

‏9.27‏

‏42.54‏

‏30.94‏

‏13.65‏

‏7.85‏

‏58‏

‏London‏

‏UK‏

‏Illegal‏

‏9.20‏

‏82.16‏

‏237.35‏

‏54.22‏

‏31.40‏

‏59‏

‏Colombo‏

‏Sri Lanka‏

‏Illegal‏

‏9.12‏

‏73.78‏

‏3.98‏

‏1.01‏

‏0.59‏

‏60‏

‏Riga‏

‏Latvia‏

‏Illegal‏

‏9.00‏

‏76.89‏

‏10.23‏

‏2.50‏

‏1.48‏

‏61‏

‏Bratislava‏

‏Slovakia‏

‏Illegal‏

‏8.92‏

‏81.54‏

‏7.24‏

‏1.67‏

‏1.00‏

‏62‏

‏Milan‏

‏Italy‏

‏Partial‏

‏8.85‏

‏75.68‏

‏46.06‏

‏11.42‏

‏6.88‏

‏63‏

‏Varna‏

‏Bulgaria‏

‏Illegal‏

‏8.83‏

‏82.65‏

‏4.84‏

‏1.10‏

‏0.66‏

‏64‏

‏Marseille‏

‏France‏

‏Illegal‏

‏8.69‏

‏80.30‏

‏36.23‏

‏8.47‏

‏5.19‏

‏65‏

‏Glasgow‏

‏UK‏

‏Illegal‏

‏8.65‏

‏82.16‏

‏15.21‏

‏3.47‏

‏2.14‏

‏66‏

‏Toulouse‏

‏France‏

‏Illegal‏

‏8.62‏

‏80.30‏

‏18.67‏

‏4.36‏

‏2.70‏

‏67‏

‏Birmingham‏

‏UK‏

‏Illegal‏

‏8.58‏

‏82.16‏

‏27.73‏

‏6.34‏

‏3.93‏

‏68‏

‏Kuala Lumpur‏

‏Malaysia‏

‏Illegal‏

‏8.54‏

‏55.36‏

‏6.61‏

‏2.24‏

‏1.40‏

‏69‏

‏Monterrey‏

‏Mexico‏

‏Partial‏

‏8.45‏

‏65.87‏

‏4.17‏

‏1.19‏

‏0.75‏

‏70‏

‏Edinburgh‏

‏UK‏

‏Illegal‏

‏8.41‏

‏82.16‏

‏12.22‏

‏2.79‏

‏1.77‏

‏71‏

‏Lisbon‏

‏Portugal‏

‏Partial‏

‏8.36‏

‏74.51‏

‏4.69‏

‏1.18‏

‏0.75‏

‏72‏

‏Strasbourg‏

‏France‏

‏Illegal‏

‏8.35‏

‏80.30‏

‏11.13‏

‏2.60‏

‏1.66‏

‏73‏

‏Warsaw‏

‏Poland‏

‏Partial‏

‏8.31‏

‏80.29‏

‏29.27‏

‏6.84‏

‏4.39‏

‏74‏

‏Lyon‏

‏France‏

‏Illegal‏

‏8.20‏

‏80.30‏

‏19.45‏

‏4.55‏

‏2.95‏

‏75‏

‏Los Angeles‏

‏USA‏

‏Legal‏

‏8.14‏

‏42.54‏

‏124.88‏

‏55.10‏

‏36.06‏

‏76‏

‏Liverpool‏

‏UK‏

‏Illegal‏

‏7.94‏

‏82.16‏

‏10.86‏

‏2.48‏

‏1.67‏

‏77‏

‏Amsterdam‏

‏Netherlands‏

‏Partial‏

‏7.89‏

‏73.40‏

‏20.94‏

‏5.35‏

‏3.61‏

‏78‏

‏Manchester‏

‏UK‏

‏Illegal‏

‏7.88‏

‏82.16‏

‏58.99‏

‏13.48‏

‏9.11‏

‏79‏

‏Rome‏

‏Italy‏

‏Partial‏

‏7.86‏

‏75.68‏

‏88.16‏

‏21.86‏

‏14.82‏

‏80‏

‏Toronto‏

‏Canada‏

‏Partial‏

‏7.82‏

‏69.80‏

‏124.15‏

‏33.38‏

‏22.75‏

‏81‏

‏Denver‏

‏USA‏

‏Legal‏

‏7.79‏

‏42.54‏

‏20.53‏

‏9.06‏

‏6.20‏

‏82‏

‏Naples‏

‏Italy‏

‏Partial‏

‏7.75‏

‏75.68‏

‏29.82‏

‏7.40‏

‏5.08‏

‏83‏

‏Leeds‏

‏UK‏

‏Illegal‏

‏7.67‏

‏82.16‏

‏16.93‏

‏3.87‏

‏2.69‏

‏84‏

‏Seattle‏

‏USA‏

‏Legal‏

‏7.58‏

‏42.54‏

‏20.59‏

‏9.08‏

‏6.39‏

‏85‏

‏Madrid‏

‏Spain‏

‏Partial‏

‏7.47‏

‏78.09‏

‏93.40‏

‏22.45‏

‏16.01‏

‏86‏

‏Calgary‏

‏Canada‏

‏Partial‏

‏7.30‏

‏69.80‏

‏52.23‏

‏14.05‏

‏10.25‏

‏87‏

‏Luxembourg City‏

‏Luxembourg‏

‏Partial‏

‏7.26‏

‏70.24‏

‏1.62‏

‏0.43‏

‏0.32‏

‏88‏

‏San Jose‏

‏Costa Rica‏

‏Partial‏

‏7.23‏

‏69.76‏

‏7.84‏

‏2.11‏

‏1.56‏

‏89‏

‏Buenos Aires‏

‏Argentina‏

‏Partial‏

‏7.13‏

‏69.84‏

‏25.32‏

‏6.81‏

‏5.09‏

‏90‏

‏Brussels‏

‏Belgium‏

‏Partial‏

‏7.09‏

‏75.92‏

‏15.50‏

‏3.83‏

‏2.88‏

‏91‏

‏Santo Domingo‏

‏Dominican Rep.‏

‏Illegal‏

‏6.93‏

‏58.87‏

‏0.67‏

‏0.21‏

‏0.16‏

‏92‏

‏Graz‏

‏Austria‏

‏Partial‏

‏6.84‏

‏74.00‏

‏4.81‏

‏1.22‏

‏0.95‏

‏93‏

‏Budapest‏

‏Hungary‏

‏Illegal‏

‏6.74‏

‏77.26‏

‏7.70‏

‏1.87‏

‏1.48‏

‏94‏

‏Sofia‏

‏Bulgaria‏

‏Illegal‏

‏6.66‏

‏82.65‏

‏12.83‏

‏2.91‏

‏2.33‏

‏95‏

‏Ottawa‏

‏Canada‏

‏Partial‏

‏6.62‏

‏69.80‏

‏35.43‏

‏9.53‏

‏7.67‏

‏96‏

‏Vancouver‏

‏Canada‏

‏Partial‏

‏6.40‏

‏69.80‏

‏23.44‏

‏6.30‏

‏5.25‏

‏97‏

‏Sao Paulo‏

‏Brazil‏

‏Partial‏

‏6.38‏

‏64.94‏

‏68.55‏

‏19.81‏

‏16.55‏

‏98‏

‏Rotterdam‏

‏Netherlands‏

‏Partial‏

‏6.33‏

‏73.40‏

‏12.75‏

‏3.26‏

‏2.74‏

‏99‏

‏Ljubljana‏

‏Slovenia‏

‏Partial‏

‏6.32‏

‏80.41‏

‏3.43‏

‏0.80‏

‏0.67‏

‏100‏

‏Barcelona‏

‏Spain‏

‏Partial‏

‏6.23‏

‏78.09‏

‏39.59‏

‏9.51‏

‏8.14‏

‏101‏

‏Montreal‏

‏Canada‏

‏Partial‏

‏6.15‏

‏69.80‏

‏60.52‏

‏16.27‏

‏14.10‏

‏102‏

‏Kiev‏

‏Ukraine‏

‏Partial‏

‏6.00‏

‏74.78‏

‏14.73‏

‏3.70‏

‏3.28‏

‏103‏

‏Abuja‏

‏Nigeria‏

‏Illegal‏

‏5.88‏

‏20.63‏

‏7.40‏

‏6.73‏

‏6.10‏

‏104‏

‏Lima‏

‏Peru‏

‏Partial‏

‏5.88‏

‏37.83‏

‏12.28‏

‏6.09‏

‏5.52‏

‏105‏

‏Mexico City‏

‏Mexico‏

‏Partial‏

‏5.87‏

‏65.87‏

‏22.58‏

‏6.43‏

‏5.84‏

‏106‏

‏Cape Town‏

‏South Africa‏

‏Illegal‏

‏5.82‏

‏48.80‏

‏2.47‏

‏0.95‏

‏0.87‏

‏107‏

‏Karachi‏

‏Pakistan‏

‏Illegal‏

‏5.32‏

‏60.70‏

‏135.48‏

‏41.89‏

‏41.95‏

‏108‏

‏Manila‏

‏Philippines‏

‏Illegal‏

‏5.24‏

‏74.27‏

‏2.32‏

‏0.59‏

‏0.60‏

‏109‏

‏Rio de Janeiro‏

‏Brazil‏

‏Partial‏

‏5.11‏

‏64.94‏

‏28.82‏

‏8.33‏

‏8.69‏

‏110‏

‏Mumbai‏

‏India‏

‏Partial‏

‏4.57‏

‏60.39‏

‏89.38‏

‏27.78‏

‏32.38‏

‏111‏

‏New Delhi‏

‏India‏

‏Partial‏

‏4.38‏

‏60.39‏

‏101.20‏

‏31.45‏

‏38.26‏

‏112‏

‏Antwerp‏

‏Belgium‏

‏Partial‏

‏4.29‏

‏75.92‏

‏4.10‏

‏1.01‏

‏1.26‏

‏113‏

‏Astana‏

‏Kazakhstan‏

‏Illegal‏

‏4.22‏

‏39.29‏

‏1.78‏

‏0.85‏

‏1.07‏

‏114‏

‏Montevideo‏

‏Uruguay‏

‏Legal‏

‏4.15‏

‏66.75‏

‏19.54‏

‏5.50‏

‏7.06‏

‏115‏

‏Johannesburg‏

‏South Africa‏

‏Illegal‏

‏4.01‏

‏48.80‏

‏3.76‏

‏1.45‏

‏1.92‏

‏116‏

‏Panama City‏

‏Panama‏

‏Illegal‏

‏3.85‏

‏56.52‏

‏0.81‏

‏0.27‏

‏0.37‏

‏117‏

‏Jakarta‏

‏Indonesia‏

‏Illegal‏

‏3.79‏

‏53.40‏

‏1.92‏

‏0.68‏

‏0.95‏

‏118‏

‏Asuncion‏

‏Paraguay‏

‏Partial‏

‏2.22‏

‏16.00‏

‏0.16‏

‏0.19‏

‏0.46‏

‏119‏

‏Bogota‏

‏Colombia‏

‏Partial‏

‏2.20‏

‏49.44‏

‏15.80‏

‏6.00‏

‏14.53‏

‏120‏

‏Quito‏

‏Ecuador‏

‏Partial‏

‏1.34‏

‏70.39‏

‏0.56‏

‏0.15‏

‏0.60‏

‏Methodology‏

‏Selection of the cities:‏

‏To select the cities for the study, Seedo first looked at the top and bottom cannabis consuming countries around the world. Then they analysed nations where marijuana is partially or completely legal, as well as illegal, and selected the final list of 120 cities in order to best offer a representative comparison of the global cannabis price. ‏

‏Data:‏

‏Price per gram, US$ ‏ ‏- Crowdsourced city-level surveys adjusted to World Drug Report 2017 of the United Nations Office on Drugs and Crime.‏

‏Taxes on Cigarettes, % of the most sold brand‏ ‏ – Taxes as a percentage of the retail price of the most sold brand (total tax). ‏ ‏Source‏ ‏: Appendix 2 of the WHO report on the global tobacco epidemic, 2015.‏

‏Annual possible tax collection is calculated in the following way: ‏

‏Total_Possible_Tax=Population_City*Prevalence*Avg_Consumption_year_gr*price*tax_level, where:‏

‏Population: latest available local population data sources.‏

‏Annual Prevalence (percentage of population, having used weed in the year). Source: World Drug Report 2017 of the United Nations Office on Drugs and Crime‏

‏Average Consumption of weed per year in grams (people who consumed weed at least once in the previous year). ‏

‏Estimation, with the assumption, that one use of weed on average means one joint. ‏

‏One joint is assumed to have 0.66 grams of weed as in the paper of Mariani, Brooks, Haney and Levin (2010). ‏

‏The distribution of use during the year is assumed to be the same as in Zhao and Harris (2004), where the yearly usage varies from once or twice a year to everyday.‏

‏Total Consumption in Tons‏

‏Consumption=Population*Prevalence*Consumption_year_gr‏

‏Population: latest available local population data sources.‏

‏Annual Prevalence (percentage of population, having used weed in the year). ‏ ‏Source‏ ‏: World Drug Report 2017 of the United Nations Office on Drugs and Crime‏

‏Average Consumption of weed per year in grams (people who consumed weed at least once in the previous year).‏

‏Estimation, with the assumption, that one use of weed on average means one joint. ‏

‏One joint is assumed to have 0.66 grams of weed as in the paper of Mariani, Brooks, Haney and Levin (2010). ‏

‏The distribution of use during the year is assumed to be the same as in Zhao and Harris (2004), where the yearly usage varies from once or twice a year to everyday. ‏

‏US tax level ‏ ‏- Average tax level in the states of US where weed is legal: Alaska, California, Colorado, Maine, Massachusetts, Nevada, Oregon and Washington. Includes retail sales taxes, state taxes, local taxes and excise taxes.‏

‏Legality‏

‏Legal, if possession and selling for recreational and medical use is legal.‏

‏Illegal, if possession and selling for recreational and medical use is illegal.‏

‏Partial, if ‏

‏Possession of small amounts is decriminalised (criminal penalties lessened, fines and regulated permits may still apply)‏

‏OR medicinal use legal‏

‏OR possession is legal, selling illegal‏

‏OR scientific use legal‏

‏OR usage allowed in restricted areas (e.g. homes or coffee shops)‏

‏OR local laws may apply to legality (e.g. illegal at federal level, legal at state level)‏

‏First quote: Based on New York City Council’s free lunch initiative which began in September 2017, with 1.1 million public school children, at a cost of $1.75 per child per day.‏

Intelligence Operative- Iran Source Of Explosives Causing Beirut Nuke Like Destruction

Beirut / Tehran – The 2,750 metric tons of ammonium nitrate which caused a massive explosion in the port of Beirut originated in Iran before being loaded onto the Russian ship MV Rhosus whose cargo ultimately ended up being unloaded in the port of Beirut.

This revelation comes from an intelligence operative within Tehran’s government who has been secretly working with pro-democracy activists. The information comes from the NGO ‘The New Iran’ which has a track record of successfully smuggling sensitive information out of Iran, including much of the video footage seem in the media of widespread protests within Iran following the Iranian military shooting down Ukraine National Airlines flight PS752. 

Intelligence Operative Connected to Pro-Democracy Movement

The intelligence operative communicated the details over a secure messaging technology The New Iran uses for coordinating with their democratic allies within the country.  

Lebanese government sources have disclosed that the ammonium nitrate was seized in 2013. This date is perhaps significant the source says because it follows shortly after the opening of an ammonium nitrate factory within Iran.  

“Our source is risking his life to bring us this information,” says Dr. Iman Foroutan, Chairman of The New Iran, “because he believes that recent developments within the government are going to make these kinds of disasters more common.”

At the end of June, the government of Iran approved an agreement for a “25-year comprehensive cooperation plan between Iran and China.”

The two countries are calling it a “strategic partnership.”

The agreement is designed to help Iran get around the punishing sanctions of the United States, which more and more is being looked at as a common enemy by both Tehran and Beijing. China will be investing $400 billion USD into Iran with an immediate payment of $320 billion USD – a substantial portion of which is going into strengthening ports and military capability.  

“The Iranian regime is the world’s leading sponsor of terrorism,” says Dr. Foroutan who along with other influential Iranians in exile are working to fully expose the danger of Ayatollah Ali Khamenei’s radicalism and eventually free the Iranian people. “Now with the cover of China, one of the world’s rising superpowers, Iran will be able to move more weapons and weapons components throughout the region and the world.” 

Hezbollah leader Hassan Nasrallah has already twice threatened to blow up the port of Haifa in Israel. Hezbollah allegedly sought to acquire ammonium nitrate via Syria since 2009 and tried to infiltrate the agriculture ministry in Lebanon to do so, according to leaked diplomatic cables.  

In February 16, 2016 Nasrallah also said that ammonia is stored in Haifa and that there are 15,000 tons of gas Haifa and that explosions there might cause the deaths of tens of thousands of people. “the expert added that this is exactly like a nuclear bomb. In other words, Lebanon has a nuclear bomb. This is not an exaggeration.” Nasrallah laughs as he says this in the video. 

https://youtu.be/hp_Pdew_sG8

“With the agreement between China and Tehran allowing the regime to ship under the cover of China, potentially deadly materials like ammonia nitrate [may be] circumventing US sanctions,” says Iman Foroutan, “The next explosion may not be an accident.” For the Silo, Lance Laytner.