Tag Archives: Toronto

High Speed Toronto Quebec Rail Plan Underway

A special ‘Study in Brief’ via our friends at cdhowe.org

  • This study estimates the economic benefits of a new, dedicated passenger rail link in the Toronto-Québec City corridor, either with or without high-speed capabilities.
  • Cumulatively, in present value terms over 60 years, economic benefits are estimated to be $11-$17 billion under our modelled conventional rail scenarios, and $15-$27 billion under high-speed rail scenarios.
  • This study estimates economic benefits, rather than undertaking a full cost-benefit analysis. The analysis is subject to a range of assumptions, particularly passenger forecasts.

Introduction

Canada’s plans for faster, more frequent rail services in the Toronto-Québec City corridor are underway.

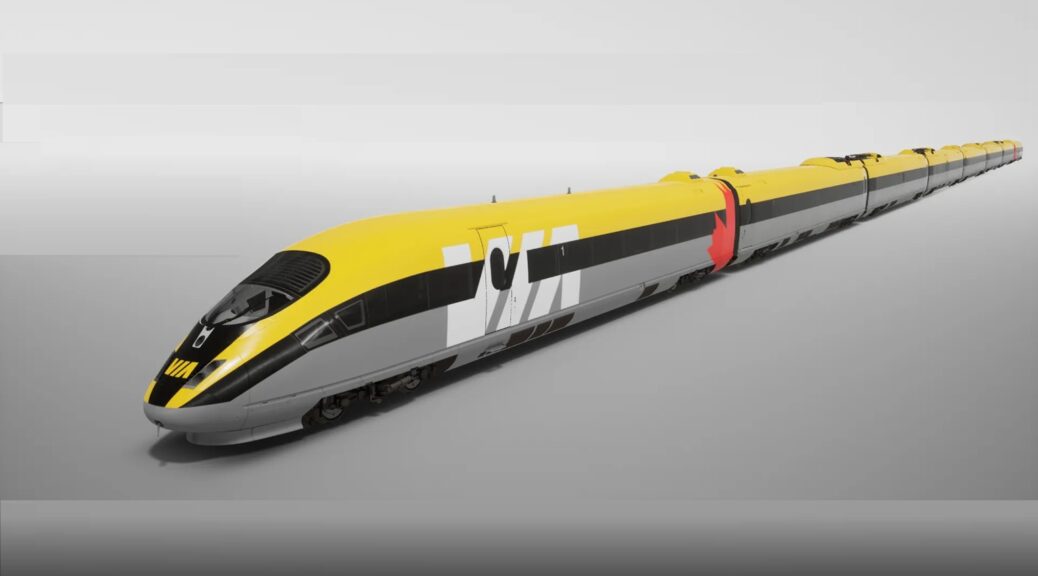
In 2021, the federal government announced plans for a new, high frequency, dedicated passenger rail link in the Toronto-Québec City corridor. More recently, the government has considered the potential for this passenger line to provide high-speed rail travel. These two options are scenarios within the current proposed rail project, which VIA-HFR has named “Rapid Train.” This paper analyzes the economic benefits of the proposed Rapid Train project, considering both scenarios, and by implication the costs of forgoing them.

The project offers substantial economic and social benefits to Canada. At a time when existing VIA Rail users must accept comparatively modest top speeds (by international standards) and regular delays, this project offers a dedicated passenger line to solve network capacity constraints. With Canada’s economy widely understood to be experiencing a productivity crisis (Bank of Canada 2024), combined with Canada seeking cost-effective approaches to reducing harmful CO2 emissions, the project offers both productivity gains and lower-emission transportation capacity. There are, in short, significant opportunity costs to postponing or not moving ahead with this investment and perpetuating the status quo in rail service.

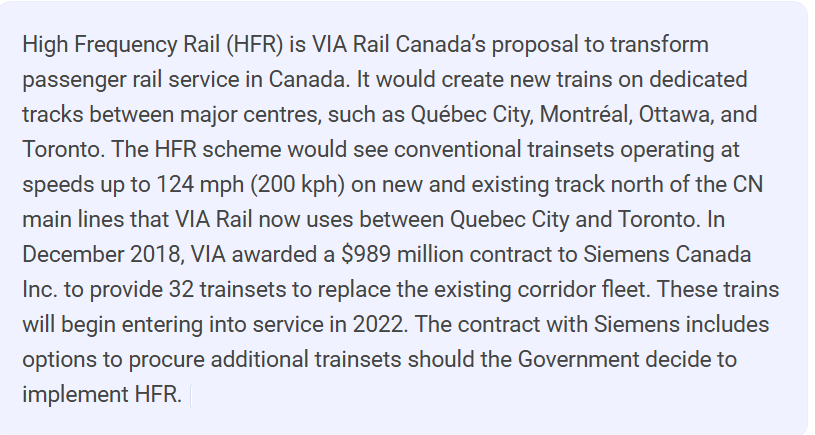
The Toronto-Québec City corridor, home to more than 16 million people (Statistics Canada 2024) and generating approximately 41 percent of Canada’s GDP (Statistics Canada 2023), lacks the sort of fully modernized passenger rail service provided in comparable regions worldwide. For example, Canada is the only G7 country without high-speed rail (HSR) – defined by the International Union of Railways (UIC) as a train service having the capability to reach speeds of 250 km per hour. Congestion has resulted in reliability (on time performance) far below typical industry standards. Discussion about enhancing rail service in this corridor has persisted for decades. But delays come with opportunity costs. This Commentary adds up those costs in the event that Canada continues to postpone, or even abandons, investment in enhanced rail services.

The existing rail infrastructure in the Toronto-Québec City corridor was developed several decades ago and continues to operate within parameters set during that time. However, significant changes have occurred since then, including higher population growth, economic development, and shifting transportation patterns. Rising demand for passenger and freight transportation – both by rail and other modes – has increased pressure on the region’s transportation network. There is increasing need to explore the various mechanisms through which enhancements to rail service could affect regional economic outcomes.

According to Statistics Canada (2024), the Toronto-Québec City corridor is the most densely populated and heavily industrialized region in Canada. This corridor is home to 42 percent of the country’s total population and comprises 43 percent of the national labor market. Transport Canada’s (2023) projections indicate that by 2043, an additional 5 million people will reside in Québec and Ontario, marking a 21 percent increase from 2020. This population growth will comprise more than half of Canada’s overall population increase over the period. As the population and economy continue to expand, the demand for all modes of transportation, including passenger rail, will rise. The growing strain on the transportation network highlights the need for infrastructure improvements within this corridor. In 2019, passenger rail travel accounted for only 2 percent of all trips in the corridor, with the vast majority of journeys (94 percent) undertaken by car (VIA-HFR website). This distribution is more skewed than in other countries with high-speed rail. For example, between London and Paris, aviation capacity has roughly halved since the construction of a high-speed rail link (the Eurostar) 25 years ago, which now has achieved approximately 80 percent modal share (Morgan et al. 2025, OAG website 2019). As such, there is potential for rail to have a greater modal share in Canada, particularly as the need for sustainable and efficient transportation solutions becomes more pressing in response to population growth and environmental challenges.

In practical terms, the cost of not proceeding with the Rapid Train project can be estimated as the loss of economic benefits that could have been realized if the project had moved forward. It should be noted that this study does not undertake a full cost-benefit analysis (CBA) of the proposed investment. Rather, it examines the various economic advantages associated with introducing the proposed Rapid Train service in the Toronto-Québec City corridor. Specifically, it analyzes five key dimensions of economic impact: rail-user benefits, road congestion reduction, road network safety improvements, agglomeration effects (explained below), and emission savings. The first three benefits primarily impact individuals who would have travelled regardless, or were induced to travel by rail or car. Agglomeration benefits extend to everyone living in the corridor, while emission savings contribute to both national and international efforts to combat climate change. In each of these ways, enhanced rail services can contribute to regional economic growth and sustainability. By evaluating these aspects, this study aims to develop quantitative estimates of the benefits that enhanced rail services could bring to the economy and society, and by doing so indicate the potential losses that could result from forgoing the proposed rail investment.

Rail user benefits constitute the most direct economic gains. Through faster rail transport with fewer delays, rail users experience reduced travel times, increased service reliability, and improved satisfaction. The Rapid Train project provides rail-user benefits because dedicated passenger tracks would remove the need to give way to freight transport, thus reducing delays. The Rapid Train project would see further benefits with faster routes reducing travel time.

Congestion effects extend beyond individual transportation choices to influence broader economic activity. This study considers how enhanced rail services might affect road congestion levels in key urban centres and along major highways within the corridor. Road network safety is a further aspect of the economic analysis in this study, as modal shift from road to rail could reduce road traffic accidents and their associated economic costs.

Agglomeration economies are positive externalities that arise from greater spatial concentration of industry and business, resulting in lower costs and higher productivity. Greater proximity results in improved opportunities for labour market pooling, knowledge interactions, specialization and the sharing of inputs and outputs (Graham et al. 2009). Improved transportation (both within and between urban areas) can support agglomeration economies by improving connectivity, lowering the cost of interactions and generating productivity gains.1 Supported by academic literature (Graham 2018), these wider economic benefits are included within international transportation appraisal guidance (Metrolinx 2021, UK Department for Transport 2024). Agglomeration effects from enhanced connectivity offer economic benefits distinct from (and additional to) benefits for rail users.

Environmental considerations, particularly emission savings, constitute a further economic benefit. This analysis examines potential reductions in transportation-related emissions and their associated economic value, including direct environmental costs. This examination includes consideration of how modal shifts might influence the corridor’s overall carbon footprint and its associated economic impacts.

The methodology employed in this analysis draws from established economic assessment frameworks while incorporating recent developments in transportation economics. The study utilizes data from VIA-HFR, Statistics Canada, and several other related studies and research papers. Where feasible, the analysis utilizes assumptions that are specific to the Toronto-Québec City corridor, recognizing its unique characteristics, economics, and demographic patterns.

The findings presented here may facilitate an understanding of how different aspects of rail service enhancement might influence economic outcomes across various timeframes and stakeholder groups. This analysis acknowledges that while some benefits may be readily quantifiable, others involve more complex, long-term economic relationships that require careful consideration within the specific context of the Toronto-Québec City corridor.

Based on our modelling and forecasts, the proposals for passenger rail infrastructure investment in the Toronto-Québec City corridor would present substantial economic, environmental, and social benefits (see Table 4 in the Appendix for a full breakdown, by scenario). Our scenario modelling is undertaken over a 60-year period, with new services coming on-stream from 2039, reported in 2024 present value terms. The estimated total of present value benefits ranges from $11 billion in the most conservative passenger growth scenario, to $27 billion in the most optimistic growth scenario. Cumulatively, in present value terms, economic benefits are estimated to be $11-$17 billion under our modelled conventional rail scenarios, and larger – $15-$27 billion – under high-speed rail scenarios. This is subject to a range of assumptions and inputs, including passenger forecasts.

These estimated benefits are built-up from several components. User benefits – stemming from time savings, increased reliability, and satisfaction with punctuality – are the largest component, with an estimated value of $3.1-$9.2 billion. Economic benefits from agglomeration effects (leading to higher GDP) are estimated at $2.6-$3.9 billion, while environmental benefits from reduced greenhouse gas emissions are estimated at $2.6-$7.1 billion. Additional benefits include reduced road congestion, valued between $2.0-$5.9 billion, and enhanced road safety, which adds an estimated $0.3-$0.8 billion. In addition, further sensitivity analysis has been undertaken alongside the main passenger growth scenarios.

Overall, the findings in this study demonstrate and underscore the substantial economic benefits of rail investment in the Toronto-Québec City corridor, and the transformative potential impact on the Toronto-Québec City region from economic growth and sustainable development.

Finally, there are several qualifications and limitations to the analysis in this study. It considers the major areas of economic benefit rather than undertaking a full cost-benefit analysis or considering wider opportunity costs, such as any alternative potential investments not undertaken. It provides an economic analysis, largely building on VIA-HFR passenger forecasts, rather than a full bottom-up transport modelling exercise. Quantitative estimates are subject to degrees of uncertainty.

The Current State of Passenger Rail Services in Ontario and Québec

The Toronto-Québec City corridor is the most densely populated and economically active region of the country. Spanning major urban centres such as Toronto, Ottawa, Montreal, and Québec City, this corridor encompasses more than 42 percent of Canada’s population and is a vital artery for both passenger and freight transport. Despite the significance of the corridor and the economic potential it holds, passenger rail services in Ontario and Québec face numerous challenges, and their overall state remains a topic of debate.

Passenger rail services in the region are primarily provided by VIA Rail, the national rail operator, along with commuter rail services like GO Transit in Ontario and Exo in Québec. VIA Rail operates intercity passenger trains connecting major cities in the Toronto-Québec City corridor, offering an alternative to driving or flying. VIA Rail’s most popular routes include the Montreal-Toronto and Ottawa-Toronto services, which run multiple times per day and serve business travellers, tourists, and daily commuters.

In addition to VIA Rail’s existing medium-to-long-distance services, commuter rail services play a key role in daily transportation for residents of urban centres like Toronto and Montreal. GO Transit, operated by Metrolinx, is responsible for regional trains serving the Greater Toronto and Hamilton Area, while Exo operates commuter trains in the Montreal metropolitan area. These services provide essential links for suburban commuters travelling to and from major employment hubs.

One of the primary challenges facing passenger rail services in Ontario and Québec is that the vast majority of rail infrastructure used by VIA Rail is owned by freight rail companies and is largely shared with freight trains, which means that passenger trains are regularly required to yield to freight traffic. This leads to frequent delays and slower travel times, making passenger rail less attractive compared to other modes of transport, especially for travellers who prioritize frequency, speed and punctuality. The absence of dedicated tracks for passenger rail is a major obstacle in improving travel times and increasing the frequency of service. Without addressing this issue, it is difficult to envisage a significant modal shift towards passenger rail, with cars having greater flexibility, and planes offering faster travel speeds once airborne. Much of the rail network was constructed several decades ago, and despite periodic maintenance and upgrades, it is increasingly outdated in its inability to facilitate higher speeds.

Passenger rail has the potential for low emission intensity. However, some of the potential environmental benefits of rail services in Ontario and Québec have yet to be fully realized. Many existing VIA Rail trains operate on diesel fuel, contributing to greenhouse gas emissions and air pollution. The transition to electrified rail, which would significantly reduce emissions, has been slow, and there is currently no comprehensive plan for widespread electrification of existing VIA Rail passenger rail services in the region.

The current state of rail passenger services in Ontario and Québec – and the opportunities for improvement – have prompted the development of the Rapid Train project along the Toronto-Québec City corridor, which proposes to reduce travel times between major cities and provide a more competitive alternative to air and car travel. The project would also generate significant environmental benefits by reducing greenhouse gas emissions associated with road and air transport. Furthermore, by investing in enhanced rail services, journey times would be further cut, generating additional time savings and associated economic benefits.

Current Government Commitment to Enhanced Rail Services

The Rapid Train project plans to introduce approximately 1,000 kilometres of new, mostly electrified, and dedicated passenger rail tracks connecting the major city centres of Toronto, Ottawa, Montreal, and Québec City. As such, it would be one of the largest infrastructure projects in Canadian history. It is led by VIA-HFR, a Crown corporation that collaborates with several governmental organizations, including Public Services and Procurement Canada, Housing, Infrastructure and Communities Canada; Transport Canada and VIA Rail, all of which have distinct roles during the procurement phases. Subject to approval, a private firm or consortium is expected to be appointed to build and operate these new rail services, via a procurement exercise (see below).

This new rail infrastructure would improve the frequency, speed, and reliability of rail services, making it more convenient for Canadians to travel within the country’s most densely populated regions. The project has the potential to shift a significant portion of travel from cars (which currently account for 94 percent of trips in the Toronto-Québec City corridor) to rail (which represents just 2 percent of total trips).

The project also seeks to contribute to Canada’s climate goals by reducing greenhouse gas emissions. Electrified trains and the use of dual-powered technology (for segments of the route that may still require diesel) will significantly reduce the environmental footprint of intercity travel. The project is expected to improve the experience for VIA Rail users, as dedicated passenger tracks will reduce delays caused by freight traffic, offering passengers faster, more frequent departures, and shorter travel times.

Beyond environmental benefits, the project is expected to stimulate economic growth by creating new jobs in infrastructure development, supporting new economic centres, and enhancing connectivity between cities, major airports, and educational institutions.

The project is currently at the end of the procurement phase, following the issuance of a Request for Proposals (RFP) in October 2023. Through the procurement exercise, a private-sector partner will be selected to co-develop and execute the project. The design phase, which may last four or more years, will involve regulatory reviews, impact assessments, and the development of a final proposal to the government for approval. Once constructed, passenger operations are expected to commence by 2040.

The Rapid Train project also offers opportunities to improve services on existing freight-owned tracks. VIA Rail’s local services, which currently operate between these major cities, will benefit from integration with this project. Although final service levels are not yet determined, the introduction of a new dedicated passenger rail line is expected to enable VIA Rail to optimize operating frequencies and schedules, leading to more responsive and efficient service for passengers. In turn, this will mean that departure and arrival times can be adjusted to better suit travellers’ needs, reducing travel times and increasing the attractiveness of rail as a mode of transportation for both leisure and business. As many of VIA Rail’s existing passenger services switch onto dedicated tracks, there is potential to free up capacity on the existing freight networks. As such, freight rail traffic may benefit from reduced congestion, supporting broader economic growth by easing supply chains and by improving the efficiency of goods transportation across Canada.

The project design will enable faster travel compared to existing services, but as the co-development phase progresses, it will examine the possibility of achieving even higher speeds on certain segments of the dedicated tracks. Achieving higher speeds is not guaranteed, due to the extensive infrastructure changes required and its associated costs, e.g., full double-tracking and the closure of approximately 1,000 public and private crossings. However, the project design currently incorporates flexibility to explore higher speeds where there may be opportunities for operational and financial efficiencies and additional user benefits.

The current Rapid Train project proposal seeks to achieve wider social and government objectives. In the context of maintaining public ownership, private-sector development partners will be required to respect existing labor agreements. VIA Rail employees will retain their rights and protections, with continuity ensured under the Canada Labour Code and relevant contractual obligations.

International Precedent

High-Speed Rail (HSR) already exists in many countries, with notable examples of successful implementation in East Asia and Europe. As of the middle of 2024, China has developed the world’s largest HSR network spanning over 40,000 kilometres, followed by Spain (3,661 km), Japan (3,081 km), and France (2,735 km) (Statista 2024). Among the G7 nations, Canada stands as the only country without HSR infrastructure, albeit the United States maintains relatively limited high-speed operations through the Acela Express in the Northeast Corridor. Recent significant HSR developments include China’s Beijing-Shanghai line (2,760 km), which is the world’s longest HSR route. In Europe, the UK’s High Speed 1 (HS1) connects London to mainland Europe via the Channel Tunnel. Italy has extended its Alta Velocità network with the completion of the Naples-Bari route in 2023, significantly reducing travel times between major southern cities (RFI 2023). Morocco recently became the first African nation to implement HSR with its Al Boraq service between Tangier and Casablanca (OCF 2022). In Southeast Asia, Indonesia’s Jakarta-Bandung HSR, completed in 2023, is the region’s first HSR system (KCIC 2023). India is installing the Mumbai-Ahmedabad HSR corridor, the country’s first bullet train project, which is scheduled to commence partial operations by 2024 (NHSRCL 2023).

The economic impacts of HSR have been extensively studied, particularly in Europe. In Germany, Ahlfeldt and Feddersen (2017) analyzed the economic performance of regions along the high-speed rail line between Cologne and Frankfurt: the study found that, on average, six years after the opening of the line, the GDP of regions along the route was 8.5 percent higher than their estimated counterfactual. In France, Blanquart and Koning (2017) found that the TGV network catalyzed business agglomeration near station areas, with property values increasing by 15-25 percent within a 5km radius of HSR stations. An evaluation of the UK’s HS1 project estimated cumulative benefits of $23-$30 billion (2024 prices, present value, converted from GBP) over the lifetime of the project, excluding wider economic benefits (Atkins 2014).

Modal shift and passenger growth is a critical driver of economic benefits. The Madrid-Barcelona corridor in Spain provides an example: HSR captured over 60 percent of the combined air-rail market within three years of operation, demonstrating that HSR can have a competitive advantage over medium-distance air travel (Albalate and Bel 2012). However, analysis by the European Court of Arbiters (2018) suggests that HSR routes require certain volumes of passengers (estimated at nine million) to become net beneficial, and while some European HSR routes have achieved this level (including the Madrid-Barcelona route), others have not. In the US, the Amtrek Acela service between Boston and Washington D.C. is estimated to have 3-4 million passengers (Amtrek 2023). For some high-speed rail lines, passenger volumes are supported by government environment policy. For example, Air France was asked directly by the government to reduce the frequency of short haul flights for routes where a feasible rail option existed (Reiter et al. 2022). Overall, passenger growth constitutes a key assumption regarding the benefits derived from the Rapid Train project.

Regarding the environmental benefits of HSR, a detailed study by the European Environment Agency (2020) found that HSR generates approximately 14g of CO2 per passenger-kilometre, compared to 158g for air travel and 104g for private vehicles. In Japan, the Central Japan Railway Company reports that the Shinkansen HSR system consumes approximately one-sixth the energy per passenger-kilometre compared to air travel. The UIC’s Carbon Footprint Analysis (2019) demonstrated that HSR infrastructure, despite high initial carbon costs during construction, typically achieves carbon neutrality within 4-8 years of operation through reduced emissions from modal shift.

Socioeconomic benefits of HSR extend beyond direct impacts on rail users. In Spain, the Madrid-Barcelona high-speed rail line enhanced business interactions by allowing for more same-day return trips and improved business productivity (Garmendia et al. 2012). Research has found that Chinese cities connected by HSR experienced a 20 percent increase in cross-regional business collaboration, providing potential evidence of enhanced knowledge spillovers and innovation diffusion (Wang and Chen 2019).

However, the implementation of HSR is not without challenges. Flyvbjerg’s (2007) analysis of 258 transportation infrastructure projects found that rail projects consistently faced cost overruns averaging approximately 45 percent. For example, the costs of the California High-Speed Rail project in the United States rose from an initial estimate of $33 billion in 2008 to over $100 billion by 2022, highlighting the importance of realistic cost projections and robust project management.

Positive labor market impacts are also evident, although varied by region. Studies in Japan by Kojima et al. (2015) found that cities served by Shinkansen experienced a 25 percent increase in business service employment over a 10-year period after connection. European studies, particularly in France and Spain, show more modest but still positive employment effects, with employment growth rates 2-3 percent higher in connected cities compared to similar unconnected ones (Crescenzi et al. 2021).

For developing HSR networks, international experience suggests several critical success factors. These include careful corridor selection based on population density and economic activity, integration with existing transportation networks, and sustainable funding mechanisms. The European Union’s experience, documented by Vickerman (2018), emphasizes the importance of network effects in finding that the value of HSR increases significantly when it connects multiple major economic centres.

Methodology

This study integrates data from VIA-HFR, Statistics Canada, prior reports on rail infrastructure proposals in Canada, and related studies, to build an economic assessment of potential benefits of the proposed Rapid Train project. Key assumptions throughout this analysis are rooted in published transportation models, modelling guidelines, and an extensive body of research. The methodology draws extensively from the Business Case Manual Volume 2: Guidance by Metrolinx, which itself draws upon the internationally recognized transportation appraisal guidelines set by the UK government’s Department for Transport (DFT). These established guidelines offer best practices and standards that provide a structured and reliable framework for estimating benefits. By aligning with proven methodologies in transportation and infrastructure project appraisal, this study ensures rigor and robustness within the economic modelling and analysis.

The proposed route includes four major stations: Toronto, Ottawa, Montréal, and Québec City. These major urban centres are expected to experience the most significant ridership impacts and related benefits. There are three further stations on the proposed route – Trois-Rivières, Laval, and Peterborough – although these are anticipated to have a more limited effect on the overall modelling results, due to their smaller populations. Based on forecast ridership data provided by VIA-HFR for travel between the four main stations, our model designates these areas as four separate zones to facilitate the benefit estimation. Figure 1 below illustrates the proposed route for the Rapid Train project and highlights the different zones modeled in this analysis.

According to current VIA-HFR projections, the routes are expected to be operational between 2039 and 2042. In line with typical transport appraisals, this paper estimates and monetizes economic and social benefits of the project over a 60-year period, summing the cumulative benefits from 2039 through to 2098, inclusive. To calculate the total present value (as of 2024) of these benefits, annual benefits are discounted at a 3.5 percent social discount rate, in line with Metrolinx guidance, and then aggregated across all benefit years.

Our model examines multiple scenarios to assess the range of potential benefits under various conditions. The primary scenarios within the Rapid Train project are for Conventional Rail (CR) and High-Speed Rail (HSR). These scenarios are distinguished by differences in average travel time, with HSR benefiting from significantly faster speeds than CR, and therefore lower travel times (see Table 2).

Within each of these scenarios, we consider three sub-scenarios from VIA-HFR’s modelled passenger projections – central, downside and upside – plus a further sub-scenario (referred to as the 2011 feasibility study in the Figures) based on previous modelled estimates of a dedicated passenger rail line in the corridor. The central sub-scenario provides VIA-HFR’s core forecast for passenger growth under CR and HSR. The upside sub-scenario reflects VIA-HFR’s most optimistic assumptions about passenger demand, while the downside represents the organisation’s more cautious assumptions.

The use of VIA-HFR’s passenger projections is cross-checked in two ways: First, our analysis models an alternative passenger growth scenario (2011 feasibility study), which is based upon the projected growth rate for passenger trips as outlined in the Updated Feasibility Study of a High-Speed Rail Service in the Québec City – Windsor Corridor by Transport Canada (2011).2 The analysis in that study was undertaken by a consortium of external consultants. Second, we have reviewed passenger volumes in other jurisdictions (discussed above and below).

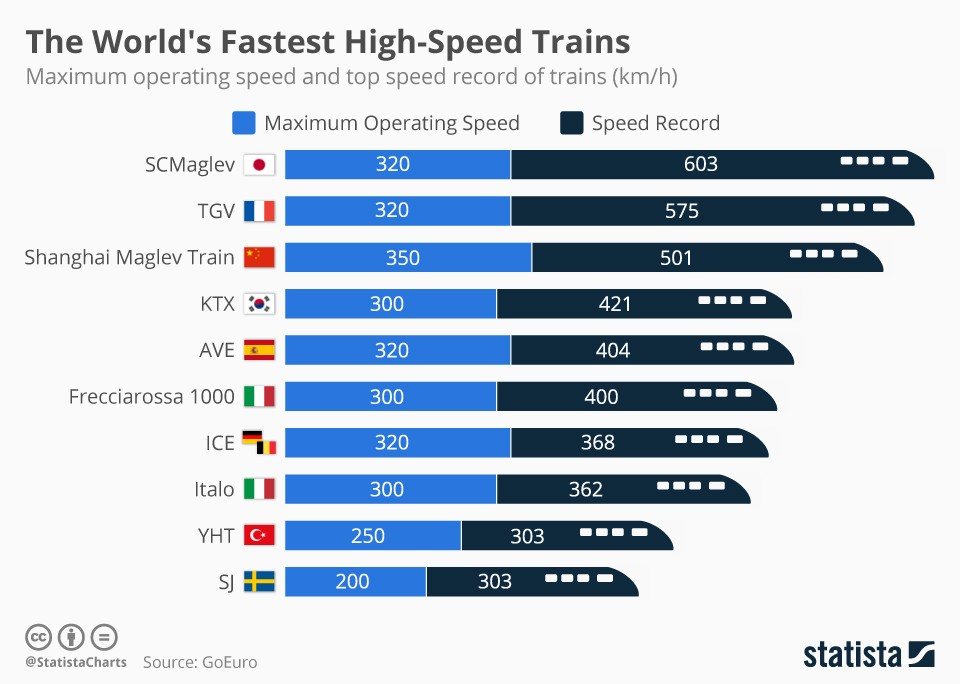
In the absence of investment in the Rapid Train project, VIA-HFR’s baseline scenario passenger demand projections indicate approximately 5.5 million trips annually by 2050 using existing VIA Rail services in the corridor. In contrast, with investment, annual projected demand for CR ranges from 8 to 15 million trips, and for HSR between 12 and 21 million trips by 2050, across all the sub-scenarios described above. Figures 2 and 3 illustrate these projected ridership figures under CR and HSR scenarios across each sub-scenario, as well as compared to the baseline scenario.

Under the CR and HSR scenarios, while the vast majority of rail users are expected to use the new dedicated passenger rail services, VIA-HFR passenger forecasts indicate that some rail users within the corridor will continue to use services on the existing VIA Rail line, for example, due to travelling between intermediate stations (Kingston-Ottawa). The chart below illustrates the breakdown of benefits under the central sub-scenario for high-speed rail.

User Benefits

User benefits in transportation projects such as CR/HSR can be broadly understood as the tangible and intangible advantages that rail passengers gain from improved services. These benefits encompass the value derived from time saved, enhanced reliability, reduced congestion, and improved overall travel experience. For public transit projects like CR/HSR, user benefits are often key factors in justifying the investment due to their broad social and economic impact.

Rail infrastructure projects can reduce the “generalized cost” of travel between areas, which directly benefits existing rail users, as well as newly induced riders. The concept of generalized cost in transportation economics refers to the total cost experienced by a traveller, considering not just monetary expenses (like ticket prices or fuel) but also non-monetary factors such as travel time, reliability, comfort, and accessibility.

Investments that improve transit may reduce generalized costs in several ways. Consistent, on-time service lowers the uncertainty, inconvenience and dissatisfaction associated with delays. More frequent services provide passengers with greater flexibility and reduced waiting times. Reduced crowding can offer more comfortable travel, reducing the disutility associated with congested services. Enhanced services like better seating, Wi-Fi, or improved station facilities may increase user satisfaction. Better access to transit stations or stops may allow for easier integration into daily commutes, increasing the convenience for existing and new travellers. Faster travel can reduce travel time, which is often valued highly by passengers.

In this paper, user benefits are estimated based on three core components: travel time savings based on faster planned journey times, enhanced reliability (lower average delays on top of the planned journey time), and the psychological benefit of more reliable travel. In our analysis, the pool of users is comprised of the existing users who are already VIA Rail passengers within this corridor, plus new users who are not prior rail passengers. Within this category of new users there are two sub-groups. First, new users include individuals who are forecast to switch to rail from other modes of transport, such as cars, buses, and airplanes – known as “switchers.” Second, new users also include individuals who are induced to begin to use CR/HSR as a result of the introduction of these new services – known as “induced” passengers. Overall, this approach captures the comprehensive user benefits of CR/HSR, recognizing that time efficiency, increased dependability, and greater customer satisfaction hold substantial value for both existing and new riders. The split of new users across switchers and induced users – including the split of induced users between existing transport modes, primarily road and air – is based on the federal government’s 2011 feasibility study, although the modelling in this Commentary also undertakes sensitivity analysis using VIA-HFR’s estimates for these proportions. The approach to estimating rail-user benefits is discussed below.

The modelling in this study incorporates projections of passenger numbers for both existing VIA Rail services (under a ‘no investment’ scenario) and for the proposed CR/HSR projects, sourced from VIA-HFR transport modelled forecasts. This enables the derivation of forecasts for both existing and new users.

In line with the formula (above) for user benefits, this study estimates the reduction in generalized costs (C1 – C0 ) arising from the new CR/HSR transportation service. Since the ticket price for the proposed CR/HSR is still undetermined, we have not assumed any changes versus current VIA Rail fares, although this is discussed as part of sensitivity analysis. The model reflects a reduction in generalized costs attributed to shorter travel times and enhanced service reliability under CR/HSR. Table 2 shows a comparison of the average scheduled journey times (as of 2023) for existing VIA Rail services, compared to forecast journey times under the proposed CR/HSR services, across different routes.

In addition to travel time savings based on scheduled journey times, an important feature of the CR/HSR project is that a new, dedicated passenger rail line can reduce the potential for delays. To estimate the reduction in travel delays under CR/HSR, we first calculated a lateness factor for both existing VIA Rail and the proposed CR/HSR, based on punctuality data and assumptions. Current data indicate that VIA Rail services are on time (reaching the destination within 15 minutes of the scheduled arrival time) for approximately 60 percent of journeys. Therefore, VIA Rail experiences delays (arriving more than 15 minutes later than scheduled) approximately 40 percent of the time. Data showing the average duration of delays are not available, and therefore we estimate that each delay is 30 minutes on average, based on research and discussions with stakeholders. CR/HSR would provide a dedicated passenger rail service, which would have a far lower lateness rate. Our model assumes CR/HSR would aim to achieve significantly improved on-time performance, with on-time arrivals (within 15 minutes) for 95 percent of journeys (Rungskunroch 2022), which equates to 5 percent (or fewer) of trains being delayed upon arrival.

Combined, there are time savings to users from both faster scheduled journeys and fewer delays. The estimated travel time savings are derived from the difference between the forecast travel times of CR/HSR and the average travel times currently experienced with VIA Rail. The value of time is monetized by applying a value of $21.45 per hour, calculated by adjusting the value of time recommended by Business Case Manual Volume 2: Guidance-Metrolinx ($18.79 per hour, in 2021 dollars) to 2024 dollars using the Consumer Price Index (CPI). This value remains constant (in real terms) over our modelling period.

There is an additional psychological cost of unreliability associated with delays. Transport appraisal guidelines and literature typically ascribe a multiplier to the value of time for unscheduled delays. The modelling in this study utilizes a multiplier of 3 for lateness, which is consistent with government transport appraisal guidance in the UK and Ireland (UK’s Department for Transport 2015, Ireland’s Department of Transport 2023). Some academic literature finds that multipliers may be even higher, although it varies according to the journey distance and purpose (Rossa et al. 2024). Overall, the lateness adjustment increases the value to rail users of CR/HSR due to its improved reliability and generates a small uplift to the total user benefits under CR/HSR.

The modelling combines these user benefits and makes a final adjustment to net off indirect taxes, ensuring that economic benefits are calculated on a like-for-like basis with costs incurred by VIA-HFR (Metrolinx 2021). Individual users’ value of time implicitly takes into account indirect taxes paid, whereas VIA-HFR’s investments are not subject to indirect taxation. Ontario’s rate of indirect taxation (13 percent harmonized sales tax rate) has been used in the modelling (Metrolinx 2021).

The modelling does not assume any variation in ticket prices under the proposed CR/HSR services, relative to existing VIA Rail services. User benefits in the analysis are derived purely from the shorter journey times and improved reliability. This approach enables the estimation, in the first instance, of the potential benefits from time savings and reliability. While CR/HSR ticket prices are not yet determined, it is nevertheless possible to consider the impact of changes to ticket prices as a secondary adjustment, which is discussed in the sensitivity analysis further below.

Congestion and Safety on the Road Network

In addition to rail-user benefits, the proposed CR/HSR project would also provide benefit to road users via decongestion and a potential reduction in traffic accidents.

When new travel options become available, such as improved rail services, some travellers shift from driving to using transit, reducing the number of vehicles on the road. This reduction in vehicle-kilometres travelled (VKT) decreases road congestion, providing benefits to the remaining road users. Decreased congestion leads to faster travel times, and can also lower vehicle operating costs, particularly in terms of fuel efficiency and vehicle wear-and-tear.

Our research model includes a forecast of how improvements in rail travel could lead to decongestion benefits for auto travellers in congested corridors. Through CR/HSR offering a faster and more reliable journey experience versus existing VIA Rail services, VIA-HFR’s passenger modelling forecasts shifts in travel patterns, with a significant proportion of new rail users being switchers from roads. These shifts reduce road congestion and in turn generate welfare benefits for those continuing to use highways.

Analysis of Canadian road use data, cross-checked with more granular traffic data from the UK, suggests that the proportion of existing road VKT is 37 percent in peak hours and 63 percent in off-peak hours, based on Metrolinx’s daily timetable of peak versus non-peak hours (Metrolinx 2021, Statistics Canada 2014, Department for Transport 2024). Using this information, the estimated weighted average impact of road congestion is approximately 0.004 hours/VKT. Time savings are converted into monetary values (using $21.45/hour, in 2024 dollars) to estimate the economic benefits of reduced road congestion.

In practice, road networks are unlikely to decongest by the precise number of transport users who are forecast to switch from road to rail. First, the counterfactual level of road congestion (without CR/HSR) will change over time, as a function of population growth, investment in road networks (such as through highway expansion), developments in air transport options, and wider factors. Many of these factors are not known precisely (e.g., investment decisions regarding highways expansion across the coming decades), therefore the counterfactual is necessarily subject to uncertainty. Second, if some road users switch to rail due to investment in CR/HSR, the initial (direct) reduction in congestion would reduce the cost of road travel, inducing a subsequent (indirect) “bounce-back” of road users (known as a general equilibrium effect). The modelling of congestion impacts in this study is necessarily a simplification, focusing on the direct impacts of decongestion, based on the forecast number of switchers from road to rail.

In addition to decongestion, CR/HSR may also improve the overall safety of the road network through fewer vehicle collisions. Collisions not only cause physical harm but also cause economic and social costs. These include the emotional toll on victims and families, lost productivity from injuries or fatalities, and the costs associated with treating accident-related injuries. Road accidents can cause disruptions that delay other travellers, adding additional economic costs, and can also incur greater public expenditure through emergency responses.

With CR/HSR expected to shift some users from road to rail, this study models the forecast reduction in overall road VKT. This estimate for the reduction in road VKT is converted into a monetary value assuming $ 0.09/VKT in 2024 prices, which is discounted in future years by 5.3 percent per annum to account for general safety improvements on the road network over time (such as through improvements in technology) and fewer accidents per year (Metrolinx 2018, Metrolinx 2021).

Agglomeration

Agglomeration economies are the economic benefits that arise when firms and individuals are located closer to one another. This generates productivity gains which are additional to direct user benefits. These gains can stem from improved labor market matching, knowledge spillovers, and supply chain linkages, benefiting groups of firms within specific industries (localization economies) as well as across multiple industries (urbanization economies). Where businesses cluster more closely – such as within dense, urbanized environments – these businesses benefit from proximity to larger markets, varied suppliers, and accessible public services. For instance, if a manufacturing firm relocates to an urban hub such as Montreal, productivity benefits may ripple across industries as the economic density and activity scale of the area increases. Agglomeration can enable longer-term economic benefits, through collaboration across businesses, universities, and research hubs, stimulating research and development, supporting innovation and enabling new industries to develop and grow.

Transport investments generate economic benefits and increase productivity through urbanization and localization economies. Urbanization economies (Jacobs 1969) refer to benefits arising from a business being situated in a large urban area with a robust population and employment base. This type of agglomeration allows firms to leverage broader markets and infrastructure advantages, thus achieving economies of scale that are independent of industry. Conversely, localization economies (Marshall 1920) focus on productivity gains within a specific industry, where firms in close proximity can cluster together to benefit from a specialized labor pool and more efficient supply chains. For example, as multiple manufacturing firms cluster within an area, their proximity allows them to co-create a specialized workforce and share industry knowledge, creating productivity gains unique to that industry.

In practice, improved transportation can generate agglomeration effects in two ways; first is “static clustering”, where improvements in connectivity facilitate greater movement between existing clusters of businesses and improved labor market access, without changing land use. For individuals and businesses in their existing locations, enhanced connectivity reduces the travel times and the costs of interactions, so people and businesses are effectively closer together and the affected areas have a higher effective density.

Second, “dynamic clustering” can occur when transport investments alter the location or actual density of economic activity. Dynamic clustering can lead to either increased or decreased density in certain areas, impacting the overall productivity levels across regions by altering labor and firm distributions. Conceptually, dynamic clustering’s benefits include the benefits from static clustering.

The analysis in this study is based on static clustering effects, focusing on productivity benefits arising from improved connectivity without modelling potential changes in land use or actual density. This approach estimates the direct economic gains of reduced travel times and enhanced accessibility within existing urban and industrial structures. Benefits arising from dynamic clustering are subject to greater uncertainty because it may involve displacement of economic activity between regions. In addition, variations in density across regions could be influenced by external factors – such as regional economic policies, housing availability, or industry-specific demands – that would require a much deeper and granular modelling exercise. Overall, focusing on static clustering provides a more conceptually conservative estimate of the benefits.

To estimate the agglomeration economies associated with the CR/HSR project, we utilize well-established transport appraisal methodology for agglomeration estimation (Metrolinx 2021). The analysis in this study applies one simplification to accommodate data availability, which is to undertake the analysis at an economy-wide level, rather than performing and aggregating a series of sector-specific analyses.

Overall, the three-step model estimates these agglomeration effects through changes in GDP. In the first step, the generalized journey cost (GJC) between each zone pair is calculated. This GJC serves as an average travel cost across various transportation modes (e.g., road, rail, air), taking account of journey times and ticket prices. The GJC is estimated for both the baseline (existing VIA Rail) and investment scenarios (CR/HSR), across multiple projection years. Due to the sensitivity of agglomeration calculations, in the baseline the GJC for CR/HSR, road and air are assumed to be equivalent, and in the investment scenario the GJC for road and rail are reduced by utilizing the rule of half principle (see Figure 5). The baseline utilizes Canada-wide vehicle kilometre data from Statistics Canada to estimate passenger modal shares (across existing VIA Rail, road, and air) for 2024, with the modal shares remaining constant over time in the baseline (Transport Canada 2021, Transport Canada 2018, Statistics Canada 2016). In the scenarios, the modal shares are adjusted for passengers moving from existing VIA Rail (and other transport modes) to CR/HSR, as well as induced passengers.

In the second step, the effective density of each of the four zones is calculated under all scenarios. Effective density increases in the investment scenarios because CR/HSR reduces the GJC and enhances connectivity between zones.

In the third step, changes in effective density between scenarios are converted into productivity gains measured as changes in GDP, utilizing a decay parameter of 1.8 and an agglomeration elasticity of 0.046 (Metrolinx 2021). The decay parameter (being greater than 1) diminishes the agglomeration benefits between regions that are further away from each other, such that the estimated productivity gains (arising from greater connectivity) are higher for areas that are closer together. The agglomeration elasticity is – based on academic literature – the assumed sensitivity of GDP to changes in agglomeration. Approximately, an elasticity of 0.046 assumes that a 1 percent increase in the calculated estimate for effective density (see step 2) would correspond to a 0.046 percent increase in GDP. Data on GDP and employment are sourced from Statistics Canada’s statistical tables, and forecast employment growth is assumed to align with Statistics Canada’s projected population growth rates.

Emissions

Environmental effects from transportation create a further source of economic impact. This study considers the main dimensions – greenhouse gas (GHG) emissions and air quality – each contributing to external welfare impacts that affect populations and ecosystems.

Transportation accounts for approximately 22 percent of Canada’s GHG emissions (Canada’s 2024 National Inventory Report), primarily through automobile, public transit, and freight operations. Emissions from GHGs, particularly carbon dioxide, significantly impact the global climate by contributing to phenomena such as rising sea levels, shifting precipitation patterns, and extreme weather events. The social cost of carbon (SCC) framework, published by Environment and Climate Change Canada, assigns a monetary value to these emissions, reflecting the global damage caused by an additional tonne of CO₂ released into the atmosphere. The federal government’s SCC values were published in 2023, more recently than the values recommended by Metrolinx’s 2021 guidance, and therefore the government’s values are used for the modelling in this study. For SCC, data from Environment and Climate Change Canada’s Greenhouse Gas Estimates Table are used, adjusted to 2024 values using CPI. Within the modelling, SCC values increase from $303.6 (in 2024) to $685.5 (in 2098). Using SCC in cost-benefit analyses enables more informed decisions on transportation investments by calculating the welfare costs and benefits associated with emissions under both investment and business-as-usual scenarios.

A wider set of pollutants emitted by vehicles – including CO, NOx, SO₂, VOCs, PM10s, and PM2.5s – pose further health risks, causing respiratory issues, heart disease, and even cancer. These harmful compounds, classified as Criteria Air Contaminants (CACs), impact individuals living or working in the vicinity of transport infrastructure, leading to external societal costs that are not fully perceived by direct users of the transport network. Health Canada’s Air Quality Benefits Assessment Tool (AQBAT) quantifies the health impacts of CACs, evaluating the total economic burden of poor air quality through a combination of local pollution data and Concentration Response Functions (CRFs), linking pollutants to adverse health effects. Furthermore, AQBAT considers air pollution’s effects on agriculture and visibility, allowing analysts to estimate the overall benefits of reducing transport-related emissions for communities across Canada.

This study identifies that CR/HSR has the potential to reduce emissions across multiple fronts. First, as an electrified rail system, CR/HSR is capable of operating with zero emissions, providing a cleaner alternative to existing rail services. If VIA Rail discontinues some services on overlapping routes with CR/HSR, emissions from rail transport in those areas would decrease, as per its planning forecasts. Additionally, CR/HSR’s higher speeds and greater reliability are expected to attract more passengers over time, encouraging a modal shift from more carbon-intensive forms of transportation, such as cars and airplanes. This anticipated shift would lead to a reduction in overall emissions from private vehicle and regional air travel, contributing to CR’s/HSR’s positive environmental impact.

By incorporating SCC and AQBAT metrics, the analysis offers a holistic appraisal of the environmental and social benefits of reducing emissions and improving air quality through CR/HSR, capturing the external welfare consequences beyond direct user impacts. Unit costs of CACs (see Table 3 below) are sourced from Metrolinx (2021) and are also adjusted by CPI into 2024 prices.

Results and Analysis

This section sets out the potential benefits of CR/HSR across various scenarios and sub-scenarios, spanning the 60-year period project implementation (2039 to 2098, inclusive). Results are reported in 2024 present value terms, cumulated over the 60-year period, as per cost-benefit analysis (CBA) literature (e.g., Metrolinx 2021). This cumulative present value represents the total value of benefits to 2098, with benefits in future years discounted to 2024 values. Figure 6 below illustrates the total cumulative present value of benefits for the proposed CR/HSR project, under different scenarios and passenger growth sub-scenarios in our model.

Since the HSR upside is the most optimistic sub-scenario, with a higher speed and the highest projected growth rate for rail passengers, it yields the largest total economic benefit, estimated at approximately $27 billion. Conversely, the CR downside assumes a comparatively lower speed and a smaller growth rate for rail passengers, resulting in the lowest benefit among all sub-scenarios, estimated at around $11 billion. This range of outcomes highlights that economic benefits are sensitive to assumptions around speed and passenger growth, underscoring the importance of these factors in the overall project evaluation.

Figure 7 illustrates the breakdown of benefits from the proposed CR/HSR project across different sub-scenarios and categories of benefits (see Table 4 in the Appendix for numerical values). User benefits form the largest component, indicating that rail passengers are expected to gain approximately $3.1–$9.2 billion in value over the modelling period, in present-day terms. Road decongestion effects, agglomeration impacts and emissions reductions are also forecast to deliver economic benefits. This study’s modelling estimates that CR/HSR could generate agglomeration effects that boost GDP by around $2.6–$3.9 billion over the 60-year analysis period, through enhancing productivity in the Ontario-Québec corridor. CR/HSR could significantly reduce greenhouse gas emissions and improve air quality, valued at approximately $2.6–$7.1 billion when considering the social cost of carbon and other pollutants. Benefits from reduced congestion on roads are estimated at $2.0–$5.9 billion. Finally, improved road safety offers an additional $0.3–$0.8 billion (approximately) in present value. Together, these impacts illustrate the wide-ranging economic, environmental, and social benefits anticipated from the CR/HSR project.

Given the potential sensitivity of economic benefits to assumptions around passenger growth, the 2011 federal government feasibility study provides a useful point of comparison for rail passenger growth under CR/HSR. The current outlook for rail passenger forecasts is not the same as it was in 2011, but some of the changes will have offsetting impacts. On one hand, Canada’s population has both grown faster (between 2011 and 2024) and is expected to grow faster in the future, relative to expectations in 2011. On the other hand, remote working has increased significantly since the COVID-19 pandemic. Passenger forecasts are discussed in more detail below.

Modelled agglomeration benefits are at the upper end of expectations. For example, the value of agglomeration effects for the HSR central scenario in this study ($3.4 billion) is almost 50 percent of the value of rail user benefits ($7.2 billion). Within academic literature, economic benefits from agglomeration are typically estimated to be in the region of 20 percent of direct user benefits on average (Graham 2018). However, across a range of studies, agglomeration benefits up to 56 percent have been identified (Oxera 2018). Therefore, the modelled estimates appear high relative to prior expectations, but within a plausible range.

To note, our agglomeration modelling (based on the Metrolinx methodology) forecasts significant economic benefits for all four of the zones. Our modelled agglomeration estimates for each zone are a function of the distance between zones (higher distance reduces agglomeration benefits due to the decay parameter), forecast uptake of CR/HSR services, and GDP. For example, Toronto’s agglomeration effect (as a percentage of GDP) is forecast to be one-third less than that of Montreal, due to be Toronto being slightly further away (from Ottawa, Montreal and Quebec City) than those cities are to each other. The agglomeration modelling is complex and sensitive to input assumptions, therefore it is important to recognize a degree of uncertainty around the precise value of agglomeration-related economic benefits.

Sensitivity Analysis

Ticket prices for CR/HSR impact the total benefits. For example, under the HSR central scenario, if HSR ticket prices were set 20 percent above existing Via Rail ticket prices, the forecast present value of user benefits falls by around 40 percent. The present value of economic benefits would fall by $4.2 billion compared to the HSR central case (from $20.7 billion to $16.5 billion), the majority being due to lower user benefits. However, recognizing cost of living concerns for Canadian households, it is also possible that median ticket prices could fall – such as through dynamic pricing – in which case economic benefits could also rise, by a similar amount.

The source of CR/HSR passengers will impact the estimated quantum of benefits, although relatively moderately. If proportions for “switchers” and “induced” passengers are sourced from VIA-HFR’s estimates, the level of economic benefits is $3.0 billion lower (falling from $20.7 billion to $17.7 billion). VIA-HFR’s forecasts assume a higher proportion of induced passengers, and also assume a greater share of switchers from air transport. As a result, the main impact of the VIA-HFR assumptions is to produce a smaller road decongestion effect, which reduces the potential benefits for road users.

The agglomeration calculation is relatively sensitive to the baseline assumption for passenger modal share. The modelling in this study is based on Canada-wide vehicle kilometre data, utilizing information from Transport Canada and Statistics Canada. Further analysis could be undertaken to refine this assumption across Ontario and Québec, while also ensuring that forecast agglomeration benefits align with wider estimates in existing transport literature.

Discussion and Qualifications

The analysis presented in this study is based on currently available information and projections, which are subject to certain limitations. Notably, there are uncertainties surrounding several key factors, including the precise routes and station locations, the design specifications (e.g., maximum achievable speed), ticket pricing, expected passenger numbers, the breakdown across ”switchers” and “induced” passengers, and passenger modal shares more generally. These elements, if altered, could impact the economic outcomes considerably.

There are several important qualifications to the scope of this study. First, it provides an analysis of potential economic benefits from CR/HSR investment but does not seek to quantify or analyze the direct costs involved in procurement, financing, construction, operations, maintenance or renewals. As such, this study constitutes an analysis of economic benefits, rather than a full cost-benefit analysis exercise. Second, this study seeks to estimate national, aggregate-level impacts, rather than undertaking a full distributional analysis of the impacts across and between different population groups. Third, this study’s primary focus is an economic assessment, rather than a transportation modelling exercise. The economic analysis utilizes and relies upon detailed, bottom-up passenger forecasts developed by VIA-HFR (received directly), cross-checked against the 2011 federal government’s previous HSR study. All three of these scope issues are important inputs to a holistic transport investment appraisal and should be considered in detail as part of investment decision-making.

Specifically, regarding this final issue – passenger forecasts – it is relevant to consider the transport modelling assumptions in further detail. As noted above, this study has not developed a full transport model, nor does it seek to take a definitive view on VIA-HFR’s forecasts. We would recommend that independent technical forecasts are developed. However, there are several relevant observations.

On one hand, VIA-HFR’s estimates do not appear implausible. For example, HSR has achieved a 7-8 percent share of passenger travel within certain routes in the United States (New York-to-Boston and New York-to-Washington), which would appear to be broadly consistent with the level of ambition within VIA-HFR’s passenger growth forecasts for the HSR central scenario (LEK 2019). The Madrid-Barcelona high speed link is estimated to serve 14 million passengers per year (International Railway Journal 2024). Internationally, HSR has achieved high market shares in Europe and Asia, such as 36 percent modal share for Madrid-Barcelona and 37 percent for London-Manchester, albeit noting that Europe typically has lower road usage and a higher propensity to use public transport (LEK 2019).

On the other hand, it is important to recognize the historic tendency for optimism bias within transportation investment projects. For example, in the UK, the HS2 project was criticized as having “overstated the forecast demand for passengers using HS2 [and] overstated the financial benefits that arise from that demand” (Written evidence to the Economic Affairs Committee, UK 2014). A review of HS2 in 2020 revised downwards previous estimates of economic benefits (Lord Berkeley Review 2020). As noted further above, analysis by the European Court of Arbiters (2018) posits that not all HSR projects induce sufficient passenger volumes to achieve net benefits over the project lifetime.

Overall, future passenger forecasts will depend upon a range of factors, including ticket prices, the availability and price of substitute modes (i.e., air), cultural preferences for private vehicle ownership, the impact of changing emission standards and the feasibility of construction plans.

This study applies some pragmatic, simplifying assumptions and approximations, applied to best practice transport appraisal (Metrolinx 2021; Department for Transport, UK, 2024). Across these modelling assumptions, there is variation in the directional impact on our estimates for economic benefits.

On one hand, some of the modelled benefits are likely to be relatively high-end estimates. First, for rail-user benefits, the modelling assumes no differential in ticket prices between existing VIA Rail services and CR/HSR. It also assumes that CR/HSR can deliver VIA-HFR’s proposed journey times with 95 percent reliability, which is achievable but not guaranteed. Second, for road congestion benefits, the forecast (direct) reductions in road congestion assume no indirect “bounce-back” effect where reduced traffic encourages new or longer trips (as noted above). For example, analysis of US highway demand suggests that capacity expansion only results in temporary congestion relief, for up to five years, before congestion returns to pre-existing levels (Hymel 2019). Third, for agglomeration, the modelled estimates for economic benefits are approximately 50 percent of rail-user benefits, which is close to the upper end of estimates from other transportation studies. Fourth, for emissions, the estimated benefits from forecast emissions savings do not seek to make assumptions about future changes to fuel efficiency for road and air transport, the emissions associated with power generation for CR/HSR, or the anticipated growth in electric vehicle adoption. In the case of electric vehicle deployment, there is uncertainty regarding the level of uptake, as well as the carbon intensity of electricity generation (albeit Ontario and Québec have relatively “clean” grids by international standards). Fifth, for benefits overall, this study leverages the VIA-HFR forecasts for passenger growth which are likely to be ambitious, though they have been robustly developed.

On the other hand, by focusing on the most material economic benefits, this study may exclude some smaller additional benefits that could be considered in further detail. First, there may be specific impacts on the tourism and hospitality sector. By enhancing travel convenience, CR/HSR is likely to draw more visitors to the various cultural, entertainment, and natural attractions across the corridor. As this influx would benefit local businesses by stimulating economic growth and job creation, these impacts are likely to be reflected within the estimate of agglomeration benefits.

Second, CR/HSR would improve national and global competitiveness, enhancing the appeal of Canadian cities to investors and environmentally conscious travellers while helping Canada align more closely with global standards for sustainable, modern infrastructure. Again, the economic benefits are likely to align with the agglomeration estimates.

Third, this study does not seek to quantify the potential gains to individual productivity from CR/HSR ridership, e.g., from individuals having time to work on the train. There is not expected to be a benefit for existing rail users, as they can already utilize Wi-Fi on existing VIA Rail services. For individuals switching to rail from road or air, potential benefits would only accrue to business users. Although switchers from road and air could have opportunities for improved individual productivity, Wi-Fi is increasingly available on airlines and individuals are able to dial into meetings remotely whilst driving.

Fourth, CR/HSR could generate wider economic benefits by increasing competition between businesses along the corridor. International transport appraisal literature suggests that enhanced transport connectivity can erode price markups (and therefore increase consumer surplus) by overcoming market imperfections (Metrolinx 2021; Department for Transport 2024). However, such impacts are likely to be relatively small, e.g., the Department for Transport (UK) estimates them at 10 percent of the benefits for rail business users only. Furthermore, sources of market power in Canada are legal in nature (e.g., interprovincial trade barriers) which rail investment alone is unlikely to overcome.

There are a further group of issues that have been excluded consciously from the methodology in this study. First, impacts on rail crowding are not considered. Some transport appraisals (such as the UK’s economic appraisal of the High Speed 2 project) do estimate the user benefits from reduced crowding. However, this is not as applicable for CR/HSR: In the UK, users of existing rail services may be required to stand if the train is overbooked, whereas users of existing VIA Rail services are guaranteed a seat with their booking. Second, impacts on land and property values are not included within the economic benefits. With greater access to efficient transportation, properties near rail stations typically see increased demand and value, boosting local tax revenues and promoting urban revitalization. While CR/HSR could increase values in areas close to the proposed stations, such changes are not additional to other wider economic benefits, but rather reflect a capitalization of those benefits. To avoid the risk of double counting the economic benefits already estimated, these are excluded (Department for Transport 2024).

CR/HSR may improve social equity and accessibility by offering affordable, reliable travel options for those without cars, including low-income individuals, students, and seniors. This expanded access enables broader employment, education, and healthcare opportunities, contributing to a more inclusive society. Whilst this study does not include a distribution analysis, social benefits from greater inclusion and social equity would constitute a benefit of CR/HSR investment and merit further detailed analysis.

Finally, in addition to policy considerations, major investment decisions have a substantial political dimension. For example, Canada is the only G7 country without HSR infrastructure. While cognizant of the political context, the analysis in this study is purely an economic assessment and does not consider political factors.

Conclusion

Canada’s population and economy continue to expand, particularly within the Toronto-Québec corridor. Existing transportation routes can expect greater congestion over time, particularly capacity-constrained VIA Rail services. In this context, can Canada afford not to progress with faster, more frequent rail services? There are significant opportunity costs to postponing investment.

This study has developed quantified estimates of the economic benefits of investing in the proposed Rapid Train project in the Toronto-Québec City corridor. Cumulatively, in present value terms, these economic benefits are estimated to be $11-$17 billion under our modelled conventional rail (CR) scenarios, and larger – at $15-$27 billion – under high-speed rail (HSR) scenarios. Economic benefits arise from several areas, including rail user time savings and improved reliability, reduced congestion on the road network, productivity gains through enhanced connectivity, and environmental benefits through emission reductions. With many commentators highlighting that Canada is experiencing a “productivity crisis” and a “climate emergency,” the projected productivity gains and lower-emission transportation capacity from the Rapid Train project present particularly valuable opportunities.

This study has assessed major economic benefit categories as identified within mainstream transport appraisal guidance. Further research could include additional sensitivity analysis around key parameters, as well as consideration of potential dynamic clustering effects, and projections for housing and land values.

Clearly, there is a cost to investment in a new dedicated passenger rail service: upfront capital investment, ongoing operations and maintenance expenditure, and any financing costs. These costs are not assessed in this study and will need to be considered carefully by policymakers. However, inaction – by continuing with the status quo rail infrastructure – also has a significant opportunity cost. Canada would forgo billions of dollars worth of economic advantage if it fails to deal with current challenges, including congestion on the rail and road networks, stifled productivity, and environmental concerns.

This study identifies the multi-billion-dollar economic benefits from the proposed Rapid Train project. While these benefits will need to be weighed alongside the forecast project costs, this study provides a basis for subsequent project evaluation and highlights the significant opportunity costs that Canada is incurring in the absence of investment.

Appendix

For the Silo, Tasnim Fariha, David Jones. The authors thank Daniel Schwanen, Ben Dachis, Glen Hodgson and anonymous reviewers for comments on an earlier draft. The authors retain responsibility for any errors and the views expressed.

References

Ahlfeldt, G., Feddersen, A., 2017. “From periphery to core: measuring agglomeration effects using high-speed rail.” Journal of Economic Geography.

Albalate, D., and Bel, G. 2012. “High‐Speed Rail: Lessons for Policy Makers from Experiences Abroad.” Public Administration Review 72(3): 336-349.

Amtrak. 2023. Amtrak fact sheet: Acela service.

Atkins, AECOM and Frontier Economics. 2014. First Interim Evaluation of the Impacts of High Speed 1, Final Report, Volume 1. Prepared for the Department of Transport, UK.

Blanquart, C., and Koning, M. 2017. “The local economic impacts of high-speed railways: theories and facts.” European Transport Research Review 9(2): 12-25.

Bonnafous, A. 1987. “The Regional Impact of the TGV.” Transportation 14(2): 127-137.

California High-Speed Rail Authority. 2022. “2022 Business Plan.” Sacramento: State of California.

Central Japan Railway Company. 2020. “Annual Environmental Report 2020.” Tokyo: JR Central.

Crescenzi, R., Di Cataldo, M., and Rodríguez‐Pose, A. 2021. “High‐speed rail and regional development.” Journal of Regional Science 61(2): 365-395.

Dachis, B., 2013. Cars, Congestion and Costs: A New Approach to Evaluating Government Infrastructure Investment. Commentary. Toronto: C.D. Howe Institute. July.

Dachis, B., 2015. Tackling Traffic: The Economic Cost of Congestion in Metro Vancouver. Commentary. Toronto: C.D. Howe Institute. March.

Department of Transport (Ireland). 2023. “Transport Appraisal Framework, Appraisal Guidelines for Capital Investments in Transport, Module 8 – Detailed Guidance on Appraisal Parameters.”

Department for Transport (UK). 2024. “National Road Traffic Survey, TRA0308: tra0308-traffic-distribution-by-time-of-day-and-selected-vehicle-type.ods (live.com).”

______________. 2024. “Road traffic estimates (TRA).”

______________. 2015. “Understanding and Valuing Impacts of Transport Investment.”

______________. 2024. Transport analysis guidance (various).

Economic Affairs Committee, UK government. 2014. Written evidence (Alan Andrews), “EHS0071 – Evidence on The Economic Case for HS2.”

European Court of Arbiters. 2018. “Special Report: A European high-speed rail network: not a reality but an ineffective patchwork.”

European Environment Agency. 2020. “Transport and Environment Report 2020: Train or Plane?” EEA Report No 19/2020.

Flyvbjerg, B. 2007. “Cost Overruns and Demand Shortfalls in Urban Rail and Other Infrastructure.” Transportation Planning and Technology 30(1): 9-30.

Garmendia, M., Ribalaygua, C., and Ureña, J. M. 2012. “High speed rail: Implication for cities.” Cities 29(S2), S26-S31.

Graham, D., 2018: “Quantifying wider economic benefits within transport appraisal.”

Government of Canada, House of Commons. 2019. Vote No. 1366. 42nd Parliament, 1st Session.

Government of Canada. 2023. “Social Cost of Greenhouse Gas Estimates – Interim Updated Guidance for the Government of Canada.”

High Speed Rail Authority (HS2 Ltd). 2024. “HS2 Phase One: London to Birmingham Development Report.”

Hymel, K. 2019. “If you build it, they will drive: Measuring induced demand for vehicle travel in urban areas.” Transport Policy Volume 76.

Indonesian-Chinese High-Speed Rail Consortium (KCIC). 2023. “Jakarta-Bandung High-Speed Railway Project Completion Report.”

International Railway Journal. 2024. “Spanish high-speed traffic up 37 percent in 2023.”

International Transport Forum-OECD. 2013. “High Speed Rail Performance in France: From Appraisal Methodologies to Ex-post Evaluation.”

International Union of Railways (UIC). 2022. “High-Speed Rail: World Implementation Report.” Paris: UIC Publications.

International Union of Railways (UIC). 2019. “Carbon Footprint of Railway Infrastructure.” Paris: UIC Publications.

Jacobs, J. 1969. The Economy of Cities. New York: Random House.

Kojima, Y., Matsunaga, T., and Yamaguchi, S. 2015. “Impact of High-Speed Rail on Regional Economic Productivity: Evidence from Japan.” Research Institute of Economy, Trade and Industry (RIETI) Discussion Paper Series 15-E-089.

Lawrence, M., Bullock, R. G., and Liu, Z. 2019. “China’s High-Speed Rail Development.” World Bank Publications.

LEK. 2019. New Routes to Profitability in High-Speed Rail.

Lord Berkeley Review. 2020. A Review of High Speed 2, Dissenting Report by Lord Tony Berkeley, House of Lords: Lord-Berkeley-HS2-Review-FINAL.pdf.

Marshall, A. 1920. Principles of Economics. London: Macmillan.

Metrolinx. 2018, GO Expansion Full Business Case.

________. 2021. Business Case Manual Volume 2: Guidance.

________. 2021, Traffic Impact Analysis Durham-Scarborough Bus Rapid Transit.

Morgan, M., Wadud, Z., Cairns, S. 2025, “Can rail reduce British aviation emissions?” Transportation Research Part D 138.

National High Speed Rail Corporation Limited (NHSRCL). 2023. “Mumbai-Ahmedabad High Speed Rail Project Status Report.”

Office National des Chemins de Fer (ONCF). 2022. “Al Boraq High-Speed Rail Service: Five Year Performance Review.”

OAS. 2019. “High Speed Rail vs Air: Eurostar at 25, The Story So Far.”

Oxera. 2018. “Deep impact: assessing wider economic impacts in transport appraisal.”

Reiter, V., Voltes-Dorta, A., Suau-Sanchez, P. 2022, “The substitution of short-haul flights with rail services in German air travel markets: A quantitative analysis.” Case Studies on Transport Policy.

Rete Ferroviaria Italiana (RFI). 2023. “Alta Velocità Network Expansion: Naples-Bari Route Completion Report.”

Rossa et al. 2024. “The valuation of delays in passenger rail using journey satisfaction data.” Elsevier, Part D (129).

Rungskunroch, P. 2022. “Benchmarking Operation Readiness of the High-Speed Rail (HSR) Network.”

Statistics Canada. 2023. Table 36-10-0468-01 Gross domestic product (GDP) at basic prices, by census metropolitan area (CMA) (x 1,000,000).

______________. 2024. Table 14-10-0420-01 Employment by occupation, economic regions, annual.

______________. 2024. Table 17-10-0057-01 Projected population, by projection scenario, age and gender, as of July 1 (x 1,000).

_____________. 2016. Table 8-1: Domestic Passenger Travel by Mode, Canada.

______________. 2014, Canadian vehicle survey: Canadian vehicle survey, passenger-kilometres, by type of vehicle, type of day and time of day, quarterly (statcan.gc.ca).

Transport Canada. 2021. Transportation in Canada 2020, Overview Report, Green Transportation.

_______________. 2018. RA16-Passenger and Passenger-Kms for VIA Rail Canada and Other Carriers.

Ministry of Transportation of Ontario & Transport Canada. 2011. “Updated feasibility study of a high-speed rail service in the Québec City – Windsor Corridor: Deliverable No. 13 – Final report.”

VIA-HFR website. 2024. Frequently Asked Questions.

Vickerman, R. 2018. “Can high-speed rail have a transformative effect on the economy?” Transport Policy 62: 31-37.

Wang, X., and Chen, X. 2019. “High-speed rail networks, economic integration and regional specialisation in China.” Journal of Transport Geography 74: 223-235.

LANDSCAPES 2025 At the Aird Showcases Contemporary Landscape Artists

LANDSCAPES 2025 is an impressive online survey exhibition adjudicated by the notable public art gallery programmer Krista Young and the celebrated artist Clint Griffin. The John B. Aird Gallery is proud to present its first large group project organized around the Landscape Genre, a genre of art practiced for centuries around the world.

Broadly defined, a landscape practice is a migratory representation of an artist’s creativity within the fluid realms of two- or three-dimensional art, whether representational or non-representational.

This intentionally broad definition allows for a diverse range of artworks, reflecting the variety of contemporary art techniques and practices today.

LANDSCAPES features new work by fifty-five artists inclusive of John Abrams, Rhonda Abrams, Sue Archibald, Joe Atikian, Phill Atwood, Jarrod Barker, Ioana Bertrand, Matthew Brown, J. Lynn Campbell, Alyson Champ, Ava P Christl, Frances Cordero de Bolaños, Glen Cumming, Grace Dam, Fanny Desroches, Jennifer Dobinson, Edward M. Donald, Janice Evans, Tanya Fenkell, Marie Finkelstein, Julie Florio, Robert Fogel, Anna & Richelle Gaby-Trotz & Forsey, Elena Gaevskaya, Arnie Guha, Stev’nn Hall, Michael Hannan, Emily Honderich, Carol Hughes, Connie Ivany, Marlene Klassen, Lisa Litowitz, Ramona Marquez-Ramraj, Claudia McKnight, Susan Munderich, Mahnez Nezarati, Allan O’Marra, Sherry Park, Karen Perlmutter, Piera Pugliese, Jackie Rancourt, Katie Rodgers, Lynne Ryall, Kaija Savinainen, Lee Schnaiberg, Wendy Skog, Carolynn Smallwood, Margaret Stawicki, Kate Taylor, Robert Teteruck, Steph Thompson, Joanna Turlej, Dejana Veljko, Victoria Wallace and Don Woodiwiss.

The landscape work of these artists spans various themes, from expansive vistas and sophisticated gardens to untamed wilderness.

These pieces engage with the dialogue between traditional art history and contemporary interpretations. Some explore the connections between mythologies and landscapes, investigating the relationship between spirituality and nature, which may lead to more abstract representations. Conversely, other works critically examine the impacts of the railroad, displacement, and extraction industries, illustrating the lasting scars these forces leave on the land.

JURORS BIOGRAPHY

Clint Griffin lives and works in Toronto. His work has been widely shown in Canada and the United States. Celebrated in both the contemporary and folk art worlds, Griffin’s work can be found in many private and public collections including the Art Gallery of Ontario, Bank of Montreal and Canada Council Art Bank. Clint currently owns and operates a fine art services business providing service to galleries, artists, collectors and institutions throughout Ontario.

Krista Young has held roles in both administrative and programming capacities at public art galleries in Northern and Northeastern Ontario. Krista has assisted in the development of programming, publications and touring exhibitions. Now based in Toronto, Krista is a small business owner and mother of three.

For the Silo, Carla Garnet.

Where To Sell Your Old Coins In Toronto

C:\Users\Renae\Downloads\amount-blur-change-1006060.jpg

There could be a number of reasons why you are looking to sell coins in Toronto. Maybe you inherited a whole bunch and you aren’t quite sure what to do with them – or maybe you are collector and want to sell off a few for a bit of extra money. You could also be someone who found a stash of old coins at home and are wondering if any are rare and can be worth something.

In either case, it’s important that you go to a trusted source that can ensure you are getting the right value for your coins. If you visit Muzeum.ca/pages/coins you will see that they offer free evaluations by experts who can tell you if you have something worthwhile on your hands.

What They Buy

This Toronto storefront of the famous Great Canadian Roadshow will buy Canadian and American coins, but because of their large network of collectors they are able to take any kind of gold or silver coin off your hands.

Gold Coins

  • Worldwide from any nation (Austrian, Mexican, etc.)
  • American – Gold Eagle, Liberty Head, Indian Head
  • Olympic
  • Centennial
  • Royal Canadian Mint

Silver Coins

  • Worldwide from any nation (Austrian, Mexican, etc.)
  • Canadian dated 1968 and Earlier
  • American dated 1964 and Earlier
    • JFK Half Dollars 1969 and Earlier
  • British Coins dated 1946 and Earlier 

They will also buy numismatic, commemorative, proof, and uncirculated coins.

What Makes a Coin Valuable?

There are a number of factors that go into what makes coinage valuable – precious metal content being one of them. If coinage is made of gold or silver it will be worth money purely based on the fact that it is made of precious metals.

Typically, Canadian and American coins from the mid-1960s and earlier were made of silver, making them more valuable than coinage dated later. This is because after the Great Depression it became harder to make coins out of silver, so they began to make them out of bronze, copper, and/or steel.

But even then some coins like the Canadian 1948 silver dollar (dubbed the “King of Canadian Silver Dollars”) can be worth a lot of money simply because so few of them were minted. In fact, though 18,780 coins were minted only a few are said to have survived. Therefore, rarity is another determining factor of coinage value.

Another factor is the design of the coin and whether or not there were any errors in its production. Take, for instance, the 1906 Canada “Small Crown” Quarter where the crown was printed in error with a smaller crown than what it should have. These few misprints can be worth almost $1,000.

Finally, coinage maintains its value when it is well taken care of. A scale of 1 to 70 is used to determine the grade of a coin. Mint condition, uncirculated, or dated coinage is usually rated between 65 and 70.

Only One Way to Be Sure

After all is said and done, the only way you can tell for sure how much your coins might be worth is by taking them in to get evaluated. An expert will be able to check whether your items are authentic based on multiple factors including weight, precious metals, design, and minting.

Cutting Edge Practical Effects Featured In New Sci Fi Fantasy SPACEMAN

J.K. Simmons and Mena Massoud star in Dan Abramovici’s New Sci-Fi Fantasy

SPACEMAN

New sci fi fantasy by Canadian Film Center alumni is a coming of age film breaks barriers via a deeply human handcrafted story made by fusing old Hollywood techniques with state-of-the art cinematic mastery.

TORONTO (July, 2024) – Press Play Films announces their newest film, SPACEMAN. Written and directed by emerging visionary filmmaker Dan Abramovici, the film stars Academy Award-winner J.K. Simmons (Whiplash, Being the Ricardos, Red One), Mena Massoud (Aladdin, The Royal Treatment) and Trevor Copp (Bulfinch’s Mythology). SPACEMAN is not only a fresh and innovative take on some of the most beloved and renowned cinematic genres, it’s something brand-new: A mix of sci fi, fantasy, and coming of age, combining elements of classic Hollywood, a la Chaplin and Keaton, with cutting edge practical effects, in a film that brings to mind classic works by Michel Gondry and Baz Luhrman. 

SPACEMAN is produced by Ali Mashayekhi (The Last King, Evolving Vegan), Mena Massoud, and Dan Abramovici.

SPACEMAN uses mime, stop motion, classic animation, and theatrical elements, to explore one artist’s loss of creative passion and his journey to get it back. Allied with his passion (Mena Massoud), Spaceman (Trevor Copp) has to travel through the looking glass, and battle his imposter syndrome (J.K. Simmons), in order to truly see himself once more.

The film is an exploration of identity, artistic passion, and the fragile nature of human connection. It weaves themes of self-discovery, mental health, and the pursuit of dreams. 

“My hope is to blur the lines between the tangible and the ephemeral. By delving into Spaceman’s subconscious we are able to explore  the cathartic nature of artistic creation and the ways in which it can offer a sense of purpose, as well as the danger and risk to one’s sense of self.” Said Abramovici. 

“Spaceman is a unique film in many ways, including it being highly commercially viable while staying true to its artistic integrity. It’s a movie that audiences all over the world will relate to on so many levels.” Said Mashayekhi. 

After immigrating to Canada, Abramovici used filmmaking to explore his many questions about identity, often using a surrealist approach to broach complex human moments. He began his career  as an actor, most recently on projects such as Sofia Coppolla’s Priscilla, HBO’s  Jane, FX’s What We Do In The Shadows, and CBS’s Star Trek Discovery.

Abramovici is an alumni of the CFC/ Canadian Film Center.

Abramovici sold his first feature film, the comedy BEN’S AT HOME to Netflix and then jumped behind the camera, writing and directing a series of short films, including the Academy-Qualifying PLAY IT AGAIN (Austin FF Best Short Winner 2021), LIMINAL (Raindance, HollyShorts), STUCK (Dances With Films LA), and SPACEMAN.

He is also a Top 10 screenwriting award winner at Cinequest, where Laurence Kasdan (Star Wars, Indiana Jones) and Dennis Lehane (The Wire, The Drop) served as writing mentors.

Abramovici’s upcoming feature, SEARCHING FOR MARCEAU, builds upon this previous work. It has ranked in the top 1% of projects on Coverfly, is a Shore Scripts Finalist, Top 50 at the LaunchPad competition, and a CineStory recipient.Ali Mashayekhi has produced over 85 films around the world since 2003 including; Japan, Indonesia, USA, Netherlands and France, screening at over a 100 festivals and winning several high profile awards including Best Short Film for “Play it Again”, directed by Dan Abramovici, at the Austin Film Festival in 2021. 

Ali is also the Executive Director of the Ethnically Diverse Artists (EDA) Foundation, a non-profit and charitable organization founded by Mena Massoud (Aladdin), which aims to inspire inclusivity and diversity in the arts. Additionally, Ali is the “Lead Creative Ambassador” for the International Network of Aid and Relief Association (INARA) founded by Ex-CNN senior international correspondent Arwa Damon, bringing creative film related initiatives to philanthropic work. 

Recently Ali premiered at Raindance Film Festival 2024 a Stephen King short story adaptation based on Sherlock Holmes, The Last King, entirely in the Persian language.

This fall, Ali is producing a gritty crime-thriller with Fortin Films, a Canadian production company from Toronto. Currently Ali is the Executive Producer on the travel vegan food show Evolving Vegan, with producing partner and Host Mena Massoud under their Press Play Productions company. 

J.K. Simmons has appeared in a diverse range of projects spanning from motion pictures, television and the stage on and off-Broadway.  He won the 2015 Academy Award for Best Supporting Actor for his portrayal of merciless jazz instructor, ‘Fletcher’ in Sony Pictures Classics’ “Whiplash.” His performance in the film also garnered him a Screen Actors Guild Award, Golden Globe, Independent Spirit Award and BAFTA Award, as well as many critics’ group awards around the world.  “Whiplash” premiered at the 2014 Sundance Film Festival and won the Dramatic Audience Award and Grand Jury Prize for Best Film.  The film also garnered five Academy Award nominations including Best Picture.  Simmons will next be seen in “The Union,” “Red One,” “SNL 1975,” and “Juror #2.”

In 2021, Simmons was seen starring alongside Nicole Kidman and Javier Bardem in Amazon’s biographical drama about Lucile Ball, “Being the Ricardos” in which he received an Academy Award nomination.

Simmons was also seen starring in STX’s, “National Champions’ and starring alongside Chris Pratt in Amazon’s sci-fi thriller “The Tomorrow War.” 

In 2020, Simmons starred in Hulu’s “Palm Springs”, alongside Andy Samberg and Cristin Milioti. He also appeared in the Apple TV+ miniseries, “Defending Jacob,” based on the 2012 novel of the same name.

In 2019, Simmons starred in the second season of the critically acclaimed Starz series “Counterpart” which began its run in 2017. Created by Justin Marks, Simmons portrays both primary characters as two vastly differing versions of themselves.  

In 2018, Simmons starred in Director Brian Kirk’s action thriller “21 Bridges,” alongside Sienna Miller, Taylor Kitsch and Chadwick Boseman. The film follows a disgraced NYPD detective (Boseman) who is thrust into a citywide manhunt for a cop killer. Simmons was also seen in Jason Reitman’s “The Front Runner” with Hugh Jackman and Vera Farmiga. He was recently seen in Universal’s thriller “The Snowman” with Michael Fassbender and Rebecca Ferguson and the Warner Bros. comedy “Father Figures” with Owen Wilson and Ed Helms.  In 2017, he was seen in the highly anticipated “Justice League” where he portrayed the iconic ‘Commissioner Gordon.’  

In 2016, Simmons voiced the character of Kai in Dreamworks’ highly anticipated “Kung Fu Panda 3” that released in January and voiced the character of ‘Mayor Leodore Lionheart’ in Disney’s “Zootopia” which released in March. Also in 2016, Simmons was seen in Sony Pictures Classics “The Meddler” with Susan Sarandon and Rose Byrne and Gavin O’Connor’s “The Accountant” with Ben Affleck and Anna Kendrick. Simmons also portrayed the real-life hero Jeff Pugliese in the 2016 Boston marathon film “Patriot’s Day” directed by Peter Berg. That same year Simmons completed production on an independent film entitled “I’m Not Here” which was directed by his wife Michelle Schumacher.  

He is known for playing the character J. Jonah Jameson in Sam Raimi’s “Spider Man” trilogy and memorably, his portrayal of the off-beat but not deadbeat father, Mac McGuff, in the hit comedy “Juno.” 

Past projects include “Terminator: Genisys,” “Jobs,” “Labor Day,” “The Words,” “The Music Never Stopped,” “Jennifer’s Body,” “Extract,” “The Vicious Kind,” “I Love You Man,” “Beginner’s Guide to Endings,” “Contraband,” “Hidalgo,” “The Ladykillers,” “The Mexican,” “Off the Map,” “For Love of the Game,” “The Gift,” “Thank You for Smoking,” “Rendition,” “Burn After Reading” and the Academy Award-nominated “Up in the Air.” 

On the small screen, Simmons played LAPD Assistant Chief Will Pope in TNT’s hit series “The Closer.” He also played Vern Schillinger on HBO’s acclaimed drama “Oz,” and had a recurring role as Dr. Emil Skoda on NBC’s “Law & Order.” He has had guest starring roles on NBC’s “Parks and Recreation,” and a recurring role on TBS’ hit comedy “Men at Work.” Simmons has appeared on the Broadway stage in performances of “Guys and Dolls,” “Laughter on the 23rd Floor,” “A Change in the Heir,” “Peter Pan” and “A Few Good Men.”  J.K. Simmons is repped by Gersh. 

Mena was born in Cairo, Egypt and raised in Markham, Ontario, Canada. He attended the University of Toronto for Neuroscience before transferring to Ryerson University’s notable theater program and graduating with a BFA in acting. He got his first big break starring in ABC Spark & Teen Nick’s mystery-drama television series “Open Heart” as “Jared Malik.”

After several years of acting in high-profile television and film projects, Massoud went on to star as “Tarek Kassar” in the highly-anticipated series “Tom Clancy’s Jack Ryan”.

In 2018 it was announced that, after an extensive worldwide search and multiple auditions, he had landed the coveted role of “Aladdin” in the Disney live-action remake of “Aladdin,” directed by Guy Ritchie. After leading “Aladdin” to the highly coveted $1 Billion Dollar mark at the box office, Massoud went on to star in Netflix’s “The Royal Treatment” which became its #1 film worldwide for several weeks in a row in 2022.

Mena’s banner Press Play Productions was set up to address a growing need for diverse stories and content, particularly from the MENA region, which comprises fast-growing entertainment industries. The international expansion of streaming services such as Netflix into MENA has provided more commissioning opportunities for companies like Press Play. Mena Massoud is repped by LINK Entertainment, Gersh and Hensen, Jacobson, Teller & Hoberman.

For the Silo, Lon Haber.

Canadian Actor Relished Role In Fan Made Series Star Trek Continues

CAS ANVAR RELISHES HIS “VULCULAN” ROLE- Silver screen and small screen actor Cas Anvar couldn’t believe he was stepping onto a soundstage in a STAR TREK CONTINUES  episode when he first emerged in costume as Sentek in Episode 10 (“To Boldly Go: Part I”).

After playing opposite Ben Affleck in Argo, an Oscar winner for Best Picture, Anvar has stayed busy with Hollywood in film and TV roles in productions like the Princess Diana biopic Diana, the sci-fi adventure Source Code and suspense thriller The Factory. He has also appeared in Steve Spielberg’s The Terminal and then there’s a long list of TV roles on Anvar’s resume, including appearances on NCIS:LA, In Plain Sight, Boston Legal, Castle, and 24.

But to emerge in full Romulan garb on a planet set in rural Georgia? That was one of his personal career highlights – so far.

“On my very first scene, they brought me to the planet set. And it was amazing. I’d never really seen a real STAR TREK set before. You don’t realize how those sets were constructed back then. This thing was so authentic with its fake boulders and sparkly mineral dust and the elevator on the surface of the planet. Then I had my first exposure to holding a disruptor and doing the big fight scene. It was everything you’ve ever imagined when you watch STAR TREK!”

Cas Anvar Anvar is a Canadian born and trained actor whose big break came with his role 2003’s Shattered Glass with Hayden Christiansen, and his professional career began following graduation from Canada’s prestigious National Theatre School. Anvar is also a well-known voice actor, whose talents can be heard in some of the world’s most popular video games (including Call of Duty: BO2, Halo 4, and Assassins Creed: Revelations.)
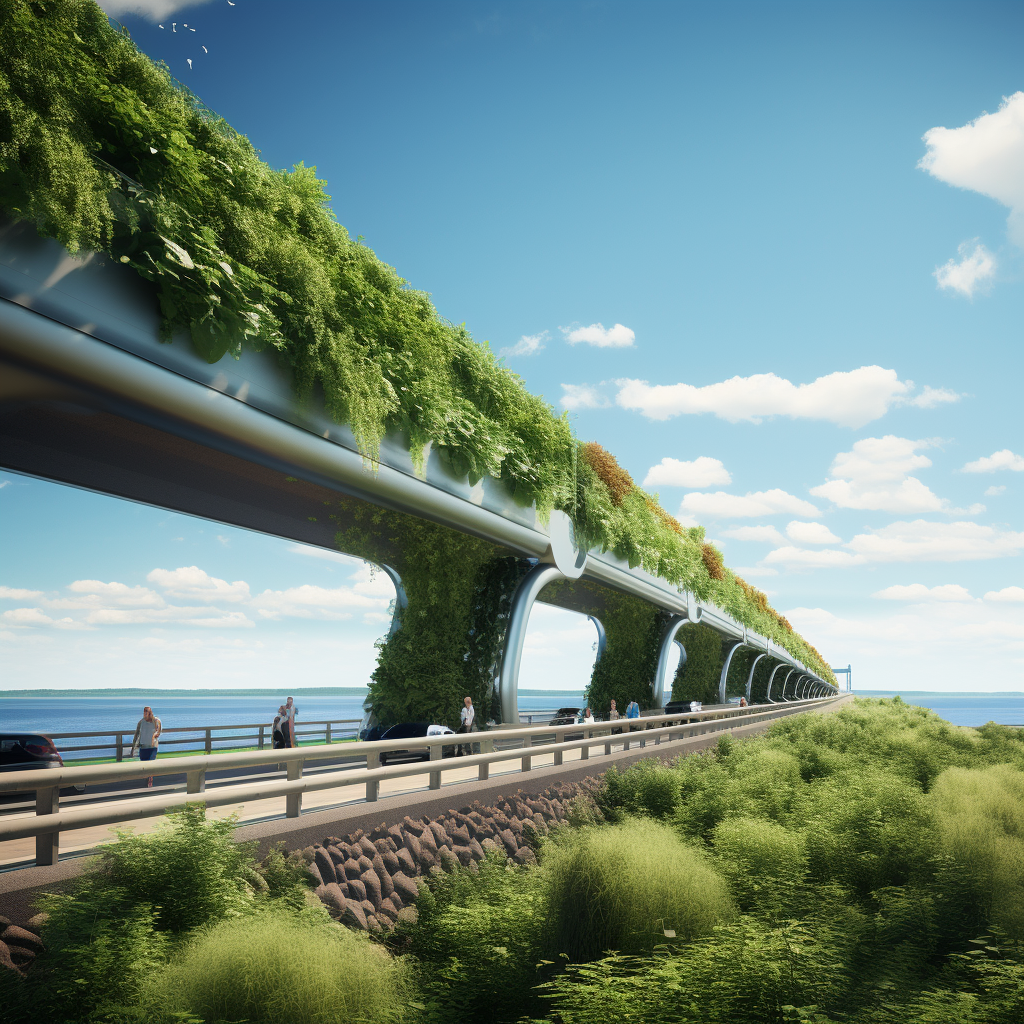
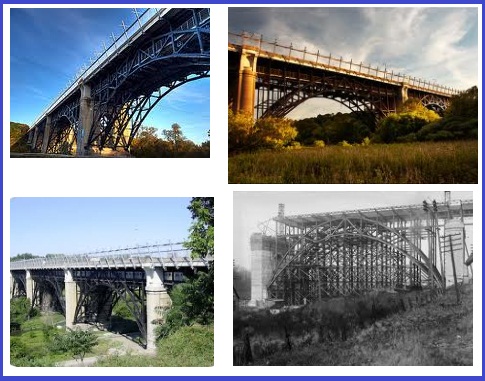
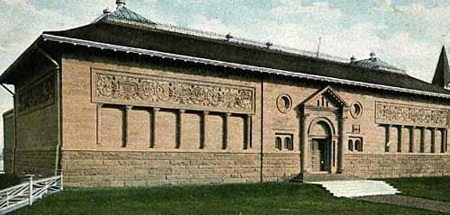
As a voice actor, he was familiar with STAR TREK CONTINUES executive producer Vic Mignogna. Anvar learned about the opportunity to join the cast as a guest star following a fortuitous meeting with STC director James Kerwin and through a connection with STC make-up artist Lisa Hansell.

“I’d been exposed to STAR TREK CONTINUES before I found out about the opportunity to participate. Their reputation was very high, and the production really is amazingly impressive and very high quality. I like the way STC uses technology to make it possible to produce ‘new’ episodes of The Original Series without losing authenticity,” Anvar said.

Anvar is a fan of all flavors of STAR TREK, noting that “there’s not one that I’ve missed. I’m a Roddenberry fan – a fan of the universe that he created. But each of the STAR TREK series is like a movement in a symphony. Each one has a place and a purpose and its own unique flavor.”

The “Vulculan”

To prepare for the role of Sentek (“I call him a ‘Vulculan,” says Anvar), he thought about what would be required for a cool and collected Vulcan to appear as a hot-headed Romulan.

Cas Anvar in makeup chair for Star Trek Continues

“This is a character who grew up on Vulcan with emotional suppression. And he’s masquerading as a Romulan, who is much more emotional and volatile. So how does this character allow himself to pass as a Romulan? He has to behave in a way that is a little less Vulcan, trying to find the balance. You have a lot of imagery and a wealth of knowledge of Vulcans by watching Leonard Nimoy as Spock. Of course, Sentek was performing in a very non-Vulcan way. That made for an interesting challenge to try to figure out how he could rationalize such impulsive and dangerous behavior. It was fun to figure it out.”

In the Steps of Bill Shatner

“I studied psychology and sciences at McGill, and I think Bill Shatner did as well. He started in theater and did some Shakespeare, and of course everyone knew that he was an alumnus of the school. He went on to perform at Stratford in Toronto.”

That connection to Shakespeare proved very fortuitous.

Christopher Plummer as Star Trek villain Chang

“I actually got Bill Shatner to endorse a fundraising effort for a Shakespeare campaign, along with Christopher Plummer (an honorary McGill graduate.) Both of these famous actors came from my hometown. But after 9/11, our Shakespeare company had a financial problem. These great actors were sympathetic and helped us raise the money we needed. Later, of course, I also worked with Shatner on Boston Legal and saw him as the incredible Denny Crane.”

“Honestly, it was a surreal experience. Ever since I was a kid I wanted to be on STAR TREK and play some sort of an alien – ever since I was a kid. To getting to realize that dream was exciting,” Anvar says.

Supplemental-
Questions & Answers with STC Director James Kerwin

How did you get involved with STC and express your interest in directing an episode — something that led to directing several episodes?

I’d known Vic Mignogna for several years, and cast him in a short film I directed. While we were on set, he mentioned that he was producing a STAR TREK fan series, and asked me to check out “Pilgrim of Eternity.” To be honest, I was wary at first. Although I wasn’t very familiar with fan films, those which I’d happened to catch ranged from great to amateur, from a production perspective. That’s not a “knock” at all — God bless anyone with the gumption to make a fan film. So Vic opened his laptop and said “Just watch.” I did, and I was hooked! The production value was top-notch.

While we were in post-production on the short, Vic mentioned that he was thinking about doing a “Mirror Universe” story for STC episode 3, and asked me if I’d like to come aboard. I was drawn in by his overall goal and philosophy for the show: namely, to produce a Trek webseries made by fans who also happened to be film and TV industry professionals, both behind the camera and in front of it… professionals who agreed to set their busy schedules aside, without fame or financial incentives, to express their love of TOS and share it with the world. So we tossed around a couple plot ideas, but ultimately felt that his initial instinct — to do a fast-paced story that picks up moments after “Mirror, Mirror” and explores Spock’s immediate actions — was the strongest. The rest is history.

That episode still holds a special place in my heart because it was my first — and the Mirror Universe is just so much fun! Wired came to set for that one and shot “behind-the-scenes” footage of the project; I encourage everyone to check that out as well:

I assumed “Fairest of Them All” would be my sole trip on the TOS Enterprise… but a few months later, Vic asked if I’d be interested in coming back to direct episode 4. At that point, I needed to make a decision as to whether I’d be willing to set aside my career for a couple years to focus on STC, because writing and directing episodes isn’t a part-time job. It wasn’t a difficult decision, simply because this entire endeavor was so rewarding!

After “The White Iris,” I settled in as the series’ “story editor” — that’s the person who works creatively with the showrunner (executive producer) to decide on overall storylines and which scripts to produce. I eventually became a co-producer (and later producer) on the show. In addition to directing and/or co-writing most of the episodes, it was necessary for me to work in post as well, helping Vic decide on music and sound cues, etc. I performed what’s called the “online edit” — I took Vic’s cut of each episode and readied it for color grading by our cinematographer Matt Bucy — and then performed the “DI conform” after the graded footage was returned. That involved adding film grain, comping in ungraded opticals (i.e., viewscreen shots), and even adding “judder” to the end titles to simulate the 1969 optical film printing process. I also scheduled shoots, helped Lisa Hansell and Linda Zaruches with some of the social media and publicity, cut together “blooper” reels, and authored the DVDs and Blu-ray discs. But my focus remained primarily on directing. I’m quite proud of what we accomplished, needless to say!

How do you describe the role and activity of a director to someone not familiar with filmmaking. In other words, what does a director do?

The director makes the creative decisions about what’s seen on-screen. He or she works with the actors to craft performances, and composes the shots (i.e., collaborates with the director of photography to determine camera angles, lighting, etc.). The overall “feel” and “pace” of the piece is the responsibility of the director.

Now, there are significant differences between directing for film — which was my primary background before STC — and directing for series television. On a film, the director is usually “top dog,” so to speak. The buck stops with him or her. He or she establishes the overall vision and style of the movie, from the broad strokes to the finest details. That involves making decisions in every department — makeup, costumes, art / set design, sound, camera, lighting, acting, editing, music. A film director is basically the general in charge of a large army. It requires a lot of pre-planning; and that involves everything from casting roles to storyboarding (drawing) shots to making judgment calls on wardrobe. Time is money when you’re on-set or on-location, and — while it’s important to be malleable and be able to think on one’s feet — films ultimately run much more smoothly if the director has pre-visualized everything (either on paper, digitally/virtually using pre-vis software, or even simply in his/her mind). Films involve large crews and complex camera moves, lighting, and shot composition. One typically shoots about 2 or 3 script pages a day on a feature or short — and even that is pushing the limits at times. A theatrical film can have a shooting schedule anywhere from a few weeks to a few months.

Directing for TV is rather different. By the time a director comes onto a series, many of the creative decisions have already been made: primary cast, sets, costumes, and — perhaps most importantly — the overall “style” and “feel” of both the camerawork and the actors’ performances. With few exceptions, most series have multiple directors, and each one can’t bring his/her own personal vision to the table — you’d have a show that looks totally different from one episode to the next! That’s why, in TV, the executive producer is ultimately in charge. Individual directors must conform their styles to the overall vision of the showrunner. In the case of STC, I also had to honor the rich legacy of TOS, and shoot the episodes in a style reminiscent of 1969 network television. So a lot of my 21st-century directorial instincts had to “take a back seat” in order to serve the overall series. On top of that, unlike films, a television episode has a much quicker production schedule. On STC, we usually shot 5 or 6 pages a day — sometimes even 7 or more! That’s definitely a challenge to pull off.

How does the all-volunteer aspect of a fan production like STC make things more difficult — or easier — for a director?

Fortunately, on STC, our so-called “above the line” positions (main cast and guest stars, producers, writers, directors) and our primary department heads had a lot of experience working in film and/or television, and that helped tremendously. I didn’t have to “reinvent the wheel” or show people the ropes.

That cut both ways, though. Since we were dealing with working industry pros, getting everyone together on a volunteer basis was often quite difficult. For example, unlike a “normal” series, we didn’t have the luxury of putting our main cast under series-regular contracts. So if certain actors were working on another film or TV series at any given time, we either couldn’t film during those weeks, or I’d have to shoot “around” their absence. Same thing for our behind-the-scenes crew.

Plus, understandably, we just didn’t have the budget to put our people up in hotels in Georgia — and feed them — for weeks on end. So our production schedule was often pretty tight. The more script pages one must shoot per day, the more stress one is under. There’s no way to avoid that. I suppose that having a background in indie film — where one often must work with lower budgets and tighter schedules — helped me cope!

Ultimately, though, having people who came together out of love for the material was a huge plus. Our team members were all motivated to do their best work, simply because that’s why they were there. And every night after photography, we’d all go out for dinner and drinks together. It really was a family… and one that I already miss.

What are some of the films and television series which influence you as a director?

I think Kubrick is probably my all-time hero. I love the specificity and patience of his films, and how his composition and pacing both inform and reflect his actors’ performances. 2001 is wonderful. I also love both Blade Runner movies, Solaris… but in addition, I have a soft spot for the late-60s aesthetic. The early Bond films, Flint, Barbarella… there’s a fun, sexy style there that we don’t see often any longer. As for television, I thought Ronald D. Moore’s version of Battlestar Galactica was wonderful. And there’s so much great content on right now. Black Mirror, for example. And Mr. Robot just blows me away.

What’s your background, and what are you doing professionally now that STC has finished its final episode?

Growing up, I used to make Doctor Who fan films and amateur movies with our family’s old video camera. If I was assigned to do a term paper, rather than writing a boring old report, I’d shoot it as a narrative film! So it was probably around high school when I first started thinking seriously about a career in directing. I also had — and still have — a passion for cosmology, so I was a bit indecisive. I went to T.C.U. in Dallas / Fort Worth, and started a double-major… but when I realized I’d be in college for many, many years, I ultimately decided to focus on filmmaking (although I did earn a minor degree in astrophysics). My student thesis film wound up winning a first-place Telly Award, so I stayed in Texas for a few years after that, directing shorts, music videos for local bands, etc.

When one of my films started to make a splash on the festival circuit, an assistant agent at talent agency APA offered to rep me, and I moved to Los Angeles. When I first got here, I wound up falling into a lot of stage directing, both classical and modern — which was unusual for me because I had relatively little background in live theatre at the time. But it’s an amazing process, and very different from filmmaking. My work at the Blank Theatre Company in Hollywood — a wonderful venue run by Daniel Henning and Noah Wyle — gave me a lot of “in the field” experience with actors, including many accomplished television and film veterans who’ve retained their passion for live theatre despite their on-screen success.

Ultimately, though, film is my first love, and I was fortunate to get the opportunity to direct a cerebral science fiction noir feature for Entertainment One studios called Yesterday Was a Lie (www.yesterdaywasalie.com), starring Kipleigh Brown as well as Chase Masterson from STAR TREK: Deep Space Nine. After YWAL, we started working on a film based on the science fiction Czech play R.U.R. from 1919. We originally shot a short (www.rurfilm.com) loosely based on the story — that’s where Vic and I first connected re: STC — and we’re developing it into a high-concept feature set in an alt-history, late-60s world. And Kipleigh and I have a couple other things in the works as well. But immediately next for both of us (as well as for Vic and Lisa) is a short psychological character drama called When the Train Stops — also starring Trek actors Michael Forest and John de Lancie. Lisa’s producing, and she did an excellent job successfully crowdfunding the film. We’ll be shooting in 2018, and I’m very much looking forward to it!

Website: www.jameskerwin.com
Twitter: @jameskerwin
Facebook: /jameskerwin

Supplemental-

A Profile with Producer and Make-Up Supervisor Lisa Hansell
How did you get involved with STC, and how did that relationship grow to be more than providing make-up services?

Once upon a time, August of 2012 actually, I was in the process of turning Tim Russ into Tuvok when this guy named Vic Mignogna walked in. We were introduced, exchanged pleasantries and went about our business. At the end of the day, he asked for my business card. The very next day, he called and asked to have lunch to discuss a project he was launching.

Over lunch, he began to explain his vision for STAR TREK CONTINUES. His excitement for STC was palpable, and we established that we both dearly loved STAR TREK and had been lifelong fans. Now, I have been a professional in the entertainment industry for years and had been pitched “passion projects” many times (read: no pay). I had to turn them down because my bills don’t get paid with “great opportunities for exposure,” but this felt different somehow…special. Vic’s passion was contagious!

In The Beginning, there weren’t very many people on board, but all the usual pre-production details needed to be handled. Vic was trying to do it all himself, so I volunteered to take over social media for starters and helped source costumes for our first shoot, which was the final scene for “Pilgrim of Eternity.” There were a million details to take care of, and I offered to help share the load. Over time, this deepened my friendship with Vic and my involvement with STC. I have given input on script and story development (the ending for “Lolani” was my idea, for example), wardrobe choices, sound design, etc. I did whatever needed to be done without regard to whether or not it was “my department” all for love of the project.

What are some of the challenges you faced as Makeup Supervisor on STC?

Of course, the whole series was a period piece with the goal of recreating the look and feel of late 1960’s STAR TREK. They used heavier, more theatrical makeup back in the day, but we were shooting in HD which is much less forgiving than film. Finding a balance of makeup looks that would fit the period and yet not be distractingly obvious was not an easy task!

Several episodes brought their own unique challenges, which I LOVE! In Episode 1 we had to vary the age appearance of Apollo several times throughout the story. Episode 2 was a LOT of green for our Orions, and that green had to be something that wouldn’t transfer onto costumes, props and sets. We custom mixed something called PAX, which is a combination of medical grade adhesive and acrylic color. Consequently, it was very time consuming to apply and remove. Episode 3 was all about recreating every character’s look from “Mirror, Mirror.” In Episode 4, we recreated three known loves from Kirk’s past.

Then there was Episode 8. The ‘Old Kirk’ prosthetic makeup was equal parts long, hard work and a lot of fun! Special effects makeup is my absolute favorite thing because I get to watch the actor use my work to enhance and inform their performance. Episode 9 was a color theory workout! I tested many color combinations for our guests stars before settling on schemes that would read ‘normal’ in black and white and not look completely ridiculous in color. Me to Vic: “I can’t have our guest stars looking like a bowl of hard candies.” For our finale episodes, I got to create an Andorian and…Romulans! So many pointed eartips…glorious! I’m incredibly proud of the work my team and I did throughout the series.

What’s involved in being the Social Media Manager and keeping people informed about STC activities – on Facebook and otherwise?

I could really write a novel here, but I’ll try to summarize. Our main Facebook fan page has grown to nearly 200K “Likes,” and our Facebook Group now has 14.5K members. We have a Twitter following of nearly 22K and 4.5K on Instagram. That’s a lot of eyeballs on our activities! For our main Facebook page, I have an angel volunteer named Linda (I LOVE you, Linda!) who combs through our behind-the-scenes photos and schedules out a ton of posts. I go in daily and check through them, tag people, monitor comments, etc. I check in on the group, and the other platforms several times a day, and have done so every day for the last 5 years.

Social media really is our main liaison with our fans, which is incredibly important. Early on, I wanted to establish a ‘voice’ for STC that included professionalism, class, courtesy, enthusiasm and the principles of IDIC. How STC is perceived is extremely important to me because I believe it reflects on everyone involved – on our family – so I’m very protective of it. I have been so gratified when hearing from fans that we have achieved an excellent public perception.

Vic consults with James Kerwin and myself pretty much daily on STC activities and decisions that he has to make regarding the direction of the production. You could say James and I are the “Bones” and “Spock” to his “Kirk” off-screen. Ha! (We’ve had a group Facebook chat going since episode 4!) Whenever we have an event coming up, we three hash out the plan of execution and release, Take our Christmas gift of downloads for the fans, for example. That has been in the works for months! Then it’s all about choosing the right wording, imagery, etc., and coordinating the exact date and time of release so that it happens as seamlessly as possible.

I’m sure you’ve been touched by the stories that people have told about how STC has affected them. What are a couple of examples that really stand out?

I’m always thrilled to hear stories about STC bringing people together. Parents and children reconnecting to watch new Star Trek episodes like they did years ago, or fans who may no longer have that parent around but can feel their presence each time they watch STC are some of my favorites.

I have to say, though, that the messages and emails I received after “Come Not Between the Dragons” were the most profoundly moving. We had adults who were abused as children write in to say that they were able to heal and let go of the anger they had harbored for years against an abuser who had long since passed. We even had abusers write to us and tell us they finally saw themselves through their children’s frightened eyes and vowed to change – to break the cycle. We never could have imagined having the affect we have had on some of our fans, and I find it profoundly humbling to be a part of something that could invoke that in others.

Is working on STC like working on other fan productions?

There are similarities in that almost any fan production is driven by a passion and love for the source material. I have very much enjoyed working on other things and have made lifelong friendships as a result.

That said, STC is unlike any other production I’ve worked on, fan or otherwise. I’ve been fortunate enough to work on quite a few films that were filled with wonderful professionals who’ve become friends and had a fantastic time doing it, but STC is very different. Everyone is doing it for love and not for money. When you’re pouring your heart into something vs waiting for a paycheck, it shows!

Also, from very early on I have had a much deeper involvement with STC than on most other productions. As a producer, I have input on the final product that I wouldn’t normally have as a makeup artist, and I find that I am much more invested as a result. This has moved me to pursue more of an active role in producing other things as well, because I enjoy being a part of the creative team for the whole project and not just for one department.

When you look back on your experiences with STC, what has been most personally rewarding?

I would have to say that the relationships I’ve built with the cast and crew of STC are #1 for me. We throw the word “family” around a lot, but there just isn’t a better word for it. I deeply and sincerely LOVE each and every one of the crazy nerds on our team, and I know that is for life – there’s no question in my mind. This is my ‘chosen’ family.

A close second would have to be the chance to spend so much time living INSIDE my lifelong love of Star Trek. I’ve walked the corridor of the Enterprise. I’ve sat in the Captain’s chair, stared into Spock’s scanner, dusted the table in Kirk’s quarters, climbed the ladder in engineering and even got to ‘drive the ship’ in a couple of episodes. I’ve napped in sickbay, on the transporter pad, in a turbolift, and in the warp core (yes, really)! I’ve stood at the monitor watching new STAR TREK being created before my very eyes. It doesn’t get any better than that!

What’s your background in the entertainment world, and what’s next on your professional horizon?

I began doing special effects and beauty makeup 11 years ago. I’ve worked on everything from micro budget independent films to multi-million dollar theatrically released features. I’ve worked with names like Ed Begely, Jr., Sean Young, Eric Roberts, Martin Kove…and I absolutely love what I do. The artistry of it combined with storytelling is what I find most compelling.

I’m currently in pre-production on a short film with some STC alumni. The film is called When the Train Stops, and it stars John de Lancie, Michael Forest, Vic Mignogna, Kipleigh Brown, and my dear friend Darren Jacobs. Darren is a Shakespearean Theater-trained actor whose talent always blows me away. I can’t wait for you to see him in action! Of course, our readers already know what brilliance the rest of the cast is capable of. I’m excited to also bring back Emie Morissette, who you will recognize as the relief navigator from STC’s finale episodes.

The film will be directed by our very own James Kerwin, and I’m producing it. It’s a drama with a twist – think Twilight Zone. We will no doubt bring on more STC folks as we get closer to production and start filling out the crew. When you find your “A” team for filmmaking, why look any further! You can check out our website for more info: www.whenthetrainstops.com

In closing, I’d like to thank Vic for bringing me aboard this wonderful journey. His vision gave birth to STC, and my time working on it has truly been one of the most memorable and remarkable experiences of my life. Thank you, Vic, for being a wonderfully insane geek to the extent that you created this beloved masterpiece, and for letting me play on your starship! It was a great ride…

Frequently Asked STC Questions
Weren’t you going to make 13 episodes? Did CBS make you stop?

CBS is not responsible for the decision to end the series. We are doing 11 episodes instead of 13 because another fan group took advantage of the good graces of the copyright holders forcing them to protect their property and the interests of their license holders. In deference and gratitude to CBS, we wrapped up earlier than planned and are very proud of what we’ve accomplished.

What will happen to the studio/sets? Will set visits/tours be available?

We don’t have a definitive answer on this right now, but we’re considering all our options.

So, you can’t make more full-length episodes due to the guidelines, but can you make more vignettes?

Yes, short films are allowed by CBS’s guidelines, but the run time is not the only limitation that would preclude us from continuing. We finished our mission and are grateful to have been able to do so.

How about making some other fan film (Firefly, Battlestar Galactica, Lost in Space, etc?)

STC was born from Vic Mignogna’s love of STAR TREK and not any other franchise. It’s the kind of love required to do this kind of work for 5 years for free. While the other shows are favorites, they aren’t “devote-5-years-of-your-life” favorites!

You Need To Protect Yourself From Germs At The Gym

The gym is a haven for germs.

Members are sweating and breathing hard over the equipment, only wiping it down quickly with a strip of paper towel — if they remember to wipe it down at all. To make sure you stay healthy every time you go for a workout, you should read these tips to protect yourself.

Wash Your Fitness Gear

Before you worry about the treadmills and locker rooms, you need to take a look at your gym bag. You could be harboring bacteria and germs in your athletic gear.

Moisture and bacteria will build up in your gym shoes, especially if you only wear one pair. This situation can lead to powerful foot odor, along with frustrating problems like foot fungus, toe fungus and blisters. Swap your shoes after every use to let them dry out. If you’ve been using the shoes for a while, you should replace the old dirty insoles. Click here to see where you can get custom orthotics in Toronto so that you can get the perfect fit for these supportive accessories.

Don’t re-wear clothes after a workout. Even if you think you didn’t sweat much, you should clean them. When you put those dirty clothes into the washing machine, toss your gym bag in there, too.

Wipe down Gym Equipment

If you think your equipment is dirty, just imagine what lies on the gym’s equipment. People have been touching it and sweating on it day-in and day-out, and you can’t be sure if they’ve been kind enough to clean up after themselves.

If you’re worried about getting sick, the microbiologist Jason Tetro recommends that anyone using gym equipment follows these simple rules to avoid bacteria and viruses:

  • Shower before and after the workout
  • Take 15 seconds to wipe down equipment before and after using it
  • Wash your hands often
  • Don’t touch your mouth or face

Don’t Go Barefoot

You need to wear shower shoes when you go into damp areas like the swimming pool deck, the locker room, the sauna, and, of course, the showers. These floors are covered with germs. The protective footwear will keep you from picking up an embarrassing infection like athlete’s foot or plantar warts.

You can get the same foot conditions from a borrowed yoga mat because people like to practice in their bare feet and they often forget to clean the material when they’re done using it. You should wipe down a borrowed mat before and after your yoga classes and use grippy socks as protective barriers. Better yet, buy your own mat and bring it from home.

Avoid gym mat germs.

These are all ways that you can protect yourself from germs at the gym. Luckily, they’re also ways that you can stop everyone else from catching a virus or bacterial infection. By cleaning up after yourself, you’ve given other members a better chance of staying healthy, too.

You should always avoid the gym when you’re not feeling well. Don’t push yourself to go for a jog or to do a round of sun salutations when you have the sniffles. Your determination to fight your illness and fit in a workout can make other members sick.

Canada’s Changing Climate: What Key Cities Could Look Like With ‘Dune-Ification’

How Climate Change Could Transform Cities into a Dune-Like Landscape

Dune’s cinematic and literary success reflects our fascination with desert landscapes. But the vast deserts of Arrakis, the movie’s fictional planet, hold a deeper meaning. They serve as a cautionary tale for our own planet threatened by desertification.

A new study by our friends at Top10Casinos.ca reveals how Canadian and other global cities threatened by climate change would look in the Dune Universe as TikTok searches around Dune: Part Two and climate change spike 7,700% in just 30 days.

Dune: Part Two, is already reaching massive box office milestones surpassing $150 million usd/ $204 million cad, and TikTok searches for the ‘new dune movie’ have soared 4,606% in just 30 days. In the past month, searches around the movie’s desert-like filming locations have increased 141%, while queries related to ‘climate crisis 2024’ have spiked 3,100% in the social media platform.

Known for its amazing cinematography and striking desert visuals, Dune’s landscape is something that makes it instantly recognisable. But the movie’s vast deserts are more than just a stunning backdrop. They serve as a stark warning of a potential future for our own world impacted by climate change.

Do Canada’s iconic outdoor skating rinks face a frosty future? While bundling up for harsh winters is a national pastime, a worrying trend is emerging. Since 1950, winter temperatures have soared by over 3°C, outpacing global warming by a factor of three.

Toronto, Ontario

Toronto, once known for its predictable seasons, is grappling with the impacts of climate change. The city is experiencing a rise in average temperatures, leading to more frequent and intense heat waves that strain infrastructure and threaten public health. Winters are becoming shorter and less severe, with unpredictable precipitation patterns bringing both heavier downpours that overwhelm storm drains and periods of drought that stress green spaces and water resources.toronto desertified

Vancouver. British Columbia

Like many coastal, seaport cities, Vancouver is feeling the brunt of climate change. Rising temperatures are a key concern, with projections for hotter, drier summers and wetter winters. Sea levels are also on the rise, threatening coastal areas with flooding. The City of Vancouver itself is planning for up to a 1.4 meter rise by 2100, which would inundate parts of the city during major storms.vancouver desertified

Montreal, Quebec

Montreal’s climate is expected to experience significant changes due to climate change. Average temperatures are projected to rise by 1.5-2.3°C by mid-century, leading to more frequent and intense heat waves. This can strain infrastructure, harm public health, and disrupt outdoor activities. The city is also likely to see increased precipitation extremes, with heavier rainfall events and the potential for more flooding.montreal desertifiedmontreal desertified

Niagara Falls, Ontario

Studies suggest Lakes Erie and Ontario, feeding the Niagara River, could see water levels drop a meter by 2050 due to increased evaporation and less snowfall. This decline could impact the Falls’ power and beauty. Additionally, more extreme weather events like flooding could damage surrounding areas. While milder winters might extend tourism, climate change poses significant ecological and aesthetic challenges.niagara desertified

Methodology

Top 10 Casinos Logo

AI Predicts Canada Tourist Spots After 100 Years Climate Change

Whilst climate change is at the forefront of most countries’ consciences, the issue is highly pressing here in Canada where we  experience climate change at twice the world’s average due to our northerly location. Do you believe in the stated extreme effects of climate change or do you believe in a milder alternative? We would love to hear your thoughts in the comment section at the bottom of this article.

With this in mind, our friends at BonusFinder Canada utilized technology to predict exactly what Canada’s most popular tourist spots could look like in 100 years time if we do not intervene and try to combat climate change. To do so, they asked OpenAI to write predictions for five top tourist hotspots (Niagara Falls, CN Tower, Notre-Dame Basilica, Hopewell Rocks, Confederation Bridge) based on factors such as global warming, overpopulation and extreme weather, and used these descriptions to generate AI images.

Niagara Falls – no intervention  

 Niagara Falls – positive intervention

Key changes without intervention:

●      Significant reduction in water flow, affecting local ecosystems and the availability of freshwater resources.

●      The falls are no longer safe to get close to due to erosion.

●      The once lush surroundings have been replaced by concrete and pollution due to overpopulation.

CN Tower – no intervention    

CN Tower – positive intervention

Key changes without intervention:

●      Toronto is now largely inhospitable due to global warming and extreme weather events.

●      Fires are not uncommon due to global warming and an abundance of refuse.

●      Toronto faces major impacts of climate change, including higher temperatures, reduced air quality, and persistent heatwaves.

Notre-Dame Basilica – no intervention 

Notre-Dame Basilica – positive intervention

Key changes without intervention:

●      Extreme weather events, including severe heatwaves, have damaged the Basilica’s exterior and interior.

●      The area surrounding the Basilica is overpopulated and increasingly inhospitable.

●      The basilica remains heavily reliant on non-renewable energy sources, worsening the effects on the environment.

Hopewell Rocks – no intervention 

Hopewell Rocks – positive intervention

Key changes without intervention:

●      The main structure of the rocks has collapsed.

●      The surrounding area is heavily urbanized and polluted.

●      The beach is now dangerous, marshy and overgrown, but still attracts many tourists when the bay is uncovered, bringing further pollution and structural damage with each passing year.

Confederation Bridge – no intervention

Confederation Bridge – positive intervention

Key changes without intervention:

●      Confederation Bridge has collapsed in areas, rendering the huge structure unusable.

●      The water around the bridge is now full of concrete, industrial waste, pollution and urban runoff.

●      Small portions of the bridge still stand in the water, serving as a reminder of our failure to act and combat urbanization and overpopulation.

For the Silo, Clara Tan.

The Airy Mesh Dress For Beating Upcoming Summer Heat

As we all prep for the heat, we’re looking for all things mesh and breezy to stay cool.

Londre Bodywear just launched The Airy Mesh Dress with bell sleeves and a mock neck made sustainably from water bottles.

The fine mesh material comes in white, navy and black to pair over your favorite swim or to sport on the streets to beat the New York City or Toronto City heat! Pieces are currently available on LondreBodywear.com (Affiliated on ShareaSale) ranging from sizes XS-4XL priced at $118usd / 159$cad. For the Silo, Melissa Nicholls/Michele Marie.

Defoy At Heart Of Official Quebec Antique Dealer Route

“It’s the tiny town of Defoy. Only a gravel road from the main highway, but about a half a mile down there is the wonderful “antiques dump” of Rene Boudin and his freres.” photos: P. Ross

By the winter of 1982, we had been going to the Harbourfront Antique market every Sunday for about a year, and were making a pretty good living selling things we had bought at local auctions and garage sales. Then one day, I read in the excellent and entertaining “bible” of Antique dealing The Furniture Doctor” by George Grotz ,  that the village of Defoy, Quebec was mecca for the antique picker.

To quote “there’s a wonderful secret wholesale place up in the province of Quebec. It’s the tiny town of Defoy. Only a gravel road from the main highway, but about a half a mile down there is the wonderful “antiques dump” of Rene Boudin and his freres. And here under enormous sheds you will find literally acres of antique furniture, chests, and tables piled three to five pieces high”.

“…it wasn’t hard to find because it was near town, and his name was painted boldly on the barn.”

https://goo.gl/maps/ZhW6d7x5Z72G7buz6?coh=178572&entry=tt

The book had been out quite awhile so there was no telling if this situation still existed, so I asked the old guys at the market if they knew of such a place. I got several reports of it’s glory days, followed by “of course that was years ago and nobody goes anymore. That being said they also all encouraged me to give it a go, and gave me “leads” as to who may still be active. We gathered up our courage, our baby, and what cash we had, and set off.

That first twelve hour drive felt like an eternity. It was a tired crew who pulled in late afternoon to a tiny motel in Victoriaville, Quebec.

Our first move was to look up Marcel Gosselin in the phone book because he was one of our most promising leads. To our delight he was listed, and he answered and told us where and how to come the next morning. It wasn’t hard to find because it was near town, and his name was painted boldly on the barn. Marcel greeted us warmly and proceeded to lead us to his main barn. There, behind the red and white cross doors was the biggest pile of dining chairs I had ever seen. About thirty feet across it reached to the top of the barn.

Through the hatch work of legs I could see tantalizing glimpses of a cupboard and some chests. Then he took us upstairs where in a loft he had sorted hundreds of chairs in sets of four, six, or more. Some were painted and some varnished. It was $45cdn each for simple painted chairs, $65cdn each for nicer pressbacks and/or varnished ones. We got a couple of sets knowing we would get about $150cdn-$250cdn each for these when refinished., Next I asked him about that cupboard I had seen in the giant pile downstairs. He told me all about it including the age, condition and reasonable price of $250cdn and told me he would extricate it and have it ready for my next trip if I wanted it.

I said I did, and then he didn’t even want a deposit.

“That’s not the way we do it down here. Your word is good enough, until it isn’t” Marcel (R) Phil (L)

“That’s not the way we do it down here. Your word is good enough, until it isn’t. I liked him immediately and knew he was a man I would enjoy doing business with.

Next he took us to the garage attached to his 100 year old frame house. The downstairs was filled with every kind of “smalls” including small boxes, glassware, pottery, antique clothing, folk art, etc, etc; and the tiny, about to collapse, upstairs loft was filled with hundreds of pottery washsets. There were some beauties, and this was a hot item at the time in Toronto. Prices ranged from $45cdn-$75cdn per set. We bought 8 of the nicest sets knowing we would get between $145cdn to $375cdn back home.

This was getting truly exciting.

We spent a terrific four hours or so with Marcel that first day and pulled away from his place, with half our money spent, and half our truck full of interesting, excellent quality, and reasonably priced stuff, not to mention the overwhelming sense of warmth, excitement and wonderment of that first glimpse into a Quebec picker’s life. We were hooked, and we knew it was the first of many more trips to see Marcel.  For the Silo, Phil Ross.

Featured image courtesy of tourismecentreduquebec.com     

Former Canadian Minister Of Defense Claimed UFOs Are Here

Some years ago, in 2015,  I spoke with Paul Hellyer the former Canadian minister of defense, who stated he believes UFOs are from another planet and that the U.S. Government has kept it covered up.

As Canadian Minister of National Defense in 1963, Hellyer was responsible for integrating and unifying the Royal Canadian army, navy and air force into a single organization, the Canadian Armed Forces.

He is outspoken about UFOs visiting Earth and the US Banking System that he feels is greatly responsible for the present economic hard times. He feels we are naive and fail to understand we are being visited by alien life forms.

https://www.tvo.org/video/archive/hon-paul-hellyer-on-ufos

He told me he had spoken with key US government officials who confirmed aliens are visiting us and providing advanced technology.

Light At The End Of The Tunnel Hellyer BookHis book, “Light at the End of the Tunnel: A Survival Plan for the Human Species” reveals that humans are hell bent for extinction unless we change our attitudes and actions with an urgency appropriate to an impending disaster. Paul Hellyer suggests that we have about ten years to wean ourselves from the oil economy and profoundly regrets that the Copenhagen Conference reflected little progress in that direction.

The whole atmosphere was one that reminded him of Emperor Nero fiddling while Rome burned. World leaders simply have to do better! The book outlines the three monumental changes required to accommodate the miracle. First, the book claims that exotic energy sources already exist. They have been developed by the U.S. “shadow government” at the massive underground “black operation” installations in Nevada and Arizona using technology borrowed from visitors from other planets. Yet they remain secret for the alleged benefit of the privileged few. Second, the money has to be found to subsidize poor nations and facilitate major changes. This can be accomplished by a fundamental re-working of the monetary and banking system. Bank leverages must be dramatically reduced and the percentage of virtual money they create as debt strictly limited so that governments can gain the financial flexibility to finance the transition to sustainability. Finally, it will be necessary for all countries, races, faiths and colors to drop their antagonisms and work together in common purpose to save the heritage they have in common.

When Hellyer was Canada’s Minister of National Defense he stated, “I got periodic reports on sightings and I looked at them very casually, and it was decided that about 80 percent of them were natural phenomena of one sort or another, and the other 20 percent roughly were unexplained, and therefore unidentified. While spending one Thanksgiving holiday north of Toronto, Hellyer and his wife spotted an UFO. “The two of us stood there transfixed for 20 minutes, looking up at this thing moving first in one direction, and then another. By process of elimination, we determined it wasn’t a star or satellite and it wasn’t the space station, so there was really no explanation for it other than it was, in fact, a UFO.”

“It looked like a star, but it maneuvered in a way that stars do not. I must admit that when I saw this one, I wondered whether it was extraterrestrial or American. And I guess the thought that occurred to me was that if it is American, then they have learned some pretty big secrets about acceleration, because it accelerated at a pace that nothing I’ve ever known about that was built here is capable of.”   For the Silo, George Filer.  Join MUFON.

Supplemental- renowned Scientist Stephen Hawking warns about the danger of Extra-terrestrials.

Toronto Streetcars: Historic And Relevant?

The 50’s!

I am sure that many of you will agree that the streetcars that rumbled through Toronto from 1800s until… let’s say 1990’s helped shape many neighborhood. They were the most effective way to connect Toronto’s core with its suburbs and greatly encouraged development of the communities as new grocery stores, restaurants, galleries, shops and banks as amenities have been built near the streetcar lines.

Standing in the middle of road, going nuts being stuck behind a streetcar, it is sometimes difficult to appreciate how important role they have played in the city’s history.

First Streetcars in Toronto

Inspired by the success of horse-drawn streetcars in the U.S., Alexander Easton’s Toronto Street Railway company started operating in 1861. New rail lines played a vital important role in connecting the city centre with its sleepy suburbs. What started as an enterprise with 6 miles of track and 11 cars, turned slowly into 68 miles of track with 361 street cars. The company expired in 1891 and the management was turned over to the Toronto Transit Commission (TTC).

From 3 cents to $3.25: a brief history of TTC fare hikes - Toronto |  Globalnews.ca

The next company to take control over the system was the Toronto Railway Company, under which first electric streetcars were introduced. All services were later taken over by the Toronto Transportation Commission, which was later renamed to the Toronto Transit Commission (TTC).

Building street car tracks on Bay St. Toronto circa 1918

However, even streetcars had their bad times. In the 1960s they were almost abandoned when people thought of it as an outdated mode of transportation. Thirty years later it fell upon hard times once again because of budget cuts, the recession and its inability to service the rapidly-growing parts of the city.

TTC lost $61M to fare evasion in 2018 - Trainsfare

It took months for the TTC to pull itself out of its bad times, but streetcars somehow managed to return back to their previous fame. Since then, the company’s services have been improving every year, but there are still some issues. Let’s take a look at the current state of the streetcar rail services in Toronto, its advantages and the most annoying faults.

The Ashbridges Bay street car line 1917.

Present

Although the number of streetcars crossing the city declined in the latter half of the 20th century, they never disappeared completely. In fact, streetcars have become a vital part of Toronto’s history and nearly every citizen’s life. Nowadays, the city owns 247 streetcars, of which 52 are higher-capacity articulated streetcars. These operate over 11 routes, serving a total of 617 stops over a system length of 75 kilometers. These numbers make it by far the largest surface rail system in North America.

Toronto Public Transportation map
Public transportation in Toronto relies heavily on streetcars in the downtown core which is the thin red lines you see on the TTC map above. Technically, they’re light rail trains, but locals refer to them as streetcars. Each line usually follows a street e.g. 501 Queen St., so it shouldn’t be too hard to get on the right vehicle.

Done right, streetcars can really encourage the overall development of the city, they are able to define whole neighborhoods, reduce traffic congestion, reinforce retail, bring life to streets and fit easily into the surroundings without disruption to existing businesses, residents or traffic.

Pros

One of the main advantages of streetcars is its high passenger capacity. Streetcars carry between 75 and 100 people per vehicle.

Regarding energy efficiency, streetcars are believed to do a little bit more for the environment that other public transport systems. Because every streetcar user means one less car on the road, words such as clean air quality, for environmental sustainability, for climate protection are often associated with streetcars. In fact, nothing drops greenhouse gas emissions faster than effective rapid transit, so if we truly want green for Toronto, streetcars might be the answer.

Another argument made in favor of streetcars is their long lifespan. The vehicles are designed to be very durable and can keep running for over 30 years. In contrast, buses wear out after just 8 – 12 years.

One of the “last” Toronto street cars. image: blogto.com

Since they are longer-lasting than other means of transport, the cost of repair and replacement is typically also much lower.

One ride costs $3.25, making it a very cheap transit option across the city. At the same time they are relatively fast to build, without impacting the city for a long period of time and resulting in minimal disruption to the neighborhood.

Streetcars can be so charming. Well, this is a subjective opinion, but have you seen vintage trolleys in San Francisco or New Orleans? They’re so awesome.

Cons

There are two sides to every coin so we have to mention disadvantages of streetcars, too. Once again, let’s talk about their passenger capacity. Even though they carry a relatively high number of passengers, the difference between a streetcar, LRT and subway is noticeable. Just for comparison, a subway train can hold up to 1500 passengers and an LRV can hold up to 255 people in a single vehicle (depending on speeds, frequency and actual vehicle length and capacity).

Next, streetcars require “loops” to turn around, which slows them down. This is not the case with cars, LRVs or subways.

Streetcars are noticeably slower than cars as they are travelling at speed of about 17km/h. LRVs run at an average of 27km/h and subways at 32km/h.

Streetcars are said to contribute to traffic congestion greatly. Imagine a situation when a streetcar stops to let passengers load on or get off. In such situation, both lanes at of traffic are blocked. This causes delays and angst among riders. If you’ve ever driven behind a streetcar, you know how much of a problem this is. You have nowhere to go, unless you stand far back enough to turn your car around.

At certain times they may pose danger to both passengers and pedestrians. For example, when cars try to pass them before they stop.

When it comes to costs, it is important to distinguish between the cost of laying down streetcar tracks, maintaining the streetcars themselves and maintaining roads. Streetcars require a whole lot of special mechanics and thus the cost of maintenance is much higher.

And let’s not forget about pollution. You might disagree with a statement that streetcars are a reason behind increased pollution in our city, but if you think about it for a second, you will realize there is some truth in it. Since it creates traffic congestions, it also adds to pollution.

Future of Streetcars

Even though many people are getting more and more angry at streetcars, they are not going anywhere. When (then Mayor) Rob Ford tried to cancel the Transit City light-rail-plan and build tunnels underground in some parts of the city, city council decided to keep new transit lines above ground. The main reason behind this decision was the cost of tunneling and powering subways.

And for those unhappy citizens who are queuing up behind streetcars every morning, the least Toronto could do is indicate that they are keeping an open mind about new subway lines. And let’s not forget that the city intends to build and operate new light rail transit lines, which means that people will be able to travel in new dedicated lines, separated from motor vehicle traffic. For the Silo, Jamie Sarner. 

Clairtone Canada Stereo Equipment Was Art-like

The Art of Clairtone: The Making of a Design Icon, 1958-1971 is a fully illustrated stylish look back at the stereo story behind a Canadian design icon. This handsome hardcover is by Nina Munk and Rachel Gotlieb and is available on Amazon.

At its peak in the 1960s, Clairtone Sound Corporation was one of the most admired companies in the field of electronics. Founded by Peter Munk and David Gilmour in Toronto, Canada, Clairtone made the wildly modern Project G hi-fi system and, later, the G-TV. The commercial, shot in July 1967 by famous Canadian cinematographer Frank Spiess, was produced by Young & Rubicam. It features Munk and Gilmour, then in their 30s, at a studio in Toronto and includes footage from Clairtone’s infamous factory in Stellarton, Nova Scotia.” east19thstreet via YouTube

For a decade, in the 1960s, Clairtone Sound Corporation captured the spirit of the times: sophisticated, cosmopolitan, liberated. From its modern oiled-walnut and teak stereos to its minimalist logos and promotional materials, Clairtone produced a powerful and enduring body of design work. Founded in 1958 by two young Canadians, Peter Munk and David Gilmour, Clairtone quickly became known for its iconic designs and masterful advertising campaigns.

Its acclaimed Project G stereo, with its space-age styling, epitomized the Swinging Sixties. Famously, Hugh Hefner owned a Project G. So did Frank Sinatra.

Oscar Peterson affirmed that his music sounded as good on a G as it did live.In 1967, suggesting how deeply Clairtone’s G series had come to be identified with popular culture, the G2 appeared in The Graduate with Dustin Hoffman and Anne Bancroft.

With 250 illustrations, including previously unpublished drawings, rare film stills, confidential memorandums, and original photography, The Art of Clairtone is a candid and in-depth look at the company’s skyrocketing success — and sensational collapse. Through the recollections of those who knew Clairtone best, from its founders to its designers, engineers, and salesmen, and with comments from Karim Rashid, Douglas Coupland, Tyler Brûlé, and Bruce Mau, among others, this elegant book, published on the 50th anniversary of Clairtone’s launch, celebrates an iconoclastic company that once seemed to represent the promise of Canada.

A peak inside this gorgeous book- CP

  • Hardcover: 176 pages
  • Publisher: McClelland & Stewart
  • Language: English
  • ISBN-10: 0771065078
  • ISBN-13: 978-0771065071

Featured Image-  vornadoblog.blogspot.com

Supplemental- Caring for Oiled Walnut Wood (Table)  http://www.doityourself.com/forum/furniture-wood-cabinetry-finishing/371338-best-oil-care-oiled-walnut-slab-table.html

Fun Late Night Activities To Do after the Bars Close

Drinking with friends until late at night is fun, which is why lots of people do it especially on weekends. You get to talk with friends about your romantic problems and work issues, or you may enjoy watching live games in sports bar with other fervent fans. But what can you do after the bars close? Many take things easy and wind down with one of the excellent erotic massages in Montreal. That seems like the perfect way to end a fun night.

Erotic Massage Parlors Montreal Toronto

However, there are other ways to continue having fun even when the bars all seem closed late at night. Discuss matters with your friends, and see if any of these suggestions suit their fancy:

Drink Coffee

Haven’t you noticed how many of these specialty coffee shops are open 24 hours? That’s because they know that when people are done drinking but they don’t want to go home yet, they get coffee to continue their story-swapping activities.

Bill Murray drinking from coffee carafe

Coffee is perfect for those who have been drinking, since it can keep people from just sleeping. Your friends will hate you if they have to drag your sleeping body home. So drink some coffee, and afterwards hire a cab back to your place. Just don’t drive! You may be awake, but you’re still drunk!

Eat Something

Lots of people experience the “munchies” when they’ve been drinking. So once the drinking is done, it may be time to continue the night with some fast food treat like a nice juicy burger or some hot pizza. You may also want to try shawarma.

Dark Knight slices Shwarma with laser sword

Scientific studies have confirmed that alcohol can really make you feel hungry. It’s been found that alcohol fires up a type of brain cell that’s also active when you’re starving. So when you drink, your brain thinks you haven’t eaten for a long while.

Play Video Games

In some cities like Montreal, you may find arcade places where you can play various video games even at 3:00 AM. You can play Tekken and other fighting games if you’re one of those inclined to violence after a bit of drinking—at least this time, no one gets really hurt!

TEKKEN arcade game action

You can also try any of the racing games, and you may find out why it’s a bad idea to drink and drive. Of course, even if you do well in these games it doesn’t mean you’re ready to drive home for real.

Sing Some Karaoke

You may be a shy wallflower type when you’re sober, but you may be a performer yearning to break free once you’ve imbibed enough alcohol. You’re not alone, so why not join other would-be singers and have some fun belting out your favorite tunes?

Karaoke singing showoff

The nice thing about being drunk is that it makes you brave enough to try this, and you’re also drunk enough to think you’ve done justice to that Bon Jovi song you’ve always liked. Most people in these places are non-judgmental, so even if you’re off-key they won’t mind. Not that you’d know you were off-key…

Go Bowling

Bowling is another activity that somehow seems a lot more fun when you’ve been drinking. It also shows you exactly how drunk you are—if your bowling ball can’t hit any of the pins every time, then it may be time to call it a night. Bowling is something you can do if the bar you went to closed early at 1AM or so, as some bowling places may close at 3AM.

Try Your Luck at a Casino

Roulette wheel

You better believe that if you’re a well-behaved drunk, the casino will love you. You get to enjoy yourself playing blackjack, while the casino plies you with drinks as they happily take your money! For the Silo, Dimitry Karloff. 

Exploring Growing Popularity Of Party Buses

When it comes to parties and get-togethers, one of the hottest new trends is the party bus. Surprisingly, this trend has grown in almost all age ranges. The appeal is understandable as a party bus allows a group of people to celebrate in one place while also traveling to one or more destinations. Why exactly has the party bus trend taken off? Let’s look at some of the primary reasons why they’re so popular today.

Convenience

Unlike having to hire a taxi or other ride service when people want to go out with their friends, a party bus is an inclusive party. After hiring the bus, they can enjoy drinks on the bus while going to and from their desired location. Some party buses may also come with their own entertainment such as a minibar, TV, dance floor, and more.

Cost Effective

If you’re trying to get a group of people together but don’t want to break the bank, a party bus is probably the way to go. Choosing a party bus Toronto based is more affordable than ever. There are usually several packages to choose from, and for an inclusive fee, you can enjoy a wide range of entertainment options. The party bus is usually a more cost-effective option than going to a restaurant or bar with a large group of people. People also have the advantage of knowing what they’re paying for instead of having to worry about extra costs.

High Capacity Buses

Although you may not need one of the larger buses, some party buses can accommodate up to a whopping 454 passengers. Not only does this have an economic advantage, people can easily party with a larger group. On the other hand, finding a restaurant or other space that seats this number of people is virtually impossible. However, many people are finding that a bus meets their needs for large or medium sized groups.

New and Exciting

When it comes to partying, everyone has been to a bar or club before. However, a party bus offers something new and interesting. From the fun decor to the added interest of traveling while partying, this popular new trend is an innovation. Chances are, party buses will only continue to become more popular over time.

Majestic Limo Services Toronto Party Bus Interior

Multi-Purpose Use

Another thing about party buses is that they’re not designed for one specific event. While you may think about them for bachelorette parties or birthday get-togethers, they’re appropriate for any number of events. From Christmas office parties to anniversaries and even wedding parties, you can find a number of reasons to rent a bus. This is also why people of all ages are choosing party buses.

There is no doubt that party buses are changing the industry and becoming more popular every day. They are perfect for any number of reasons, and who knows, maybe you could consider renting one for your next event. If you’ve been one of the many people who has partied in one of these buses, then you already know what the hype is about.

Featured image- Majestic Limos Toronto Party Bus interior. 

Historic Architect Edmund Burke Shaped Look Of Today’s Toronto

Since 1793, when the Town of York, the second capital of Upper Canada, was founded, Toronto has been an important economic and political hub.

The first governor of the Town of York, John Graves Simcoe, believed that this town would become a powerful industrial metropolis, and when Toronto became one of the top financial centres in the world, his dreams came true.  Toronto, as the fifth most populous city in North America, is evaluated by experts and economists from the Economist Intelligence Unit as one of the world’s most livable cities.

Iconic Prince Edward Viaduct by E. Burke

The provincial capital of Ontario is dominates many sectors, including business services, finance, telecommunications, media, arts, film, music, television, software production, tourism, medical research, and engineering. There’s no doubt that Toronto is one of the fastest developing and growing cities in North America. We should remember and appreciate the most significant people in our city’s history who contributed to this prosperity.

Toronto is a perfect example of how the life and spirit of every city in the world is defined and influenced by its architecture.

Each part of Toronto has its own unique atmosphere that reflects its cosmopolitanism. The architecture of Toronto preserves various styles from different eras and centuries. Nevertheless, there were several architects whose work and designs significantly shaped the look of Toronto as we know it today. Let’s take a closer look at the work of the most significant Torontonian architects.

Edmund Burke (1850-1919)
Early Years
Burke was born in Toronto on October 31st, 1850 as the eldest child of lumber merchant and builder William Burke and his wife, Sarah Langley. Edmund Burke finished his studies at Upper Canada College and started to work as an architectural apprentice under the guidance of his uncle, Henry Langley, who was very distinguished among the first generation of architects who were taught in Canada. Back then, Burke was a twenty-year-old man with considerable skill and an open mind who was eager to learn as much as possible from his uncle. A great deal of knowledge about traditional styles was passed from Langley on to his young nephew. Langley’s influence can be recognized in the conservative undertones of Burke’s works. In 1872, he entered a partnership with his uncle. This year marked the formal beginning of his rich and successful career. His own business was set up in 1892, and in first years on his own, he worked on two important architectural projects: the Jarvis Street Baptist Church and McMaster Hall (now the Royal Conservatory of Music) on Bloor Street.

Members of the Toronto Architectural Guild meeting at Edmund Burke’s summer home in 1888. Burke is circled in red. Photo: archives.gov.on.ca

This was the first time that he was truly independent and could express himself without any limitations, making this a period of crucial importance for understanding Burke’s work. Gilbert Scott, one of the most notable figures in British architecture, was his biggest influence in his early works. However, Burke was able to brilliantly combine his progressive and innovative sensibilities with traditional architectural styles. Angela Carr, Assistant Professor of Art History at Carleton University, wrote in her study, Toronto Architect Edmund Burke: Redefining Canadian Architecture, that “Burke’s work developed consistently through a variety of building types in all periods, accommodating technological advances almost as rapidly as these appeared and expressing the new aesthetic of a changing society.“

Burke, Horwood, and White
Burke, after two years as a sole practitioner, established a partnership together with J.C.B. Horwood, and they were later joined by Murray White. All three of them were former students of Henry Langley. Their firm, which designed a vast number of churches across Canada, many luxurious mansions for wealthy citizens of Ontario, and many commercial buildings, was one of the most successful architectural companies in the country. The firm combined different historical styles with new techniques and new materials such as glazed terra cotta, early iron, reinforced concrete frames, and forms of fire protection.

Edmund Burke was eager to seek a new innovative solution that would encourage the modernization of technology. He shared his knowledge with his colleagues by giving lectures and issuing publications. His biographer noted that Burke “presided over the transformation of the architect from the craftsman to consulting professional.“ Burke is responsible for bringing to the practice of architecture in Canada the new vocabularies and technologies used in that era in the United States. He worked with American models, a type of plan than became standard across the country in the last two decades of the 19th century, when he was working on the Jarvis Baptist Church from 1874 to 1875. Moreover, he was responsible for introducing the “curtain-wall“ construction to Canada when designing the Robert Simpson store in 1894, which, in the following decades, inspired many architects of retail department stores across the country.

St. Luke's United Church Toronto
St. Luke’s United Church Toronto

It is worth noting that Burke was also active in urban planning activities for the City of Toronto and that he also was a part of several committees established by the Ontario Association of Architects and Toronto’s Guild of Civic Art. He is the author of the Prince Edward Viaduct, also known as the Bloor Viaduct, which he designed together with the city engineer’s office. Moreover, he participated and worked on projects improving the city’s traffic flow.

Burke’s Work in Professional Architectural Societies
Edmund Burke was one of the leading figures responsible for the recognition of the architectural profession and for having a substantial influence on Torontonian architecture in the 19th century. Burke played a major role in codifying standards of practice and education in the field of architecture, which ensured basic rules and and proper working conditions for architects as well as protection from unqualified practitioners.


The ever-growing competition from the United States was the main reason for the establishment of innovative learning programs, the introducing of modern technologies, and the formation of professional architectural organizations. Burke was responsible for the establishment of the Ontario Association of Architects in 1889, which he later led as its president in 1984 and 1905 to 1907. Furthermore, he was one of the three founding members of the Royal Architecture Institute of Canada. His support of quality education was an important aspect of his contribution to Canadian architecture. He noted that “if we train our students thoroughly and see that no one but first class men are permitted to enter the profession, I think the rest will take care of itself.“

Edmund Burke devoted his life to architecture and introduced a new way of combining the newest trends with traditional styles. The last years of his life were dedicated to public and professional service. The face of Toronto continued to be shaped by his works and ideas through the works of his colleagues and students for many years.

“Few men of the present generation of architects have so widely held the respect and esteem of their confrères, or been more closely identified with the building progress of the country. Practicing continuously for a period of over forty years, during the time when Canada was passing from its more backwards state to the present great strides of nationhood, his efforts stand out prominently in the modern character of Canadian architectural work.“ Obituary of E.Burke, Construction (January 1919)

Notable Buildings Designed by Edmund Burke
Jarvis Street Baptist Church (1878) – Jarvis Street
Prince Edward Viaduct, also known as the Bloor Viaduct (1881)
Trinity-St. Paul’s United Church (1887–1889) – Bloor Street, west of Spadina Avenue
Owens Art Gallery (1893) – Mount Allison University, New Brunswick
St. Luke’s United Church (1874) – Sherbourne Street and Carlton Street
Beverley Street Baptist Church (1886) – 72 Beverley Street
Robert Simpson’s Department Store Building (1908) – 176 Yonge Street [*perhaps the building Burke is most famous for CP]
St. Andrew’s Evangelical Lutheran Church (1878) – 383 Jarvis Street
McMaster Hall, now The Royal Conservatory of Music (1881) – 273 Bloor Street West

Burke worked on several buildings and projects outside of Ontario including the design and construction of Owens Art Gallery in New Brunswick

For the Silo by Jamie Sarner.  

Supplemental- Discover the book, Edmund Burke- a genius revisited

Toronto Martinis Are All About The Garnish

TORONTO, Ont. — In a quiet, backlit corner, cozied up to a bar or amid the flashing lights on the dance floor, the distinctive silhouette is striking.

Ahhhh martinis.

1969's 007- George Lazenby
1969’s 007- George Lazenby

Slender where it needs to be, but flared in the right spots, the martini has an iconic image that exemplifies class and sophistication, which is perhaps why it is the drink of choice for the fictional British spy James Bond. And as the tuxedo is central to the image of 007, how you dress your martini is key to its image — a skewer of olives resting along the angle of the chilled cocktail glass, submerged in the clear mixture of vermouth and gin (or vodka, as your personal taste may dictate).

“The martini is drink for the refined, elegant individual, not unlike the fictional British spy James Bond,” says Desiree Sardo, head of communications and public relations at Sardo Foods. “Vodka or gin.

Shaken or stirred. The beauty of the drink is its versatility, and that applies to the olives as well. The question that must be asked is, what’s in your martini?”

With the future of the next Bond movie still up in the air (will we see a new actor taking on the 007 role?) , Desiree suggests shaking up a few martinis and settling in for a contemplative James Bond marathon.

[Here’s Radiohead’s superior and unused theme song for the opening of Spectre]

For a classic martini like Bond would enjoy, pour ½ oz. vermouth and 3 oz. of gin over ice in a mixing glass. Stir well, then strain into a chilled cocktail glass. Garnish with several green olives (martini enthusiasts insist on a minimum of three olives) and enjoy.

Up the Martini ante with Sardo Gourmet stuffed Olives.

Most people like a traditional pimento stuffed olive in their martini, but experimenting with garlic and red pepper stuffed olives, or jalapeno and red pepper, will add a little zest to your drink.

To complete the martini experience — and give you a healthy snack while watching a Bond film — pair it with an incredibly easy-to-make but classy antipasto skewer.

Start with a cured, salted meat — prosciutto is a good choice — as the base, then add on an artichoke heart, cherry tomato, a leaf of basil or mint and a bocconcini. The presentation is beautiful and the skewer makes it easy to eat while still holding your martini glass.

“Everybody has their favourite Bond actor and their favourite Bond film, but to get a true taste of the character I recommend a marathon that includes a good variety of Bond movies with a different Bond in each,” says Desiree. “Your James Bond martini and a viewing of Spectre with Daniel Craig would go well with GoldFinger starring Sean Connery, For Your Eyes Only with Roger Moore and Die Another Day with Pierce Brosnan. A martini or two with your marathon is a great way to spend a James Bond day.”

For more information, email contentproducer@thesilo.ca or visit sardofoods.ca.  Join the conversation on Instagram @sardofoods and Like on Facebook.

Toronto Martini CN Tower BackgroundAbout Sardo Foods:

Family owned and operated in Canada, Sardo Foods is world renowned for bringing all the unique flavours of the Mediterranean to your family’s table. Specializing in olives, antipasti, pesto, spreads, bruschetta and more, Sardo Foods aims to make gourmet cooking and entertaining easy.

Based in Bolton, Ont., Sardo Foods employs 150 people and boasts more than 200 product lines.

Mattress Sales in Toronto: How to Find the Best Deals  

A mattress is a vital component of comfort in your home.

A poor-quality mattress can cause body aches and affect your life. It’s, therefore, crucial to purchase the right mattress from a reputable store at a reasonable price. For the best mattress sale in Toronto, you need to consider some factors to help you make the right decision. If you’re looking for a deal on your next mattress or bed set, keep reading for tips on finding the best mattress sale in Toronto and get the most significant savings with no compromise on quality. 

  1. Identify a Reputable and Reliable Mattress Store 

When shopping for a mattress sale in Toronto, it’s essential to identify reliable and reputable retailers. If you have friends or family members who have recently gone through a mattress purchase, they can give you good advice about specific stores that they found reliable. Local blogs or online forums dedicated to mattress purchases can also be good resources when looking at different brands and retailers.  

Once you’ve identified some potential stores, it’s time to look into their sales policies. Most reputable retailers will offer sales periodically throughout the year—especially around major holidays like Black Friday and Christmas—so knowing how long those sales last is critical to ensure you get a good deal. A good mattress store in Toronto like the Queensway Mattress will provide overall satisfaction from good customer service to quality products and after-sales services. So, look out for any complaints about delivery times, damaged goods, or unsatisfactory services before finalizing your decision. 

  1. Try Out Before You Buy 

Getting out of bed and trying out a mattress is an excellent way to be sure you’re making an informed decision. You can check how it feels, whether it’s too soft or too firm, and see if you like how it looks. If you want to buy a new mattress, try one out before purchasing—you may even decide that you can get by with what you already have. Leave enough time for your test drive; going from store to store will likely take more than a few hours. 

Ask about return policies: Most stores won’t accept returns once you take off mattresses from their premises. Asking these questions up front can save you time and energy later on. Therefore, if you’re looking for a mattress sale in Toronto, it’s crucial to ensure they allow you to sleep on your new mattress before deciding whether it meets your needs. 

The Most Uncomfortable Bed in the World - Touch a Life | OpenSea
  1. Go for The Best Quality and Comfort 

You might assume that high-quality, comfortable mattresses are expensive, but that’s not always true. You can get quality mattresses from reliable stores at reasonable prices if you know how to shop around. However, you need to know your needs and requirements before shopping for a new mattress to avoid wasting money on a product that doesn’t suit your needs. 

For example, if you need a mattress that can help you relieve some pressure points on your body, then you can invest in a Latex or Memory foam mattress. If you have problems with allergies, then it is better to buy a hypoallergenic mattress from a reputable store. It’s good to match your needs with quality, comfort, and economical pricing to decide what type of mattress you should purchase. 

  1. Check The Warranty 

Before you finalize your deal on a mattress sale in Toronto, check to see what kind of warranty it comes with to be safe. If your mattress wears out within five years and doesn’t have a solid product warranty, you might pay a lot more than you bargained for in the first instance. It’s also worth asking about details like return policy and restocking fees: some businesses are notorious for charging steep return fees or simply refusing to accept used or damaged products. 

Buying mattresses supported by the most reliable warranties will keep you from paying extra money later. Also, ask how long those warranties last; sometimes, they expire just months after purchase. Dedicated warranty periods may range between 2 and 15 years. 

  1. Take Advantage of Free Delivery and Removal 

When buying a mattress, ask about free delivery and removal. If a retailer doesn’t offer such services or charges too much for them, you can probably find them elsewhere. The point of getting great deals on mattress sales is not to deal with additional hidden fees. Just be sure to factor in other costs, like transportation and set-up, when you do your comparison shopping. 

For example, if one store offers free shipping, but another delivers right to your door at no extra charge, you might pay more overall by Option 1. However, some people prefer picking out their mattress; they say they can test it out before purchasing. You can also benefit from some retailers offering a mattress sale in Toronto who let customers try out mattresses at home—so check around! 

  1. Look for Economical Pricing and Flexible Payment Methods 

Many of us choose to buy mattresses online since they tend to be less expensive. However, if you’re going to buy a mattress online, make sure you find one with an economical pricing structure and flexible payment options. You don’t want to spend even more money paying interest or other fees because you bought your mattress online; shop smart and get a good deal. 

You can also search for reputable stores that offer mattress sales in Toronto at monthly installments and no-interest financing plans. This way, you won’t have to pay all at once but will still get to enjoy your new mattress immediately after making your purchase. 

Conclusion 

Those who know how to find deals on mattress sales in Toronto are doing a service to themselves, whether they choose to purchase online or offline. There are so many choices that come with different prices, but if you know where to look and what questions to ask, you can get what you need at a price that won’t break your bank. A reputable mattress store in Toronto will have all of their products clearly labeled and will be able to answer any questions you may have about their products. You need not settle for less than what you want when purchasing mattresses; do your research, ask your questions, and use these tips as a guide when looking for a deal on a mattress sale in Toronto. 

The Mullet Dress

The author’s sister utilizes her mullet dress by “showing off a little leg-party in the front, and keepin’ them guessing with a little train-business in the back.” photo: H. Richards

“Business in the front, party in the back.”

We’ve all heard the mullet mantra. However, I’m pretty sure mullets were only cool for a short period in the 80’s, and that was still only true if you were in a rock or heavy metal garage band. Once the mullets-are-acceptable-period passed, they were never a socially acceptable hairstyle again.

For whatever reason, over the past few years the fashion gods have decided to bring back the mullet, only this time, in a way-cool form. Yep, I’m talking about the mullet shirt, skirt and dress. Instead of a poor choice hairdo, the mullet can now be worn as an article of clothing. And in further ‘good’ news, “mullet wear” is surprisingly figure flattering for all body types, since it can be worn in such a variety of forms.

1973 early mullets for Linda and Paul McCartney in this Japanese TV special.

Mullet shirts are typically bo-ho style, sometimes with a flowy batwing sleeve, and give you a comfortable look that pairs perfectly with a mid-rise or high-rise pant (which are also coming back in style in every colour known to the human race).

You can also find mullet shirts that are more tailored with a collar, or in the form of a sweater that is longer in the front, and both are work-appropriate looks. Just remember, if you are wearing a loose-fitting top, make sure your bottoms fit well in a straight leg or skinny leg style.

For the younger crowd looking for some extra summer-loving fun, you can also take advantage of mullet crop tops by covering most of your belly with a high-waisted pant, skirt or shorts, and let just a hint of your midriff show, this way you can wear crop tops without showing your whole stomach and saving yourself from potentially looking trashy, like the aforementioned hairstyle. Or, if you’re out on the beach with friends and simply want to make a poutine run, go ahead and rock the crop top however you like. You will find yourself feeling vivaciously vintage, ready for a beach day, relaxing on the weekend or for a fun night out, depending on your choice of footwear and accessories.

But the mullet fun doesn’t stop there!

You will also be seeing skirts and dresses that attest to the mullet mantra, only reversed: Show off a little leg-party in the front, and keep them guessing with a little train-business in the back. Mullet skirts and dresses will give your outfit a unique, fashion-forward twist, and allow for a little behind modesty, yet are still playful and fun. The potential styles are endless, from maxi-mullet dresses for a beachy vay-cay, as well as high-waisted skirts that you can tuck a fitted shirt into and be ready for work. All of these styles will be available to you in a rainbow of bright colors, pastels, floral, and graphic prints. As fashion expert, Carson Kressley says, “If you look like a bag of Skittles, you’re doing it right.”

The moral of this story is, fashion repeats itself, trends come and go, and come back again.

The best part of the cycle is when a style comes back in a new, more polished form.  Mullet madness is indeed back again, and you can leave the scissors behind. For the Silo, Hannah Richards.

Silicon Valley Mansion May Set New Sales Record

California’s San Francisco Bay area is the United States’ most expensive real estate market, with a median home-sale price of USD$1.3 million (CAD$1.7 million). Toronto and the GTA (Greater Toronto Area) is Canada’s most expensive real estate market, with a median home-sale price of CAD$1.3 million (USD just under $1 million).

Unlike its southern neighbor Los Angeles, the pricey San Francisco mansions belong not to movie and TV stars but to the movers and shakers of the technology industry. The Bay Area boasts the country’s highest concentration of tech companies and tech jobs, earning the region the nickname “Silicon Valley” after the material used to make computer chips.

A home in San Francisco’s Pacific Heights neighborhood sold for USD$43.5 million (CAD$55.8 million) in 2021, which is the current record for the area’s biggest sticker price, but a new listing in the ultra-exclusive town of Woodside aims to shatter that record. Styled like an Italian villa, the spectacular compound has been listed for USD$110 million (CAD$141 million).

890 Mountain Home Rd-611-HDR-Edit LR
65 foot pool.

Sitting on over three acres of some of the most sought-after real estate in the world, the grounds feature a 65-foot pool with spa, an entertainment zone with an outdoor kitchen and fire pit, landscaped gardens that include fountains, a vineyard with more than forty olive trees and a rose garden with over one hundred roses as well as a private hiking trail. Nestled behind high-tech gates, the compound offers a 14,000-square-foot main home as well as a separate executive office and conference center, a fitness center/massage/hair salon building, and a two-bedroom guesthouse. 

890 Mountain Home Rd-755-HDR-Edit LR
Golf simulator? Check.

Retractable glass walls, French oak floors, and hand plastering on every surface complement rare Italian marbles inside the luxurious mansion. Crystal chandeliers and marble fireplaces feature throughout. The enormous main kitchen features two waterfall-wrapped islands, marble counters, top-of-the-line Wolf and Sub-Zero appliances, and custom-built-steel-and-glass cabinetry, while a separate chef’s kitchen offers extensive storage space plus a BlueStar range with two ovens. 

890 Mountain Home Rd-307-HDR-Edit LR
Master suite.

The primary suite is a work of art featuring a barrel-vaulted foyer with leather-front and glass-display cabinets that conceal a refrigerator and Miele laundry and a cathedral-beamed ceiling with chandelier. The sectionalized wardrobe room is couture-worthy. A two-sided Davinci fireplace is shared with the bathroom, which also has heated limestone floors and a marble bath for two. Each additional bedroom includes a customized walk-in closet, outside entrance, and en-suite marble bath.

890 Mountain Home Rd-683-HDR-Edit LR

Designed for the high-tech lifestyle, the home is controlled by state-of-the-art automated systems that take care of every need for comfort, convenience, and security from behind the scenes. The home’s fantastic amenities include an Atmos Dolby screening room, a golf simulator, indoor-and-outdoor lounges, and an epic wine salon for 6,000 bottles. 

890 Mountain Home Rd-354-HDR-Edit LR

Woodside is a small town with only 5,000 residents and a median home price above USD$5 million (CAD$6.4 million). Most residents are tech investors and innovators. Larry Ellison, founder of Oracle Corporation and the world’s tenth-richest man, lives down the street from the villa in a 23-acre, Japanese-themed estate. 

Known as an equestrian community, Woodside retains a rural residential character despite being only a short commute to Silicon Valley and Stanford University.

The town is ringed with nature preserves, including the Purisima Open Space and Skaggs Point. Options for entertainment include the Michelin-starred Village Pub and Bucks of Woodside, a famed hotspot for Silicon Valley’s most powerful, where many important venture capital deals have been signed.  The real estate listing is held by Scott Danser of Compass.  For the Silo, Genelle Brown/Top Ten Real Estate Deals dot com.

Photos : Paul Rollins

Ontario Farmers Markets will sell local craft beers

TORONTO — The Ontario government is supporting jobs in the province’s hospitality and agriculture sectors by allowing eligible local brewers to sell their beer at farmers’ markets. Expanding the farmers’ market program to include beer, announced in the 2021 Ontario Budget, is part of the government’s commitment to support brewers, winemakers and distillers working in the province’s alcohol manufacturing industries and to help them respond to the impacts of COVID-19.

This is a great combination for my constituency in Haldimand-Norfolk – and others whom have multiple farmers markets and many craft brewers.

“Our government is committed to supporting job growth in communities across Ontario by standing up for our vibrant hospitality, alcohol and agriculture sectors,” said Attorney General Doug Downey. “Providing local brewers with the opportunity to join wineries, cideries and distillers in selling their products at farmers’ markets is another breakthrough for the many jobs and families that are supported by Ontario’s diverse alcohol manufacturing industry.”

Allowing the sale of locally-made craft beer at farmers’ markets builds on other measures to help businesses respond to COVID-19, including:

  • permanently allowing restaurants and bars to sell alcohol with food takeout and delivery orders, including mixed cocktails and growlers
  • reducing the minimum price of spirits consumed at licensed establishments to align with the reduced pricing introduced for takeout and delivery orders
  • allowing the length of time for temporary patio extensions to be set out by the Alcohol and Gaming Commission of Ontario
  • permitting alcohol service on docked boats with a liquor sales licence
  • giving licensed establishments and retailers more flexibility in using liquor delivery services

“Supporting local business has never been more important and our government is making it convenient for consumers to pair up eligible Ontario craft beer, wine, cider and spirits with all the fresh and delicious food found at farmers’ markets,” said Lisa Thompson, Minister of Agriculture, Food and Rural Affairs. “Supporting local producers shows our commitment to the province’s agri-food sector while creating more jobs for Ontarians.”

“Ontario’s local brewers play a key role in Ontario’s agri-food sector, supporting jobs and contributing to local economies across the province,” said Peter Bethlenfalvy, Minister of Finance. “With this expansion of the farmers’ market program, our government is continuing to support businesses as they respond to the effects of the COVID-19 pandemic, while offering more choice and convenience for consumers.”

The government continues to support Ontario manufacturers and remains committed to supporting meaningful changes to the sale, service and delivery of alcohol to increase choice and convenience for consumers and create more opportunities for businesses to expand and grow while maintaining Ontario’s high standards for social responsibility.

Quick Facts

  • Licensed eligible brewers across the province can apply to the Alcohol and Gaming Commission of Ontario (AGCO) to occasionally extend their on-site stores to sell Ontario beer at farmers’ markets.
  • Brewers whose full brewing process takes place in Ontario at their own brewery are permitted to sell their products at farmers markets.
  • There are more than 180 farmers’ markets in Ontario.
  • The government is committed to upholding the highest standards for social responsibility, including the strong regulatory framework that is in place for alcohol sales, which includes a minimum age to purchase alcohol, mandatory staff training and minimum retail prices.

For the Silo, MPP Toby Barrett.

Why Everyone Should Strive To Pay Off Their Mortgage Quicker

Lots of people struggle to get a mortgage in the first place. It’s especially hard now because homes are so expensive. You start to think you’ll be paying off your mortgage for the rest of your life. 

Luckily, your finances will probably improve considerably over time. When they go up you should look into paying your mortgage early. Let’s look at some of the top reasons why it’s something you should aim for in the future. 

Extra Money To Enjoy Yourself 

Get It on Credit - Wikipedia

If people need to take out bad credit loans in Toronto, ON, they won’t have lots of disposable income. When you don’t have great credit you can’t enjoy yourself, but that’s not the case when you’re older. 

When you have more disposable income after paying off a mortgage, you’ll have much more money to spend on luxuries. If you need to keep paying a huge chunk of your income towards a mortgage your life won’t be as fun. 

Saving Lots Of Money In Interest 

Once you walk into Clover Mortgage Brokers in Toronto & GTA, they’ll let you know how much you can spend on a home. But it’s going to be a lot more over the lifetime of the mortgage due to interest payments. 

When you pay interest on a loan, it makes up a big chunk of your monthly payments in the beginning. The amount of interest you pay drops over time, but if you pay off the mortgage early you’ll no longer have to pay it.


Why Choose a Mortgage Broker in Canada? | Hatch Mortgages

It Eats Into Any Debts You Have 

Over the course of a lifetime, couples can generate a huge amount of debt. College tuition, car payments, and credit cards can sometimes be quite high. These debts won’t disappear once you pay your mortgage. 

Fortunately, once your mortgage is gone you’ll be able to focus 100% of your efforts on your other debts. It will take you one step closer to becoming debt-free, so you’ll have one less thing to worry about. 

A Mortgage Is A Secured Loan 

When you take out a mortgage it’s classified as a secure loan, which means when you don’t pay the loan they’ll be able to take your home away. In a perfect world, you’ll have as few secured loans as possible. 

You could pay a credit card instead of a mortgage, but it would mean they could take your home. Even though you won’t miss your credit card payments, they couldn’t take your home even if you did completely ignore them because a credit card isn’t classified as a secure loan. 

It’s Easier To Enjoy Retirement 

Nobody should have to pay debts when they’re retired. Sadly, so many people are struggling now, so it’s much more common than you think. It will eventually start to hurt your mental and physical health. 

How can you enjoy retirement if you’re always worrying? Maybe you’ll even have to stay on at work because you can’t afford to retire. Pay off your mortgage to ensure you don’t have any stress when you retire. 

Debt Isn't About Right Or Wrong - It's About Freedom

Don’t Leave It Too Late 

Nobody is saying you should try to pay off your mortgage as soon as possible, but it’s something you’ve got to start considering as the years go by. 

Why Getting a Business off the ground takes Guts

Being an entrepreneur is a calling for those who not only cope well with risk, but thrive on the challenges it presents. Those who are satisfied by the comfort of a secure job and a steady paycheque need not apply.

It’s an idea that has crossed the minds of virtually everyone who has worked for somebody else, regardless of the job.

As you put in time and labour that ultimately benefits someone else’s business, it dawns on you: Why can’t I just set up shop and do this myself? Why can’t I be the one taking home the big money after all the bills are paid and enjoying the independence of running my own show?

They’re great questions, but the answers aren’t for everybody.

Actually making the decision to give up the security of a steady job, and the regular paycheque and benefits that come along with it, takes a lot of guts and perseverance — especially in today’s highly competitive economy.

Unless you are among the fortunate ones backed by deep resources, the bottom line is this: when you first set out to become an entrepreneur, you are truly on your own. It’s just you and your idea. And it will be the marketplace — relentlessly detached and unemotional — that determines whether you make it or not.

Budding entrepreneurs who do take the risk to start up their own business generally face two key barriers — capital and human resources.

Many entrepreneurs owe their initial success to the trust of friends and family members, who invest funds in their start-up idea. These types of loans can be troublesome if the proper precautions aren’t taken. Make certain the terms of all loans from friends or relatives are spelled out clearly in a promissory note prepared by a lawyer. You may not be dealing with a bank or a financial institution, but you have to treat repayment in the same manner to avoid conflict with your lenders, who also may happen to be your best friend or your sister.

It’s also important to keep your credit record as clean as possible and establish a line of credit, which you can access for instant cash flow at certain times.

Start-ups are limited to hire only the personnel who they can afford, which often means running on a skeleton staff who may not necessarily be those with the greatest skills and experience. This is why most of us who have conceived what we think is a great idea for a business usually choose too much of the work ourselves and wear many hats in the early days.

It can take a long time to find the right employees when you’re just starting out. Some of the top talent may be reticent to work for a small start-up because they are worried about how it will look on their resume, job security or getting a bigger paycheque.

You need to find candidates who share your entrepreneurial spirit and aren’t averse to taking risks. Look for people who want get in on the ground floor and grow with the business.

As you build your company and expand your market, it’s tremendously important to have a network of mentors whose advice and counsel you trust. No matter how much thought and preparation you put into your business plan, you won’t be able to anticipate everything ahead of you. The marketplace is constantly moving and evolving, causing you and your business to adapt. This is where mentors can help, offering guidance drawn from experiences they had during similar changes in their own journeys.

My own mentors have changed as my career progressed, but they all had a common trait that served me and my businesses well — perspective. They have been able to see things clearly from a distance when my own vision may have been clouded by emotion, allowing me to make more-effective decisions. Entrepreneurship is about taking chances, but not blind ones.

Being an entrepreneur is a calling for those who not only cope well with risk, but thrive on the challenges it presents. Those who are satisfied by the comfort of a secure job and a steady paycheque need not apply. For the Silo, Paola Abate.

Cost Of Marijuana In 120 Cities And How Much Tax Revenue If Legalized

First a few quick facts….

‏Tokyo, Japan has the most expensive cannabis‏ ‏, at 32.66 USD per gram. ‏

‏Quito, Ecuador has the least expensive marijuana‏ ‏, at 1.34 USD per gram.‏

‏Based on the average US marijuana tax rates currently implemented, ‏ ‏New York City could generate the highest potential tax revenue by legalizing weed‏ ‏, with 156.40 million USD per year. New York City also has the highest consumption rate of cannabis, at 77.44 metric tons per year.‏

‏Cannabis costs ‏ ‏$7.82 per gram in Toronto, Canada‏ ‏. ‏

‏Berlin, Germany – ‏ ‏Automatic cultivator device, ‏ ‏Seedo‏ ‏, after much research and data gathering, previously released the 2018 Cannabis Price Index, detailing the cost of marijuana in 120 global cities. Seedo is one of the many new ventures embracing the newly legalized cannabis industry. Their main goal is to allow both medicinal and recreational consumers to grow their own supply, avoiding extra taxes and bypassing harmful pesticides. The aim of this study is to illustrate the continuous need for legislative reform on cannabis use around the world, and to determine if there are any lessons to be learned from those cities at the forefront of marijuana legalisation.

‏Although Seedo’s technology enables smokers to get off the grid, this study considers one of the biggest byproducts of legalising cannabis—the potential tax revenue for the local government body. For this reason, Seedo decided not only to research the cost of cannabis around the world, but also to calculate how much potential tax a city could generate if they were to legalise marijuana. ‏

‏The study began first by selecting 120 cities across the world, including locations where cannabis is currently legal, illegal and partially legal, and where marijuana consumption data is available. Then, they looked into the price of weed per gram in each city. To calculate how much potential tax a city could make by legalising weed, Seedo investigated how much tax is paid on the most popular brand of cigarettes, as this offers the closest comparison. They then looked at what percentage marijuana is currently taxed in cities where it’s already legalised in the US. ‏

‏“This study has revealed some incredible insights into the kind of tax revenue that legalising weed could generate.” says Uri Zeevi, CMO at Seedo. “Take New York City for instance, which has the highest consumption level in the study at 77.44 metric tons of cannabis per year. If they taxed marijuana at the average US cannabis tax level, the city could make $‏ ‏156.4‏ ‏ million in potential tax revenue per year. This is equivalent to providing nearly 3 months worth of free school meals to every single public school kid in New York City.” ‏

‏The table below reveals a sample of the results for ‏ ‏Toronto, Canada‏ ‏:‏

‏City‏

‏Legality‏

‏Price per gram, US$‏

‏Total possible tax collection, if taxed at cigarette level, mil US$‏

‏Total possible tax collection, if taxed at average US marijuana taxes, mil US$‏

‏Total consumption in metric tons‏

‏Toronto‏

‏Partial‏

‏7.82‏

‏124.15‏

‏33.38‏

‏22.75‏

‏The table below shows the ‏ ‏top 10 most and least expensive cities for cannabis‏ ‏:‏

‏Top 10 Most Expensive Cities‏

‏Top 10 Least Expensive Cities‏

‏#‏

‏City‏

‏Country‏

‏Legality‏

‏Price per gram, US$‏

‏#‏

‏City‏

‏Country‏

‏Legality‏

‏Price per gram, US$‏

‏1‏

‏Tokyo‏

‏Japan‏

‏Illegal‏

‏32.66‏

‏1‏

‏Quito‏

‏Ecuador‏

‏Partial‏

‏1.34‏

‏2‏

‏Seoul‏

‏South Korea‏

‏Illegal‏

‏32.44‏

‏2‏

‏Bogota‏

‏Colombia‏

‏Partial‏

‏2.20‏

‏3‏

‏Kyoto‏

‏Japan‏

‏Illegal‏

‏29.65‏

‏3‏

‏Asuncion‏

‏Paraguay‏

‏Partial‏

‏2.22‏

‏4‏

‏Hong Kong‏

‏China‏

‏Illegal‏

‏27.48‏

‏4‏

‏Jakarta‏

‏Indonesia‏

‏Illegal‏

‏3.79‏

‏5‏

‏Bangkok‏

‏Thailand‏

‏Partial‏

‏24.81‏

‏5‏

‏Panama City‏

‏Panama‏

‏Illegal‏

‏3.85‏

‏6‏

‏Dublin‏

‏Ireland‏

‏Illegal‏

‏21.63‏

‏6‏

‏Johannesburg‏

‏South Africa‏

‏Illegal‏

‏4.01‏

‏7‏

‏Tallinn‏

‏Estonia‏

‏Partial‏

‏20.98‏

‏7‏

‏Montevideo‏

‏Uruguay‏

‏Legal‏

‏4.15‏

‏8‏

‏Shanghai‏

‏China‏

‏Illegal‏

‏20.82‏

‏8‏

‏Astana‏

‏Kazakhstan‏

‏Illegal‏

‏4.22‏

‏9‏

‏Beijing‏

‏China‏

‏Illegal‏

‏20.52‏

‏9‏

‏Antwerp‏

‏Belgium‏

‏Partial‏

‏4.29‏

‏10‏

‏Oslo‏

‏Norway‏

‏Partial‏

‏19.14‏

‏10‏

‏New Delhi‏

‏India‏

‏Partial‏

‏4.38‏

‏N.B. These tables are a sample of the full results. To find the complete results for all 120 cities, please see the bottom of the press release. ‏

‏The table below shows the ‏ ‏top 10 cities who could generate the most potential tax ‏ ‏by legalising cannabis, if taxed at the same rate as the most popular cigarette brand:‏

‏#‏

‏City‏

‏Country‏

‏Legality‏

‏Price per gram, US$‏

‏% of cigarette tax‏

‏Possible tax revenue, mil US$ ‏

‏1‏

‏Cairo‏

‏Egypt‏

‏Illegal‏

‏16.15‏

‏73.13‏

‏384.87‏

‏2‏

‏New York‏

‏USA‏

‏Partial‏

‏10.76‏

‏42.54‏

‏354.48‏

‏3‏

‏London‏

‏UK‏

‏Illegal‏

‏9.20‏

‏82.16‏

‏237.35‏

‏4‏

‏Sydney‏

‏Australia‏

‏Partial‏

‏10.79‏

‏56.76‏

‏138.36‏

‏5‏

‏Karachi‏

‏Pakistan‏

‏Illegal‏

‏5.32‏

‏60.7‏

‏135.48‏

‏6‏

‏Melbourne‏

‏Australia‏

‏Partial‏

‏10.84‏

‏56.76‏

‏132.75‏

‏7‏

‏Moscow‏

‏Russia‏

‏Partial‏

‏11.84‏

‏47.63‏

‏128.97‏

‏8‏

‏Toronto‏

‏Canada‏

‏Partial‏

‏7.82‏

‏69.8‏

‏124.15‏

‏9‏

‏Chicago‏

‏USA‏

‏Partial‏

‏11.46‏

‏42.54‏

‏119.61‏

‏10‏

‏Berlin‏

‏Germany‏

‏Partial‏

‏13.53‏

‏72.9‏

‏114.77‏

‏N.B. % of cigarette tax refers to the tax percentage on the most popular brand. Possible tax revenue refers to the total possible tax collection per year, if taxed at cigarette level. For a full explanation of how the study was conducted, please see the methodology at the bottom of the press release. ‏

‏The table below shows the ‏ ‏top 10 cities who could generate the most potential tax‏ ‏ by legalising cannabis, if taxed at the average US marijuana tax rate:‏

‏#‏

‏City‏

‏Country‏

‏Legality‏

‏Price per gram, US$‏

‏Possible tax revenue, mil US$‏

‏1‏

‏New York‏

‏USA‏

‏Partial‏

‏10.76‏

‏156.4‏

‏2‏

‏Cairo‏

‏Egypt‏

‏Illegal‏

‏16.15‏

‏98.78‏

‏3‏

‏London‏

‏UK‏

‏Illegal‏

‏9.20‏

‏54.22‏

‏4‏

‏Chicago‏

‏USA‏

‏Partial‏

‏11.46‏

‏52.77‏

‏5‏

‏Moscow‏

‏Russia‏

‏Partial‏

‏11.84‏

‏50.82‏

‏6‏

‏Sydney‏

‏Australia‏

‏Partial‏

‏10.79‏

‏45.75‏

‏7‏

‏Melbourne‏

‏Australia‏

‏Partial‏

‏10.84‏

‏43.9‏

‏8‏

‏Karachi‏

‏Pakistan‏

‏Illegal‏

‏5.32‏

‏41.89‏

‏9‏

‏Houston‏

‏USA‏

‏Partial‏

‏10.03‏

‏39.32‏

‏10‏

‏Toronto‏

‏Canada‏

‏Partial‏

‏7.82‏

‏33.38‏

‏N.B. Possible tax revenue refers to the total possible tax collection per year, if taxed at average US marijuana tax rate.‏

‏The table below shows the‏ ‏ top 10 cities with the highest and lowest consumption of cannabis, ‏ ‏per year:‏

‏Highest Consumers of Cannabis‏

‏ Lowest Consumers of Cannabis‏

‏#‏

‏City‏

‏Country‏

‏Legality‏

‏Price per gram, US$‏

‏Total consumption, metric tons‏

‏#‏

‏City‏

‏Country‏

‏Legality‏

‏Price per gram, US$‏

‏Total consumption, metric tons‏

‏1‏

‏New York‏

‏USA‏

‏Partial‏

‏10.76‏

‏77.44‏

‏1‏

‏Singapore‏

‏Singapore‏

‏Illegal‏

‏14.01‏

‏0.02‏

‏2‏

‏Karachi‏

‏Pakistan‏

‏Illegal‏

‏5.32‏

‏41.95‏

‏2‏

‏Santo Domingo‏

‏Dominican Rep.‏

‏Illegal‏

‏6.93‏

‏0.16‏

‏3‏

‏New Delhi‏

‏India‏

‏Partial‏

‏4.38‏

‏38.26‏

‏3‏

‏Kyoto‏

‏Japan‏

‏Illegal‏

‏29.65‏

‏0.24‏

‏4‏

‏Los Angeles‏

‏USA‏

‏Legal‏

‏8.14‏

‏36.06‏

‏4‏

‏Thessaloniki‏

‏Greece‏

‏Partial‏

‏13.49‏

‏0.29‏

‏5‏

‏Cairo‏

‏Egypt‏

‏Illegal‏

‏16.15‏

‏32.59‏

‏5‏

‏Luxembourg City‏

‏Luxembourg‏

‏Partial‏

‏7.26‏

‏0.32‏

‏6‏

‏Mumbai‏

‏India‏

‏Partial‏

‏4.57‏

‏32.38‏

‏6‏

‏Panama City‏

‏Panama‏

‏Illegal‏

‏3.85‏

‏0.37‏

‏7‏

‏London‏

‏UK‏

‏Illegal‏

‏9.20‏

‏31.4‏

‏7‏

‏Reykjavik‏

‏Iceland‏

‏Illegal‏

‏15.92‏

‏0.44‏

‏8‏

‏Chicago‏

‏USA‏

‏Partial‏

‏11.46‏

‏24.54‏

‏8‏

‏Asuncion‏

‏Paraguay‏

‏Partial‏

‏2.22‏

‏0.46‏

‏9‏

‏Moscow‏

‏Russia‏

‏Partial‏

‏11.84‏

‏22.87‏

‏9‏

‏Colombo‏

‏Sri Lanka‏

‏Illegal‏

‏9.12‏

‏0.59‏

‏10‏

‏Toronto‏

‏Canada‏

‏Partial‏

‏7.82‏

‏22.75‏

‏10‏

‏Manila‏

‏Philippines‏

‏Illegal‏

‏5.24‏

‏0.6‏

‏N.B. Total consumption is calculated per annum. ‏

‏Additional quotes:‏

‏“The way that the legalised cannabis industry is rapidly evolving alongside new technologies shows how innovative emerging tech companies are today.” says Uri Zeevi, CMO at Seedo. “Take the way that cannabis and cryptocurrency have joined forces, with ‏ ‏examples such as HempCoin or nezly, which manage processes and payments in the new marijuana industry.‏ ‏ When you consider too the potential that these new technologies have to disrupt the cannabis industry, there’s no denying that these are very exciting times.” ‏

‏“At Seedo, we’ve built technology that helps regular smokers to grow cannabis plants of the utmost quality from the comfort of their own home, avoiding pesticides and taking ownership of their personal supply.” says Uri Zeevi, CMO at Seedo. “We believe that by understanding the cost of weed around the world, we can help to educate smokers about the potential financial benefits of hydroponic growing technology.” ‏

‏“That illegal cannabis use is so high in countries that still carry the death penalty, such as Pakistan and Egypt, those in power ought to see how desperately new legislation is needed.” comments Uri Zeevi, CMO at Seedo. “By removing the criminal element from marijuana, governments will then able to more safely regulate production, take away power from underground gangs, and as we’ve shown in this study, generate huge tax revenues.”‏

‏Further findings:‏

‏New York City, USA has the highest consumption rate of cannabis‏ ‏, at 77.44 metric tons per year.‏

‏Boston, USA has the most expensive cannabis of all the cities where it’s legal‏ ‏, at 11.01 USD, while Montevideo, Uruguay has the least expensive at 4.15 USD. ‏

‏While Tokyo, Japan has the most expensive cannabis of all cities where it’s illegal, at 32.66 USD, ‏ ‏Jakarta, Indonesia has the least expensive at 3.79 USD, despite being classed as a Group 1 drug with harsh sentences such as life imprisonment and the death penalty.‏ ‏ ‏

‏For cities where cannabis is partially legal, Bangkok, Thailand has the most expensive at 24.81 USD, while Quito, Ecuador has the least expensive at 1.34 USD. ‏

‏Bulgaria has the highest tax rates for the most popular brand of cigarettes, at 82.65%, while Paraguay has the lowest, with rates of 16%. ‏

‏Cairo, Egypt would gain the most revenue in tax if they were to legalise cannabis‏ ‏ and tax it as the same rate as cigarettes, at 384.87 million USD. Singapore, Singapore would gain the least, at 0.14 million USD, due in part to the city’s low consumption of marijuana at 0.02 metric tons per annum.‏

‏Based on the average US marijuana tax rates currently implemented,‏ ‏ New York City could generate the highest potential tax revenue by legalising weed, with 156.4 million USD per year‏ ‏. Singapore, Singapore would gain the least, at 0.04 million USD

‏About “Seedo”‏ ‏: Seedo is a fully automated hydroponic growing device which lets you grow your own medicinal herbs and vegetables from the comfort of your own home. Seedo controls and monitors the growing process, from seed to plant, while providing optimal lab conditions to assure premium quality produce year-round. Seedo’s goal is to simplify the growing process, making it accessible for everyone, without compromising on quality. ‏

‏The full results of the 2018 Cannabis Price Index:‏

‏#‏

‏City‏

‏Country‏

‏Legality‏

‏Price per gram, US$‏

‏Taxes of cigarettes, % of the most sold brand‏

‏Total possible tax collection, if taxed at cigarette level, mil US$‏

‏Total possible tax collection, if taxed at average US marijuana taxes, mil US$‏

‏Total Consumption in metric tons‏

‏1‏

‏Tokyo‏

‏Japan‏

‏Illegal‏

‏32.66‏

‏64.36‏

‏32.14‏

‏9.37‏

‏1.53‏

‏2‏

‏Seoul‏

‏South Korea‏

‏Illegal‏

‏32.44‏

‏61.99‏

‏31.61‏

‏9.57‏

‏1.57‏

‏3‏

‏Kyoto‏

‏Japan‏

‏Illegal‏

‏29.65‏

‏64.36‏

‏4.64‏

‏1.35‏

‏0.24‏

‏4‏

‏Hong Kong‏

‏China‏

‏Illegal‏

‏27.48‏

‏44.43‏

‏19.72‏

‏8.33‏

‏1.62‏

‏5‏

‏Bangkok‏

‏Thailand‏

‏Partial‏

‏24.81‏

‏73.13‏

‏99.11‏

‏25.44‏

‏5.46‏

‏6‏

‏Dublin‏

‏Ireland‏

‏Illegal‏

‏21.63‏

‏77.80‏

‏29.31‏

‏7.07‏

‏1.74‏

‏7‏

‏Tallinn‏

‏Estonia‏

‏Partial‏

‏20.98‏

‏77.24‏

‏22.13‏

‏5.38‏

‏1.37‏

‏8‏

‏Shanghai‏

‏China‏

‏Illegal‏

‏20.82‏

‏44.43‏

‏49.12‏

‏20.75‏

‏5.31‏

‏9‏

‏Beijing‏

‏China‏

‏Illegal‏

‏20.52‏

‏44.43‏

‏43.10‏

‏18.21‏

‏4.73‏

‏10‏

‏Oslo‏

‏Norway‏

‏Partial‏

‏19.14‏

‏68.83‏

‏19.28‏

‏5.26‏

‏1.46‏

‏11‏

‏Washington, DC‏

‏USA‏

‏Partial‏

‏18.08‏

‏42.54‏

‏47.51‏

‏20.96‏

‏6.18‏

‏12‏

‏Cairo‏

‏Egypt‏

‏Illegal‏

‏16.15‏

‏73.13‏

‏384.87‏

‏98.78‏

‏32.59‏

‏13‏

‏Reykjavik‏

‏Iceland‏

‏Illegal‏

‏15.92‏

‏56.40‏

‏3.97‏

‏1.32‏

‏0.44‏

‏14‏

‏Belfast‏

‏Ireland‏

‏Illegal‏

‏15.81‏

‏77.80‏

‏13.55‏

‏3.27‏

‏1.10‏

‏15‏

‏Minsk‏

‏Belarus‏

‏Illegal‏

‏15.80‏

‏51.15‏

‏9.08‏

‏3.33‏

‏1.12‏

‏16‏

‏Athens‏

‏Greece‏

‏Partial‏

‏14.95‏

‏79.95‏

‏7.42‏

‏1.74‏

‏0.62‏

‏17‏

‏Auckland‏

‏New Zealand‏

‏Partial‏

‏14.77‏

‏77.34‏

‏106.03‏

‏25.73‏

‏9.28‏

‏18‏

‏Munich‏

‏Germany‏

‏Partial‏

‏14.56‏

‏72.90‏

‏50.90‏

‏13.10‏

‏4.80‏

‏19‏

‏Helsinki‏

‏Finland‏

‏Partial‏

‏14.42‏

‏81.53‏

‏27.12‏

‏6.24‏

‏2.31‏

‏20‏

‏Singapore‏

‏Singapore‏

‏Illegal‏

‏14.01‏

‏66.23‏

‏0.14‏

‏0.04‏

‏0.02‏

‏21‏

‏Berlin‏

‏Germany‏

‏Partial‏

‏13.53‏

‏72.90‏

‏114.77‏

‏29.55‏

‏11.64‏

‏22‏

‏Stuttgart‏

‏Germany‏

‏Partial‏

‏13.50‏

‏72.90‏

‏20.20‏

‏5.20‏

‏2.05‏

‏23‏

‏Thessaloniki‏

‏Greece‏

‏Partial‏

‏13.49‏

‏79.95‏

‏3.17‏

‏0.75‏

‏0.29‏

‏24‏

‏Stockholm‏

‏Sweden‏

‏Illegal‏

‏13.20‏

‏68.84‏

‏15.06‏

‏4.11‏

‏1.66‏

‏25‏

‏Vienna‏

‏Austria‏

‏Partial‏

‏12.87‏

‏74.00‏

‏59.21‏

‏15.02‏

‏6.22‏

‏26‏

‏Copenhagen‏

‏Denmark‏

‏Partial‏

‏12.47‏

‏74.75‏

‏20.65‏

‏5.18‏

‏2.22‏

‏27‏

‏Moscow‏

‏Russia‏

‏Partial‏

‏11.84‏

‏47.63‏

‏128.97‏

‏50.82‏

‏22.87‏

‏28‏

‏Hamburg‏

‏Germany‏

‏Partial‏

‏11.64‏

‏72.90‏

‏50.16‏

‏12.92‏

‏5.91‏

‏29‏

‏Chicago‏

‏USA‏

‏Partial‏

‏11.46‏

‏42.54‏

‏119.61‏

‏52.77‏

‏24.54‏

‏30‏

‏Philadelphia‏

‏USA‏

‏Partial‏

‏11.30‏

‏42.54‏

‏68.37‏

‏30.16‏

‏14.22‏

‏31‏

‏Bucharest‏

‏Romania‏

‏Partial‏

‏11.18‏

‏75.41‏

‏17.23‏

‏4.29‏

‏2.04‏

‏32‏

‏Cologne‏

‏Germany‏

‏Partial‏

‏11.14‏

‏72.90‏

‏28.51‏

‏7.34‏

‏3.51‏

‏33‏

‏Geneva‏

‏Switzerland‏

‏Partial‏

‏11.12‏

‏61.20‏

‏5.90‏

‏1.81‏

‏0.87‏

‏34‏

‏Boston‏

‏USA‏

‏Legal‏

‏11.01‏

‏42.54‏

‏28.59‏

‏12.61‏

‏6.10‏

‏35‏

‏Adelaide‏

‏Australia‏

‏Partial‏

‏10.91‏

‏56.76‏

‏41.60‏

‏13.75‏

‏6.72‏

‏36‏

‏Istanbul‏

‏Turkey‏

‏Partial‏

‏10.87‏

‏82.13‏

‏21.79‏

‏4.98‏

‏2.44‏

‏37‏

‏Melbourne‏

‏Australia‏

‏Partial‏

‏10.84‏

‏56.76‏

‏132.75‏

‏43.90‏

‏21.58‏

‏38‏

‏Sydney‏

‏Australia‏

‏Partial‏

‏10.79‏

‏56.76‏

‏138.36‏

‏45.75‏

‏22.59‏

‏39‏

‏New York‏

‏USA‏

‏Partial‏

‏10.76‏

‏42.54‏

‏354.48‏

‏156.40‏

‏77.44‏

‏40‏

‏Düsseldorf‏

‏Germany‏

‏Partial‏

‏10.70‏

‏72.90‏

‏15.82‏

‏4.07‏

‏2.03‏

‏41‏

‏Brisbane‏

‏Australia‏

‏Partial‏

‏10.63‏

‏56.76‏

‏66.88‏

‏22.12‏

‏11.09‏

‏42‏

‏Hanover‏

‏Germany‏

‏Partial‏

‏10.51‏

‏72.90‏

‏13.46‏

‏3.47‏

‏1.76‏

‏43‏

‏Prague‏

‏Czech Rep.‏

‏Partial‏

‏10.47‏

‏77.42‏

‏63.95‏

‏15.50‏

‏7.89‏

‏44‏

‏Frankfurt‏

‏Germany‏

‏Partial‏

‏10.29‏

‏72.90‏

‏18.06‏

‏4.65‏

‏2.41‏

‏45‏

‏Wellington‏

‏New Zealand‏

‏Partial‏

‏10.11‏

‏77.34‏

‏19.53‏

‏4.74‏

‏2.50‏

‏46‏

‏Dallas‏

‏USA‏

‏Partial‏

‏10.03‏

‏42.54‏

‏51.01‏

‏22.50‏

‏11.95‏

‏47‏

‏Houston‏

‏USA‏

‏Partial‏

‏10.03‏

‏42.54‏

‏89.13‏

‏39.32‏

‏20.89‏

‏48‏

‏Vilnius‏

‏Lithuania‏

‏Illegal‏

‏10.00‏

‏75.76‏

‏5.20‏

‏1.29‏

‏0.69‏

‏49‏

‏Zurich‏

‏Switzerland‏

‏Partial‏

‏9.71‏

‏61.20‏

‏10.33‏

‏3.17‏

‏1.74‏

‏50‏

‏Montpellier‏

‏France‏

‏Illegal‏

‏9.70‏

‏80.30‏

‏12.21‏

‏2.85‏

‏1.57‏

‏51‏

‏Canberra‏

‏Australia‏

‏Partial‏

‏9.65‏

‏56.76‏

‏10.96‏

‏3.63‏

‏2.00‏

‏52‏

‏Zagreb‏

‏Croatia‏

‏Partial‏

‏9.43‏

‏75.26‏

‏24.35‏

‏6.07‏

‏3.43‏

‏53‏

‏Nice‏

‏France‏

‏Illegal‏

‏9.40‏

‏80.30‏

‏15.80‏

‏3.69‏

‏2.09‏

‏54‏

‏Phoenix‏

‏USA‏

‏Partial‏

‏9.35‏

‏42.54‏

‏58.26‏

‏25.71‏

‏14.65‏

‏55‏

‏Paris‏

‏France‏

‏Illegal‏

‏9.30‏

‏80.30‏

‏102.25‏

‏23.90‏

‏13.69‏

‏56‏

‏Miami‏

‏USA‏

‏Partial‏

‏9.27‏

‏42.54‏

‏16.24‏

‏7.16‏

‏4.12‏

‏57‏

‏San Francisco‏

‏USA‏

‏Legal‏

‏9.27‏

‏42.54‏

‏30.94‏

‏13.65‏

‏7.85‏

‏58‏

‏London‏

‏UK‏

‏Illegal‏

‏9.20‏

‏82.16‏

‏237.35‏

‏54.22‏

‏31.40‏

‏59‏

‏Colombo‏

‏Sri Lanka‏

‏Illegal‏

‏9.12‏

‏73.78‏

‏3.98‏

‏1.01‏

‏0.59‏

‏60‏

‏Riga‏

‏Latvia‏

‏Illegal‏

‏9.00‏

‏76.89‏

‏10.23‏

‏2.50‏

‏1.48‏

‏61‏

‏Bratislava‏

‏Slovakia‏

‏Illegal‏

‏8.92‏

‏81.54‏

‏7.24‏

‏1.67‏

‏1.00‏

‏62‏

‏Milan‏

‏Italy‏

‏Partial‏

‏8.85‏

‏75.68‏

‏46.06‏

‏11.42‏

‏6.88‏

‏63‏

‏Varna‏

‏Bulgaria‏

‏Illegal‏

‏8.83‏

‏82.65‏

‏4.84‏

‏1.10‏

‏0.66‏

‏64‏

‏Marseille‏

‏France‏

‏Illegal‏

‏8.69‏

‏80.30‏

‏36.23‏

‏8.47‏

‏5.19‏

‏65‏

‏Glasgow‏

‏UK‏

‏Illegal‏

‏8.65‏

‏82.16‏

‏15.21‏

‏3.47‏

‏2.14‏

‏66‏

‏Toulouse‏

‏France‏

‏Illegal‏

‏8.62‏

‏80.30‏

‏18.67‏

‏4.36‏

‏2.70‏

‏67‏

‏Birmingham‏

‏UK‏

‏Illegal‏

‏8.58‏

‏82.16‏

‏27.73‏

‏6.34‏

‏3.93‏

‏68‏

‏Kuala Lumpur‏

‏Malaysia‏

‏Illegal‏

‏8.54‏

‏55.36‏

‏6.61‏

‏2.24‏

‏1.40‏

‏69‏

‏Monterrey‏

‏Mexico‏

‏Partial‏

‏8.45‏

‏65.87‏

‏4.17‏

‏1.19‏

‏0.75‏

‏70‏

‏Edinburgh‏

‏UK‏

‏Illegal‏

‏8.41‏

‏82.16‏

‏12.22‏

‏2.79‏

‏1.77‏

‏71‏

‏Lisbon‏

‏Portugal‏

‏Partial‏

‏8.36‏

‏74.51‏

‏4.69‏

‏1.18‏

‏0.75‏

‏72‏

‏Strasbourg‏

‏France‏

‏Illegal‏

‏8.35‏

‏80.30‏

‏11.13‏

‏2.60‏

‏1.66‏

‏73‏

‏Warsaw‏

‏Poland‏

‏Partial‏

‏8.31‏

‏80.29‏

‏29.27‏

‏6.84‏

‏4.39‏

‏74‏

‏Lyon‏

‏France‏

‏Illegal‏

‏8.20‏

‏80.30‏

‏19.45‏

‏4.55‏

‏2.95‏

‏75‏

‏Los Angeles‏

‏USA‏

‏Legal‏

‏8.14‏

‏42.54‏

‏124.88‏

‏55.10‏

‏36.06‏

‏76‏

‏Liverpool‏

‏UK‏

‏Illegal‏

‏7.94‏

‏82.16‏

‏10.86‏

‏2.48‏

‏1.67‏

‏77‏

‏Amsterdam‏

‏Netherlands‏

‏Partial‏

‏7.89‏

‏73.40‏

‏20.94‏

‏5.35‏

‏3.61‏

‏78‏

‏Manchester‏

‏UK‏

‏Illegal‏

‏7.88‏

‏82.16‏

‏58.99‏

‏13.48‏

‏9.11‏

‏79‏

‏Rome‏

‏Italy‏

‏Partial‏

‏7.86‏

‏75.68‏

‏88.16‏

‏21.86‏

‏14.82‏

‏80‏

‏Toronto‏

‏Canada‏

‏Partial‏

‏7.82‏

‏69.80‏

‏124.15‏

‏33.38‏

‏22.75‏

‏81‏

‏Denver‏

‏USA‏

‏Legal‏

‏7.79‏

‏42.54‏

‏20.53‏

‏9.06‏

‏6.20‏

‏82‏

‏Naples‏

‏Italy‏

‏Partial‏

‏7.75‏

‏75.68‏

‏29.82‏

‏7.40‏

‏5.08‏

‏83‏

‏Leeds‏

‏UK‏

‏Illegal‏

‏7.67‏

‏82.16‏

‏16.93‏

‏3.87‏

‏2.69‏

‏84‏

‏Seattle‏

‏USA‏

‏Legal‏

‏7.58‏

‏42.54‏

‏20.59‏

‏9.08‏

‏6.39‏

‏85‏

‏Madrid‏

‏Spain‏

‏Partial‏

‏7.47‏

‏78.09‏

‏93.40‏

‏22.45‏

‏16.01‏

‏86‏

‏Calgary‏

‏Canada‏

‏Partial‏

‏7.30‏

‏69.80‏

‏52.23‏

‏14.05‏

‏10.25‏

‏87‏

‏Luxembourg City‏

‏Luxembourg‏

‏Partial‏

‏7.26‏

‏70.24‏

‏1.62‏

‏0.43‏

‏0.32‏

‏88‏

‏San Jose‏

‏Costa Rica‏

‏Partial‏

‏7.23‏

‏69.76‏

‏7.84‏

‏2.11‏

‏1.56‏

‏89‏

‏Buenos Aires‏

‏Argentina‏

‏Partial‏

‏7.13‏

‏69.84‏

‏25.32‏

‏6.81‏

‏5.09‏

‏90‏

‏Brussels‏

‏Belgium‏

‏Partial‏

‏7.09‏

‏75.92‏

‏15.50‏

‏3.83‏

‏2.88‏

‏91‏

‏Santo Domingo‏

‏Dominican Rep.‏

‏Illegal‏

‏6.93‏

‏58.87‏

‏0.67‏

‏0.21‏

‏0.16‏

‏92‏

‏Graz‏

‏Austria‏

‏Partial‏

‏6.84‏

‏74.00‏

‏4.81‏

‏1.22‏

‏0.95‏

‏93‏

‏Budapest‏

‏Hungary‏

‏Illegal‏

‏6.74‏

‏77.26‏

‏7.70‏

‏1.87‏

‏1.48‏

‏94‏

‏Sofia‏

‏Bulgaria‏

‏Illegal‏

‏6.66‏

‏82.65‏

‏12.83‏

‏2.91‏

‏2.33‏

‏95‏

‏Ottawa‏

‏Canada‏

‏Partial‏

‏6.62‏

‏69.80‏

‏35.43‏

‏9.53‏

‏7.67‏

‏96‏

‏Vancouver‏

‏Canada‏

‏Partial‏

‏6.40‏

‏69.80‏

‏23.44‏

‏6.30‏

‏5.25‏

‏97‏

‏Sao Paulo‏

‏Brazil‏

‏Partial‏

‏6.38‏

‏64.94‏

‏68.55‏

‏19.81‏

‏16.55‏

‏98‏

‏Rotterdam‏

‏Netherlands‏

‏Partial‏

‏6.33‏

‏73.40‏

‏12.75‏

‏3.26‏

‏2.74‏

‏99‏

‏Ljubljana‏

‏Slovenia‏

‏Partial‏

‏6.32‏

‏80.41‏

‏3.43‏

‏0.80‏

‏0.67‏

‏100‏

‏Barcelona‏

‏Spain‏

‏Partial‏

‏6.23‏

‏78.09‏

‏39.59‏

‏9.51‏

‏8.14‏

‏101‏

‏Montreal‏

‏Canada‏

‏Partial‏

‏6.15‏

‏69.80‏

‏60.52‏

‏16.27‏

‏14.10‏

‏102‏

‏Kiev‏

‏Ukraine‏

‏Partial‏

‏6.00‏

‏74.78‏

‏14.73‏

‏3.70‏

‏3.28‏

‏103‏

‏Abuja‏

‏Nigeria‏

‏Illegal‏

‏5.88‏

‏20.63‏

‏7.40‏

‏6.73‏

‏6.10‏

‏104‏

‏Lima‏

‏Peru‏

‏Partial‏

‏5.88‏

‏37.83‏

‏12.28‏

‏6.09‏

‏5.52‏

‏105‏

‏Mexico City‏

‏Mexico‏

‏Partial‏

‏5.87‏

‏65.87‏

‏22.58‏

‏6.43‏

‏5.84‏

‏106‏

‏Cape Town‏

‏South Africa‏

‏Illegal‏

‏5.82‏

‏48.80‏

‏2.47‏

‏0.95‏

‏0.87‏

‏107‏

‏Karachi‏

‏Pakistan‏

‏Illegal‏

‏5.32‏

‏60.70‏

‏135.48‏

‏41.89‏

‏41.95‏

‏108‏

‏Manila‏

‏Philippines‏

‏Illegal‏

‏5.24‏

‏74.27‏

‏2.32‏

‏0.59‏

‏0.60‏

‏109‏

‏Rio de Janeiro‏

‏Brazil‏

‏Partial‏

‏5.11‏

‏64.94‏

‏28.82‏

‏8.33‏

‏8.69‏

‏110‏

‏Mumbai‏

‏India‏

‏Partial‏

‏4.57‏

‏60.39‏

‏89.38‏

‏27.78‏

‏32.38‏

‏111‏

‏New Delhi‏

‏India‏

‏Partial‏

‏4.38‏

‏60.39‏

‏101.20‏

‏31.45‏

‏38.26‏

‏112‏

‏Antwerp‏

‏Belgium‏

‏Partial‏

‏4.29‏

‏75.92‏

‏4.10‏

‏1.01‏

‏1.26‏

‏113‏

‏Astana‏

‏Kazakhstan‏

‏Illegal‏

‏4.22‏

‏39.29‏

‏1.78‏

‏0.85‏

‏1.07‏

‏114‏

‏Montevideo‏

‏Uruguay‏

‏Legal‏

‏4.15‏

‏66.75‏

‏19.54‏

‏5.50‏

‏7.06‏

‏115‏

‏Johannesburg‏

‏South Africa‏

‏Illegal‏

‏4.01‏

‏48.80‏

‏3.76‏

‏1.45‏

‏1.92‏

‏116‏

‏Panama City‏

‏Panama‏

‏Illegal‏

‏3.85‏

‏56.52‏

‏0.81‏

‏0.27‏

‏0.37‏

‏117‏

‏Jakarta‏

‏Indonesia‏

‏Illegal‏

‏3.79‏

‏53.40‏

‏1.92‏

‏0.68‏

‏0.95‏

‏118‏

‏Asuncion‏

‏Paraguay‏

‏Partial‏

‏2.22‏

‏16.00‏

‏0.16‏

‏0.19‏

‏0.46‏

‏119‏

‏Bogota‏

‏Colombia‏

‏Partial‏

‏2.20‏

‏49.44‏

‏15.80‏

‏6.00‏

‏14.53‏

‏120‏

‏Quito‏

‏Ecuador‏

‏Partial‏

‏1.34‏

‏70.39‏

‏0.56‏

‏0.15‏

‏0.60‏

‏Methodology‏

‏Selection of the cities:‏

‏To select the cities for the study, Seedo first looked at the top and bottom cannabis consuming countries around the world. Then they analysed nations where marijuana is partially or completely legal, as well as illegal, and selected the final list of 120 cities in order to best offer a representative comparison of the global cannabis price. ‏

‏Data:‏

‏Price per gram, US$ ‏ ‏- Crowdsourced city-level surveys adjusted to World Drug Report 2017 of the United Nations Office on Drugs and Crime.‏

‏Taxes on Cigarettes, % of the most sold brand‏ ‏ – Taxes as a percentage of the retail price of the most sold brand (total tax). ‏ ‏Source‏ ‏: Appendix 2 of the WHO report on the global tobacco epidemic, 2015.‏

‏Annual possible tax collection is calculated in the following way: ‏

‏Total_Possible_Tax=Population_City*Prevalence*Avg_Consumption_year_gr*price*tax_level, where:‏

‏Population: latest available local population data sources.‏

‏Annual Prevalence (percentage of population, having used weed in the year). Source: World Drug Report 2017 of the United Nations Office on Drugs and Crime‏

‏Average Consumption of weed per year in grams (people who consumed weed at least once in the previous year). ‏

‏Estimation, with the assumption, that one use of weed on average means one joint. ‏

‏One joint is assumed to have 0.66 grams of weed as in the paper of Mariani, Brooks, Haney and Levin (2010). ‏

‏The distribution of use during the year is assumed to be the same as in Zhao and Harris (2004), where the yearly usage varies from once or twice a year to everyday.‏

‏Total Consumption in Tons‏

‏Consumption=Population*Prevalence*Consumption_year_gr‏

‏Population: latest available local population data sources.‏

‏Annual Prevalence (percentage of population, having used weed in the year). ‏ ‏Source‏ ‏: World Drug Report 2017 of the United Nations Office on Drugs and Crime‏

‏Average Consumption of weed per year in grams (people who consumed weed at least once in the previous year).‏

‏Estimation, with the assumption, that one use of weed on average means one joint. ‏

‏One joint is assumed to have 0.66 grams of weed as in the paper of Mariani, Brooks, Haney and Levin (2010). ‏

‏The distribution of use during the year is assumed to be the same as in Zhao and Harris (2004), where the yearly usage varies from once or twice a year to everyday. ‏

‏US tax level ‏ ‏- Average tax level in the states of US where weed is legal: Alaska, California, Colorado, Maine, Massachusetts, Nevada, Oregon and Washington. Includes retail sales taxes, state taxes, local taxes and excise taxes.‏

‏Legality‏

‏Legal, if possession and selling for recreational and medical use is legal.‏

‏Illegal, if possession and selling for recreational and medical use is illegal.‏

‏Partial, if ‏

‏Possession of small amounts is decriminalised (criminal penalties lessened, fines and regulated permits may still apply)‏

‏OR medicinal use legal‏

‏OR possession is legal, selling illegal‏

‏OR scientific use legal‏

‏OR usage allowed in restricted areas (e.g. homes or coffee shops)‏

‏OR local laws may apply to legality (e.g. illegal at federal level, legal at state level)‏

‏First quote: Based on New York City Council’s free lunch initiative which began in September 2017, with 1.1 million public school children, at a cost of $1.75 per child per day.‏

Being In Canada 54 Years And Involved In Social Change

This year, I have been in Canada 54 years. It is difficult to define what I need to do but I have to be more active, more involved in positive social change…….The state of Trumpism gnaws at me.
 
A few years ago, during March 2017, about 40 of my photographs (1967 – 1974) of Toronto’s Baldwin St. were exhibited at the Toronto Arts & Letters Club. I recently spoke at the Club about my experience as an immigrant in 1967 with a draft dodger avoiding the Vietnam War.    

Here is one of my photographs.

In Feb. of that same year, I was fortunate enough to have exhibited photographs at Unlovable Gallery that John Phillips (my ex-husband and late husband)  and I took of the American Civil Rights Movement. Last year, I gave a slide presentation at the Women’s Art Association on Canadian women photographers who worked between 1865 -1915.   Three projects – war resisters, civil rights, and feminism. 

…and this one taken Toronto City Hall

 
 My son, Bennett Jones Phillips, and his partner, Lisa Pereira are in the process of creating a record store on Baldwin St. and I am going to have an exhibition space- provided the current Covid epidemic is managed, controlled and finally defeated. (I had a gallery in the past on Baldwin). Here is a chance to be more active and socially involved.   My plan includes an expanded “coming to Canada” exhibit with blow ups of my and John’s photos and some pages of John’s FBI file and underground papers. It looks like the space will be a shipping container. The opening event will likely include having a tent in the former  Silverstein Bakery parking lot and having music, poetry, and a 60’s feel with Baldwin Street history – Irish, Jewish, Chinese, and American immigration being part of the  opening focus. 
 
There are lots of possibilities. I am very open to ideas and involvement of other people. So what do you think? Cheers, Laura Jones.
 

Tips For Planning A Corporate Holiday Party In Toronto

C:\Users\Renae\Downloads\friends-dance-at-formal-party.jpg

If you’ve been tasked with organizing your company’s holiday party in Toronto, you may find yourself overwhelmed with the responsibility. Even if it isn’t your first time planning one, you may be having flashbacks to last year and what a hassle it was to plan, and are now just dreading the idea of it.

Hopefully, these tips will help you get through the experience a little easier, and will inspire you on how to plan a great holiday party that everyone will love.

Top Priority: Food

People love food – it’s a known fact that one of the ways to make someone happy is to give them something great to eat. This is why it’s important that you hire the right Toronto-based corporate catering company for your holiday event.

Should you use the same one that will cater your next corporate lunch in Toronto or should you search for a company that can specializes in large-scale events? The answer is that it really depends on the company that you go with.

Take a look at their website and see if they only do small-scale catering or if they have a reputation for doing larger corporate events. Check out their reviews online so you can to get sense of how well they’ve performed in the past.

If you have good food at your holiday party, then the rest doesn’t really matter. All everyone will be talking about was how great their meal was.

Remember: Don’t Do it Alone

You might not want to bother other people about planning, but it will be a huge help to you and will also ensure the success of the event. Put together a team of people willing to help you out, and be sure to delegate. Consider assigning responsibilities like:

  • Someone to find a venue/designate space at the office
  • Someone who will order and arrange decorations
  • Someone to handle invites
  • Someone who will arrange transportation (if the party is off-site)
  • Someone who will handle entertainment

With this stuff out of the way, you can focus on the when.

When is the Best Time to Have a Company Party?

It’s generally thought that company parties are best held during lunch (though not everyone will always be able to make it) and on a Friday when there are typically less work responsibilities.

After-work parties that are held off-site are more expensive, as you need to pay the costs to rent out the space, as well as other factors like transportation options for guests. I.e. will you be reimbursing their taxi fare?

Don’t Forget IT

Your IT department is going to be your best friend during this time. Make sure to work closely with them so that if there is any presentation happening that you will be ready. You’ll need them to set up PowerPoint presentations, TV displays, or microphones, if there is going to be any speaking or entertainment.

If you work with them from the beginning and let your expectations be known sooner than later, you’re more likely to have a successful party without any hitches.

Just remember that it’s all about planning ahead of time to ensure a great event that people will be sure to love.

Why A College Of Kinesiology For Ontario?

FYI exercise is medicine image: www.hungry-runner.com

Toronto, Ontario  – The numbers are well-known – regular exercise can reduce the risk of heart disease by 40 per cent, lower the risk of stroke by 27 per cent, decrease the incidence of high blood pressure and diabetes by 50 per cent and lower the risk of colon cancer by 60 per cent.  Exercise has also been noted to reduce mortality and the risk of recurrent cancer by 50 per cent and to reduce the risk of developing Alzheimer’s by a third.

It is clear that the role of exercise and the profession of Kinesiology, as human movement professionals, will continue to grow.

“The creation of  the College of Kinesiology of Ontario set the stage for a significantly increased focus on the role of physical activity in both the prevention and a treatment of illness and chronic disease,” said Janice Ray, President of the Ontario Kinesiology Association.

But instead of being concerned with the single hour that clients and patients spend in the gym or rehab facility, many Kinesiologists are focusing on ways to help promote optimal health during the other 23 hours of the day as well.

Dr. Chris Ardern, a Kinesiology Professor at York University, and a Research Scientist at Southlake Regional Health Centre in Toronto, has spent his career focusing on obesity and physical activity and how they affect a number of other precursors to chronic disease.  Dr. Ardern has published or co-authored almost three dozen papers on obesity and physical activity.

Beyond the standard focus on leisure-time activity, says Dr. Ardern, more attention needs to be paid to curbing the sedentary time people spend at work or commuting. A focus on  daily routine from a more holistic point of view is required instead of just how much time is spent being “moderate-to-vigorously active” if we are to make a more significant impact on preventing obesity, chronic disease and other illnesses.

Like obesity, physical inactivity is now understood as a serious problem, says Dr. Ardern. He suggests that aggressive promotion of physical activity is vital to offseting the impact of obesity and chronic disease. For Kinesiologists who see the consequences of our current lifestyles every day, there is a sense of urgency to counter-act the relentless marketing surrounding foods high in fat and sugar, and the inactvie lifestyles that come from sitting in front of some kind of screen for hours on end.

“Every little bit helps,” says Ray, referring to every opportunity, nor matter how small, to get moving throughout the day.  “Modern lifestyles often don’t leave much time for dedicated physical activity, and too many if us aren’t even programmed to think about the little opportunities that can really make a difference.”

Here are some simple ideas to get you started:

·      Avoid elevators and escalators – take the stairs whenever possible (at least take them down if up is too much) ·      Park in the back corner of the shopping mall or workplace parking lot (spots are easier to find too) ·      Walk to the corner store (remember walking is a real mode of transportation) ·      You don’t have to be a smoker to get outside on your break, (go ahead, enjoy a breath of fresh air and move around) ·      Share a walk with your kids, spouse, significant other, sibblings, parents, friends etc. (it’s a great way to talk without having to look at each other, or just as good – not talk)

The important role of physical activity to reduce the risk of chronic disease are well documented.  Large and small efforts all combine to reduce the risks of many chronic diseases, and when combined with the benefits physical activity brings to the treatment and management of chronic disease and illness and the it becomes clear the Provincial Government should be including a greater focus on physical activity to improve outcomes for patients and improve the quality of life for the people of Ontario.

About Kinesiology
As authorities on movement and exercise, Kinesiologists are committed to enhancing quality of life through the promotion of physical activity and workplace safety, the prevention and management of injury and chronic disease, and the improvement of health and performance.

About the Ontario Kinesiology Association (OKA)
The Ontario Kinesiology Association (OKA) is the voice for Kinesiologists in Ontario. Actively working on behalf of its members, the OKA is dedicated to promoting Kinesiology as an integral part of Ontario’s healthcare team and raising the profile of the profession across the province. For the Silo, John Armstrong

My Road To VR Toronto Art

 My name is Olga and I’m a Virtual Reality VR artist/sculptor  based in Toronto,Ontario.  In 2016 I was hired by Google to create VR experience for YouTube Plus event. This was my first introduction to Google Tiltbrush.  I live painted the Toronto skyline in front of hundreds of people. 

 
Since then I was involved in Google projects and many other events and conferences. My VR works were featured on national media chains such as the CBC and Space Channel. I would very much like to share them with you as well. Since Russian is my native language, I often prefer to speak through video and if a picture is worth a thousand words then a video must be worth even more. 
 
The presentation “ My road to VR art”  is  about  how my  traditional art skills and experiences translated into the Virtual Reality VR world.
 
I am very passionate about this new medium. I have talent and humor and would love to work on big VR / AR art project. Perhaps there are others like me, looking to collaborate? I would be happy to hear from you.