Tag Archives: population growth

Stop Assuming Immigration Will Solve Canada’s Labour Crisis 

Newcomers increase consumption and spending, and are actually contributing to demand for labour in other sectors.

Study in Brief

  • This study investigates the effects of Canada’s expansive immigration policy, implemented between 2016 and 2024, on labour shortages. It explores how the influx of permanent and temporary immigrants has affected the balance between labour supply and demand, with attention to whether the policy has met one of its key objectives – alleviating shortages in labour markets.
  • It provides an analysis of labour market dynamics through the lens of the Beveridge curve, which tracks the joint path of unemployment and job vacancies over time. The study compares labour market tightness before, during, and after the pandemic and evaluates how rapidly rising immigration and the adoption of remote work have affected job vacancy rates in Canada.
  • The arrival of immigrant workers has expanded the supply of labour to employers, but has also generated additional income and spending, and hence greater demand for labour throughout the economy. The macroeconomic evidence from this study indicates that, on balance, the increase in demand generated by immigration has more than likely outpaced the additional supply, potentially making economy-wide labour shortages more widespread rather than alleviating them.

Introduction

Canada’s immigration levels began to accelerate in 2016, following a period of relative stability. From 2001 to 2015, the annual inflow of immigrants, including both permanent and temporary admissions, was reasonably stable at around 0.85 percent of the overall population. In the following years, despite a temporary contraction during the pandemic, this rate rose fourfold, reaching up to 3.2 percent of the population in 2023.

This post-2015 expansion was consistent with recommendations from the Advisory Council on Economic Growth, established by Minister of Finance Bill Morneau in 2016. The Council’s 2016 report suggested that the annual number of permanent economic immigrants should be increased from 300,000 in 2016 to 450,000 in 2021, and to nearly double this number later. Its stated objectives were to increase population growth, reduce the old age dependency ratio, generate a bigger GDP, and accelerate the rise in real GDP per capita by easing shortages of high-skilled workers and other means. Policymakers, encouraged by the perceived success of Canada’s immigration program, embraced the idea that higher immigration levels could deliver even greater economic and demographic benefits.1 The Council also urged the government to facilitate admissions of temporary workers and attract more international students. The government responded by increasing permanent immigration levels from 270,000 in 2015 to 480,000 in 2024, allowing uncapped increases in temporary immigration, and trying to address shortages of low- as well as high-skilled labour.

The C.D. Howe Institute’s research has shown that the benefits of immigration in mitigating population aging, and supporting the growth of GDP per capita, have been more limited than expected (Mahboubi and Robson 2018; Doyle, Skuterud and Worswick 2024). The present study is an attempt to assess whether the policy has succeeded in meeting the goal of easing the challenges employers face in finding suitable candidates for their job openings. The answer to this question has clearly been a big “yes” at the level of the individual employer. Many employers are benefiting from the contribution of their new immigrant workers, which is the basis for the unrelenting support for more immigration by representative national business organizations.

It is less clear whether immigration has helped alleviate labour shortages in the overall economy. Immigration not only expands the supply of labour, but also adds to the demand for labour. Putting more immigrants to work generates an expansionary multiplier effect on gross domestic product (GDP) and national income. As the additional income is spent on various consumption and investment goods by households, businesses and governments, the demand for labour increases. The net effect of immigration on the difference between supply and demand in the aggregate economy is, therefore, a priori uncertain. It could be negative or positive.

My goal in this study is to uncover what simple economic logic, and the statistical evidence from Canadian macrodata, reveal about the direction and quantitative importance of the net effect of rising immigration on the economy-wide balance between the demand for, and the supply of, labour. I find that the demand has likely matched or exceeded the supply and has therefore increased the overall job vacancy rate at any given level of unemployment.

Labour Shortages and Job Vacancies

What do “labour shortages” mean, and how have they evolved since Canada’s immigration rate began to increase eight years ago? Employers feel they are short of labour when the number of unfilled job openings significantly exceeds the number of available employees with the necessary skills and qualifications to meet their operational needs. Each month, Statistics Canada reports the extent of labour shortages in various sectors and regions from its Job Vacancy and Wage Survey. It is called the “job vacancy rate” and is an estimate of the number of job vacancies as a percentage of total labour demand, including all occupied and vacant salaried jobs.

Data on the job vacancy rate have been available since 2015 (Figure 1). After the oil-induced economic slowdown of 2014-2015, job vacancies increased from 2.3 percent of labour demand in mid-2016 to 3.3 percent in early 2020. No vacancy data were available from April to September 2020 due to a six-month pandemic-related pause in Statistics Canada’s survey. Moving through the spring 2020 recession, but with the unemployment rate still very high, job vacancies then increased swiftly, reaching a peak of 5.7 percent of all occupied and vacant jobs in the second quarter of 2022. But with the economic slowdown and slackened labour markets subsequently accompanying high interest rates, vacancies fell back to 3.0 percent of labour demand in the third quarter of 2024.

Immigration and Labour Supply and Demand

Since 2015, Canada’s job vacancy rate has fluctuated in response to three key macroeconomic factors: rising immigration, the pandemic, and fluctuations in aggregate economic activity.

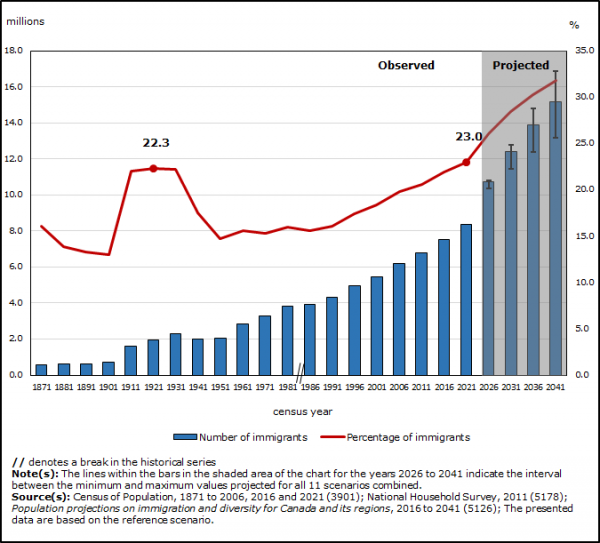
Immigration has risen steadily in recent years, with both permanent and temporary entries increasing in each non-pandemic year (Figure 2). Permanent admissions rose from 272,000 in 2015 to 472,000 in 2023. This upward trend was guided by the multi-year immigration-level targets set each year since 2017 by the government in its Annual Report to Parliament on Immigration. For example, the target for permanent admissions in 2023 was set at 465,000 in the 2022 Report.

Temporary immigration includes holders of study or temporary work permits, asylum seekers, and their family members. They are collectively referred to as “non-permanent residents” by Statistics Canada. Prior to 2024, temporary immigration was excluded from the government’s annual targets. It was uncapped and followed demand from businesses and educational establishments. The net annual addition to temporary permits (new entries less exits to permanent residence and to abroad) rose from basically zero in 2015 to 190,000 in 2019, and 821,000 in 2023 (Figure 2).

Overall, total immigration – the sum of permanent and temporary immigration – increased fivefold from 263,000 in 2015, to 1,293,000 in 2023. Was this fivefold surge in immigration over eight years able to lower the job vacancy rate and reduce labour shortages in the aggregate Canadian economy? How could it not? Prima facie, the arrival of new immigrant workers increases the supply of labour, allowing recipient employers to ameliorate their personnel gap, at least in part. The addition of immigrant labour might suggest the “common sense” inference that labour scarcity has been effectively eased up throughout the economy.

However, it is erroneous to assume that simply because immigration solves the personnel shortage of individual employers, it will necessarily solve the problem of labour scarcity in the aggregate economy.

The error comes from focusing narrowly on increasing the supply of labour, while neglecting the simultaneous increase in the demand for labour that is generated by immigration. With more immigrants in the workforce, employers can produce more goods and services and generate more income for themselves, their employees, and their suppliers – a good thing. However, to assess the overall effect of immigration on labour scarcity, it is crucial to consider that this additional income will be spent on various consumer and investment goods. Immigrants allocate their new income, along with any savings brought from abroad, to essentials such as food, clothing, housing, transportation, personal care, and leisure. In turn, employers and their chains of suppliers invest more in construction, machinery and intellectual property. Furthermore, immigrants, employers and suppliers all contribute to taxes, which governments allocate to meet the increased demand for social services, including public housing, education, and healthcare. The growing demand for private and public goods and services will expand aggregate labour demand.

In other words, the hiring of immigrants initially adds to the supply of labour, but it also ends up adding to the demand for labour once the new income generated is spent throughout the economy and a multiplier effect is generated on GDP. On net, it is a priori uncertain whether the supply increases more than the demand, in which case labour would be made less scarce overall, or whether it is the demand that increases more than the supply, in which case labour would be made scarcer.

As a first attempt to clarify the picture, let us see how the excess of labour supply over labour demand evolved from 2016 to 2024 (Figure 3). I take labour supply to be the entire labour force (all workers who are employed or are looking for work), and labour demand to be the sum of employment and job vacancies (all jobs that are occupied or ready to be filled). Expressed as a percentage of the labour force, the difference between the two – excess supply – boils down to the difference between unemployment and job vacancies. Excess supply goes up or down depending on whether unemployment increases more or less than job vacancies.

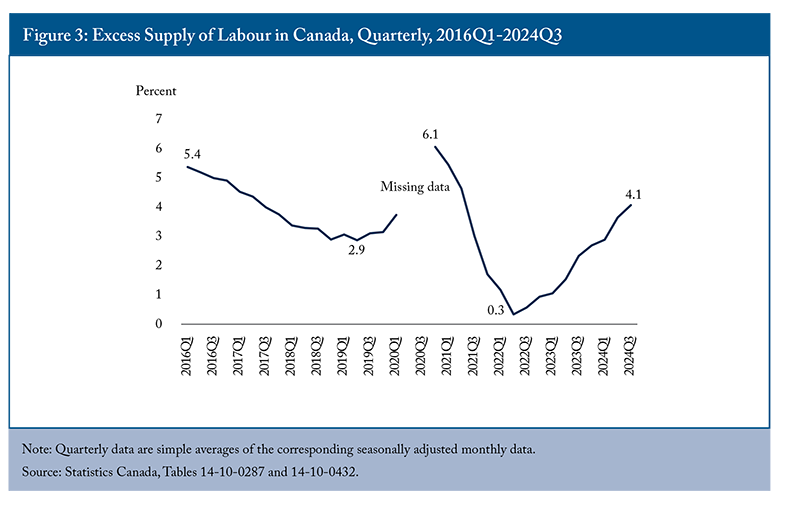
Figure 3 shows that the excess supply of labour has fluctuated widely since 2016. In the pre-pandemic period 2016-2019, it declined from 5.4 percent to 2.9 percent of the labour force. Labour became scarcer. During the pandemic year 2020, it shot up to 6.1 percent of the labour force. But in the aftermath, labour demand outpaced supply again so that by mid-2022 excess supply had dropped to a low of 0.3 percent of the labour force. Since then, it has risen back to 4.1 percent.

The time path of the excess supply of labour cannot alone determine whether the rise in immigration since 2016 has increased labour supply more or less than labour demand. Excess supply results from the interplay of three simultaneous determinants: rising permanent immigration and accelerating temporary immigration, the disruptions caused by the pandemic and its potential after-effects, and fluctuations in aggregate activity. For example, the declining excess supply in the pre-pandemic period 2016-2019 was the combined outcome of rising immigration and aggregate economic expansion. But the impact of rising immigration cannot be separated out from that of aggregate economic expansion by just looking at the trend in excess supply. Correctly identifying the net effect of each of the two factors requires a more comprehensive economic and statistical analysis of the data.

The Shifting Beveridge Curve

To identify the net effect of immigration on labour shortages, I will use a well-established tool called the Beveridge curve. The Beveridge curve offers valuable insights by highlighting the observed inverse relation between vacancies and unemployment.

William Beveridge (Beveridge 1960) used the unemployment rate as a main marker of fluctuations in aggregate activity, a practice business cycle analysts still follow to this day (Romer and Romer 2019; Hazell et al. 2022). He observed that vacancies and unemployment typically move in opposite directions through business cycles. He attributed the negative relationship to the pressure exerted by aggregate activity on economic potential. When aggregate economic activity was moving up to its full potential (as in Canada in 2016-2019), there were fewer unemployed workers and more job vacancies. Conversely, when activity was moving away from potential (as in Canada in 2023-2024), there were more unemployed workers and fewer job vacancies. Since 1960, this inverse relation between the job vacancy rate and the unemployment rate – now called the Beveridge curve – has played a key role in macroeconomic analysis of labour markets. It has been abundantly studied by researchers and has been identified in job vacancy and unemployment data in many countries (e.g., Blanchard and Diamond 1989; Pissarides 2000; Archambault and Fortin 2001; Elsby, Michaels and Ratner 2018; Michaillat and Saez 2021).

It is instructive to examine the trajectory of the Canadian unemployment – job vacancy relation in two-dimensional space from 2015 to 2024 (Figure 4). First, following the 2015 economic slowdown, the economic expansion of 2016-2019 brought a decrease in the unemployment rate and an increase in the job vacancy rate along a path that was consistent with a negatively sloped Beveridge curve. The sudden outbreak of the pandemic in early 2020 shattered this trajectory. The unemployment – job vacancy pair was sent far outward toward the northeast corner of the chart. From then until the end of 2021, it followed a new Beveridge curve to the northwest. During the recovery following the pandemic recession in the spring quarter of 2020, the unemployment rate decreased and the job vacancy rate increased along a path that was about parallel to that of 2015-2019, but at a much higher level. For instance, whereas the unemployment rate was the same in the summer quarter of 2021 as in the winter quarter of 2016 (7.25 percent), the job vacancy rate was twice as large in the former (4.2 percent) as it was in the latter (1.9 percent). Finally, as the pandemic faded, the unemployment – job vacancy pair did a loop to the west. A new post-pandemic Beveridge curve emerged along a southeasterly trend that looked parallel to, but somewhat higher than, the old pre-pandemic path of 2015-2019.2

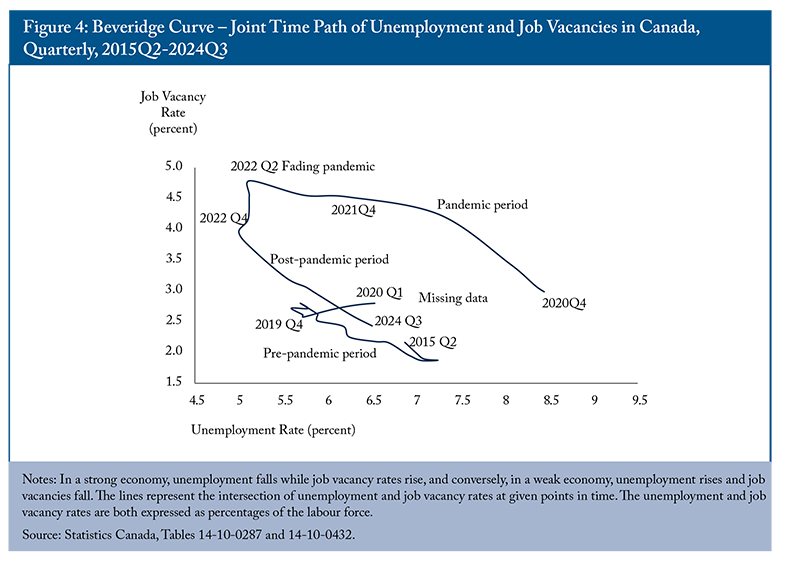
This visual check reveals that there have been three distinct periods in the inverse relationship between job vacancies and unemployment, known as the Beveridge curve: pre-pandemic, pandemic and post-pandemic. The start and end of the pandemic significantly affected the vertical position of the Beveridge curve in the unemployment – job vacancy space. Although the three branches are not perfectly aligned, they appear to be nearly parallel. According to the statistical results in Table 1 below, a one percent change in the unemployment rate corresponds to about a 1.5 percent change in the opposite direction in the vacancy rate – this is sometimes referred to as the Beveridge curve “elasticity.”

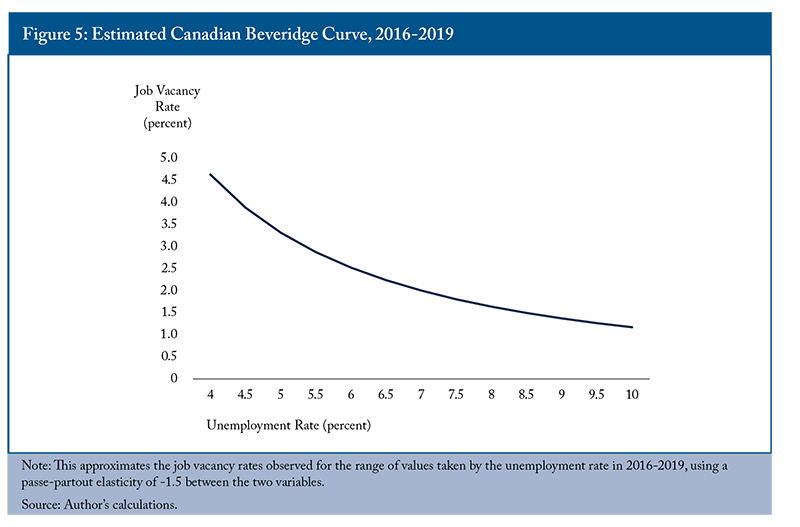
The shifts in the Canadian Beveridge curve during the pandemic are not an entirely unexpected development. Shifts have occurred from time to time in the past.3 As Figure 4 has shown, the Canadian Beveridge curve looked relatively stable before the pandemic in 2016-2019. Figure 5 is an idealized illustration of the position it occupied in the unemployment – job vacancy space in this period. However, starting in 2020, it shifted significantly. It first moved outward during the pandemic in 2020-2021 and then returned inward after the pandemic in 2022-2024.

As an initial assessment of the magnitude of these movements, I use the actual values of unemployment and job vacancies to calculate the implied monthly shifts in the Figure 5 Beveridge curve from January 2016 to October 2024. I then illustrate the implied vertical movements of the job vacancy rate corresponding to a given reference unemployment rate of 5.5 percent4 by averaging the results for each year from 2016 to 2024. The vertical height of the Beveridge curve calculated in this way increased from 2.8 percent in 2019 to nearly 6 percent in 2020-2021, and dropped back to 3.2 percent in 2024 (Figure 6).

The Beveridge curve’s elevation at around 3.2 or 3.3 percent in the post-pandemic period 2023-2024 is higher than its height of 2.8 or 2.9 percent in the pre-pandemic period 2018-2019. This can be attributed to shifts in the ratio of two background factors: the intensity of labour reallocation across occupations, industries and regions, and the efficiency of the matching process between job openings and job seekers (Blanchard, Domash and Summers 2022). At any given rate of unemployment, the job vacancy rate and the Beveridge curve will be higher in relation to the intensity of labour reallocation and the inefficiency of job matching.

The first factor, the intensity of labour reallocation, is captured by the monthly flow of hires as a percentage of the labour force. It is shown as an index with 2019 = 100 in Figure 7. It increased by some 10 percent during the pandemic of 2020-2021. Labour moved from transport industries and those requiring person-to-person contact toward electronic communications and home deliveries. There was a displacement from traditional businesses and occupations to those allowing work from home. However, in 2022-2024 labour reallocation calmed down and its intensity decreased by some 15 percent below its 2019 level. This pushed the Beveridge curve downward.

The second factor, the efficiency of job matching, reflects the capacity of labour markets to generate hires at the observed levels of unemployment and job vacancies. It is an index with 2019 = 100 in Figure 8. It experienced a sharp drop of nearly 20 percent during the pandemic (2020-2021). Factors contributing to this decline include the increasing physical distance between vacant positions and available candidates, as well as the widening gap between the demand for and supply of skills. Also, the rise in illnesses and the increased popularity of remote work during the pandemic likely may have contributed to a decline in job search intensity. As a result, employers found it more difficult to match job offers with suitable job seekers. Matching efficiency did not recover from 2022-2024. It remained some 20 percent below its pre-pandemic level of 2018-2019. This pushed the Beveridge curve upward.

Going from 2019 to 2024, movements in labour reallocation and matching efficiency had opposite effects on the height of the Beveridge curve. But the upward pressure on the curve from the 20 percent drop in matching efficiency was greater than the downward pressure from the 15 percent decline in labour reallocation. Therefore, as already pictured in Figures 4 and 6, the net outcome is that, going over the pandemic, the Beveridge curve wound up at a higher level in 2024 than in 2019, implying a higher job vacancy rate for any given unemployment rate.

So far, I have used the Beveridge relation between job vacancies and unemployment as a broad interpretive framework for macroeconomic developments in Canada over the 2015-2024 period. First, I have focused on the effect of fluctuations in aggregate economic activity (captured by changes in unemployment) on the job vacancy rate. Second, I have noted that the onset and ending of the pandemic have been big shifters of this unemployment – job vacancy trade off upward in 2020-2021 and downward in 2022-2024. Nevertheless, third, I have shown that, mainly due to a persistent 20 percent drop in job matching efficiency since 2019, the Canadian Beveridge curve was occupying a higher vertical position in 2023-2024 than before the pandemic.

In addition to the pandemic, Canada’s immigration policy, characterized by rising immigration levels, is another major development that has impacted labour markets in recent years. Like the pandemic, this policy may have affected the level of the unemployment rate along the Beveridge curve, as well as the vertical position of the curve, through its impacts on labour reallocation and matching efficiency. The following sections try to assess the existence and magnitude of these potential effects of immigration.

Economic Logic

The Beveridge framework can be used to explain how the expansion of immigration in Canada before and after the pandemic could have produced a lasting decrease or increase in labour shortages. Excluding the pandemic’s influence, rising immigration may affect aggregate labour shortages in two mechanical ways: by causing labour markets to slide up or down along the Beveridge curve, or by shifting the entire position of the Beveridge curve upward or downward, resulting in a larger or a smaller number of job vacancies for any given unemployment rate.

The first scenario involves a slide along the Beveridge curve. If rising immigration moves the economy up and to the northwest, unemployment decreases and vacancies increase; if the economy descends to the southeast, unemployment increases and vacancies decrease, as shown in Figure 5.

A permanent increase in unemployment along a given Beveridge curve is not what is generally hoped for by policymakers and the public. We want to achieve a permanent reduction in labour scarcity without being forced to suffer a permanent increase in unemployment. Nevertheless, it is important to understand how rising immigration could impact unemployment permanently, such that a higher or lower unemployment rate would be structurally needed to keep inflation low and stable over time.

A rough check on whether a higher immigration rate has raised or lowered the national unemployment rate consists of seeing if the excess of the national rate over the rate of the experienced group, formed by the Canadian-born plus the immigrants landed more than five years earlier, was higher or lower in 2023 than in 2015. Labour force data indicate that the excess of the national rate over the rate of this experienced group did increase in this period, but by just 0.1 percentage point, owing essentially to the rising labour force share of immigrants landed less than five years earlier. Seen in this light, rising immigration does not seem to have had a meaningful direct effect on structural unemployment. This result is consistent with research by Dion and Dodge (2023), who found no significant change in the national unemployment rate needed to keep inflation stable, known as the noninflationary rate of unemployment, that could be attributed to rising immigration.

It is a relief to see that rising immigration has not entailed a permanent reduction in the job vacancy rate by permanently pushing the national unemployment rate upward. There is evidence, though, that rising immigration has led to greater cyclical volatility of unemployment. First, the phenomenal expansion in the number of new residents since 2021 is known to have contributed to the strong demographic pressure on the demand for housing and, hence, to the significant increase in the cost of rented and owned accommodation. The Bank of Canada has acknowledged that the persistence of high shelter inflation consequently acts “as a material headwind against the return of inflation to the 2 percent target” (Bank of Canada 2024). In other words, through this channel, rising immigration is prolonging the current period of slower growth and higher unemployment. Second, the difference in cyclical sensitivity of the unemployment rate, between the above-defined experienced group and immigrants landed less than five years earlier, seems to have increased. In the economic slowdown during the spring quarter of 2024, the unemployment rate was 4.0 points higher than a year before for immigrants landed less than five years earlier, but only 0.7 point higher for the experienced group. The difference of 3.3 points between them was larger than in the 2009 and 2020 recessions. It could be due in part to the rising share of the low-skilled population of immigrant workers, which is more exposed to layoffs.

This study is primarily concerned with the permanent structural effects of rising immigration on unemployment, which look small, and not with the short-term economic and social costs associated with the greater cyclical volatility of unemployment around its steady state. Nevertheless, the possibility that these short-term costs are real should be kept in mind. Easing labour scarcity by tolerating more unemployment, whether of the short- or long-term variety, is an outcome our policies should try to avoid.

The other way rising immigration may have impacted aggregate labour shortages is by moving the vertical position of the entire Beveridge curve up or down in the unemployment-job vacancy space. Ultimately, we want to know whether rising immigration has increased the job vacancy rate and worsened labour shortages, or whether it has decreased the vacancy rate and alleviated the shortages, at every given level of unemployment.

The combined visual evidence presented by Figures 4 to 8 above implies that the Beveridge curve did shift upward somewhat from the pre-pandemic to the post-pandemic period, particularly due to a persistent 20 percent drop in job matching efficiency. Has rising immigration in Canada contributed to this evolution? Bowlus, Miyairi and Robinson (2016) conducted a longitudinal study of the job search behaviour of immigrants to Canada in 2002-2007. Results imply that heightened immigration may reduce matching efficiency in the short run, as new immigrants often face a lower rate of job offers than natives during their initial integration period. Based on US data, Barnichon and Figura (2015) focused on the two primary determinants of aggregate matching efficiency: worker heterogeneity and labour market segmentation. They pointed out that matching efficiency would decline if workers with a lower-than-average search efficiency became more represented among job seekers, or if the dispersion between tight labour submarkets and slack ones increased. These two conditions would seem to apply to the Canadian context with rising immigration. Lu and Hou (2023) have identified a major shift of immigration toward lower-skilled workers, and a significant relative tightening of labour markets such as construction, accommodation, food, business support services, education, healthcare, and social services. The statistical analysis below will provide a test of whether in recent years rising immigration has in fact shifted the Beveridge curve upward and intensified labour scarcity, or not.

Rising immigration is not the only macroeconomic development that may conceivably have affected aggregate labour shortages in the post-pandemic period. It is entirely conceivable that some of the changes triggered suddenly by the pandemic shock may have persisted into the post-pandemic era. Potentially, the most important of these is the widespread shift to work from home (Aksoy et al. 2023). The pandemic can be seen as a mass natural experiment that brought millions of workers in Canada, and other countries, to suddenly experience more work from home, to value its benefits, and to stick to it thereafter, often with a surprising upside in productivity.

The percentage of Canadian workers aged 15 to 69 who work most of their hours from home was 7 percent in early 2020. It sprang to 41 percent in the great confinement month of April 2020, and then declined as the pandemic evolved and faded out. But it was still holding up around 20 percent in the first half of 2024, which was three times as large as the 7 percent of early 2020.

The large increase in the percentage of Canadians working primarily from home has introduced an increase in worker heterogeneity compared to the pre-2020 period. With more workers satisfied with their work from home, fewer are incentivized to seek new jobs, particularly of the traditional variety. Following the Barnichon and Figura (2015) result, this could partly explain the reduction in job matching efficiency that has so far kept the Beveridge curve at a higher level than otherwise.

The economic logic developed in this section suggests that rising immigration and increased work from home may have contributed to the 20 percent loss of matching efficiency that has kept the post-pandemic height of the Canadian Beveridge curve at a level higher than before the pandemic. (However, fully confirming this hypothesis is beyond the scope of this study).

Statistical Analysis

This section summarizes an analysis of the factors influencing job vacancies in Canada, focusing on immigration and the rise of work-from-home arrangements. Introducing the rate of work from home as a factor is done to verify whether the shift to work from home that was initiated by the pandemic, but persisted in 2022-2024 (Schirle 2024), affected the position of the Beveridge curve.5

The analysis spans six Canadian regions – Atlantic Canada, Quebec, Ontario, the Prairies (Manitoba and Saskatchewan), Alberta, and British Columbia – across the periods from 2015 to 2019 (pre-pandemic) and 2022 to 2024 (post-pandemic).

Table 1 summarizes the key findings of the statistical results. Consistent with expectations, it shows that the Beveridge relationship between vacancies and unemployment is negative, with a precisely estimated elasticity of -1.42 in the two models. The results also show that immigration has been a significant contributor to the rise in job vacancies in Canada. Specifically, Model 1 estimates that a one percentage point increase in the immigration rate is associated with an 8.12 percent increase in the job vacancy rate after one year. It suggests that rising immigration has pushed the Beveridge curve upward, increasing the job vacancy rate at each unemployment rate over the period. However, when accounting for the rise in work-from-home arrangements in Model 2, the effect of immigration is smaller, at 3.21 percent,6 reflecting the additional impact of remote work.7 The positive effect of work-from-home arrangements is estimated at 0.85 percent.

These results suggest that both factors – immigration and remote work – have played a significant role in pushing the Beveridge curve upward, making it more difficult to match available workers with job openings.

While both factors contribute to the rise in job vacancies, their high correlation complicates the ability to isolate their individual effects. The correlation between immigration and remote work is particularly strong, which makes it challenging to assess their independent impacts.8 As a result, the evidence for immigration’s effect on job vacancies in Model 2 is less powerful than it would be if the data allowed sharper estimation.9 However, the findings from Model 2 indicate that the combined effects of both immigration and remote work have contributed to higher job vacancies, suggesting that increasing immigration alone is unlikely to solve labour shortages in the short term.

To be specific, statistical calculation of Model 2 indicates an 82 percent chance that rising immigration has left the job vacancy rate unchanged or raised it, and only an 18 percent chance that it has lowered it.10 In other words, increased immigration is more than four times as likely to have raised the aggregate demand for labour by as much as, or more than, the supply than to have increased it by less than the supply. In short, it is unlikely that rising immigration in Canada has helped the country solve its economy-wide problem of labour shortages by reducing the job vacancy rate at any given unemployment rate.

A natural question is whether the effect of immigration on job vacancies varies between permanent and temporary immigration. So far, an expanded version of Model 2, which distinguishes between these factors by analyzing the permanent and temporary immigration rates separately, has found no significant difference in their four-quarter total effects.11 Future analyses could benefit from disaggregating data by industry, as the impact of immigration and working from home may vary across sectors. For instance, remote work affects sectors like technology differently than it does retail or construction.

Discussion and Conclusion

This paper’s conclusion, drawn from statistical analysis of the macrodata runs, is contrary to the views of business organizations, which have campaigned relentlessly in favour of increases in permanent and temporary economic immigration in the past several years (e.g., Business Council of Canada 2022; Canadian Manufacturers & Exporters 2023; Canadian Federation of Independent Business 2021; Conseil du patronat du Québec 2022). Their position is understandable and grounded in a genuine concern to address labor shortages. By filling the vacancies, economic immigration enables firms to produce more and maintain or increase profitability.

The evidence presented here does not question the important role immigration can play for individual employers, whose need for additional employees is acute and urgent. However, in economics, everything depends on everything. The direction and importance of a phenomenon, confirmed at a microeconomic level with regard to a particular business, government organization, or sector, can be different or even reversed at the macroeconomic level, once all spillovers into the rest of the economy are accounted for. In his 1955 introductory textbook, the renowned American economist Paul Samuelson warned against the risk of the “fallacy of composition,” where it is assumed that what is true for individual parts is automatically true for the whole economy.

In the case of immigration, the fallacy of composition consists of believing that the advantages accruing to employers that hire immigrants can simply be added up and said to extend to the whole economy. What the present study has uncovered is that this belief is not corroborated by the macroeconomic evidence from the recent experience of Canadian regions. It is true that immigration eases up the dearth of personnel in firms that hire newcomers, which is clearly a good thing. But it is also true, conversely, that it worsens the shortage of labour in industries that must cater to the additional demand for goods and services generated by the addition to total GDP. The induced increase in the demand for labour in the aggregate economy can offset or even exceed the initial expansion of supply, so that it contributes to amplify economy-wide labour shortages on net. The insights I have extracted from Canadian regional data suggest that rising immigration has more likely redistributed or increased labour scarcity across the economy than reduced it overall. The political implication is that, if labour shortages persist or increase in the whole of the country despite fast-rising immigration, the insistent demand of business organizations for more immigration will not calm down; labour shortages will persist or intensify.

The vision of immigration as an economy-wide offset to labour scarcity is also reductionist. To take account solely of the hoped-for benefits accruing directly to employers of new immigrants overlooks the fact that immigration is a global and transformative phenomenon. The purpose of immigration is not only to serve the interests of a particular group. It is of concern to a whole society for reasons that are no doubt partly economic, but also demographic, cultural, social, and humanitarian. Society is morally obligated to welcome and integrate all immigrants in the most humane manner. This requires much time and money. Society must also make sure that the pace of immigration is not so fast that it leads ethnic groups to “hunker down” (as Putnam 2007 found) and provokes serious economic disequilibria in sectors that must absorb the induced increase in demand, such as construction, housing, health, education and social services. The overall pace and composition of immigration must balance individual interests against the challenges it brings to society.

Among these costs are the negative potential repercussions on productivity and wage growth stemming from the open-door immigration policy that Canada has followed until recently. Two key implications merit attention. First, investment in housing, business investment to equip newcomers with required physical and human capital, and government investment in public infrastructure to provide social services have not been able to keep pace with fast-rising immigration. Second, the open-door policy has made it easy for employers to rely on low-skilled foreign workers to meet high labour demand, which has been concentrated in low-wage industries (Lu and Hou 2023). While immigration alleviates immediate labour shortages, it may suppress wage increases that would otherwise occur as labour markets tighten and affect capital investments.

For example, in the 12 months leading to 2024Q3, overall wages increased by 4 percent, outpacing inflation at 2 percent, but sectoral differences were stark: wages grew by 3.2 percent in the business sector compared to 6.3 percent in the non-commercial sector. These dynamics suggest that wage growth patterns are influenced by a blend of short-term factors and structural shifts, including immigration trends.

Data also show that business sector labour productivity in Canada is on a slippery slope. From 2021Q3 to 2024Q3, output per hour went down cumulatively by 2.3 percent, whereas it would have gone up by 3.2 percent if it had increased at the same rate as in 1999-2019 (Statistics Canada, table 36-10-0206). While there are many factors behind this slowdown in productivity growth, the high immigration rate may have been a contributor.

In March 2024, the government suddenly announced a reversal of its immigration policy. Immigration Minister Marc Miller committed his department to cutting Canada’s non-permanent resident population from 6.5 percent of the overall population in early 2024 to 5 percent in early 2027. In November, details of the plan were set in the 2024 Annual Report to Parliament on Immigration (Government of Canada 2024, Annex 4). There would be 446,000 fewer entries of new non-permanent residents than exits in each of 2025 and 2026. Annual temporary immigration would be negative to this extent. The Annual Report also announced that the annual target for admissions to permanent immigration would be reduced from 485,000 in 2024 to 395,000 in 2025, 380,000 in 2026 and 365,000 in 2027.

If implemented as intended, scaling back the number of temporary and permanent immigrants will impact Canada’s aggregate labour supply significantly in 2025-2027. The working-age (15-64) population will stagnate instead of increasing by 800,000 or more, as it did in each of 2023 and 2024. An implication of the evidence reported above in Table 1 is that labour demand will likely decline alongside the reduction in labour supply because there will be 800,000 fewer consumers in the Canadian economy. While this policy reversal may not directly address the job vacancy rate, it could reduce vacancies by decreasing the overall demand for labour. As a result, while Canada’s aggregate GDP may contract, GDP per capita could increase, particularly if a smaller portion of national savings is directed toward demographic investments and the composition of immigration shifts toward fewer low-skilled immigrants.

The government’s policy reversal is a first step toward moderation. While it presents challenges, it also offers opportunities for improvement. When employers do not have the luxury of recruiting a rising stream of newcomers who are willing to accept low wages, it may push them to invest more in technology and work reorganization, and hence increase productivity. Furthermore, with a more moderate immigration level, the issue of the lack of absorptive capacity in the economy to provide enough skill-equivalent jobs to high-skilled immigrants will be less acute. Immigrants will see their skill utilization increase and their overqualification rate decrease. This shift could enhance Canada’s ability to attract global talent, aligning with the 2016 recommendation from the Advisory Council on Economic Growth that immigration should help address the shortage of high-skilled workers.

Appendix: Statistical Methodology and Data

This appendix provides a detailed description of the statistical analysis conducted to assess the factors influencing the job vacancy rate in Canada. The analysis spans 27 non-pandemic quarters, covering two periods: 2015Q2 to 2019Q4 (pre-pandemic) and 2022Q4 to 2024Q3 (post-pandemic). It includes data from six Canadian regions – Atlantic Canada, Quebec, Ontario, the Prairies (Manitoba and Saskatchewan), Alberta, and British Columbia. Each of these regions has a population of more than 2 million.

The dataset consists of 162 observations, representing the six regions across the 27 quarters. All labour market and population data are sourced from publicly available Statistics Canada tables. The job vacancy rate and unemployment rate are expressed as ratios of seasonally adjusted job vacancies and unemployment to the labour force. These variables are logarithmically transformed to account for the convexity of the Beveridge curve.

To estimate the relationship between job vacancies and its key determinants, two regression models are specified:

• Model 1 includes the unemployment rate, the immigration rate (measured as the total number of new permanent immigrants and net additional non-permanent residents relative to the population, annualized), and three unconstrained lagged values of the immigration rate.

• Model 2 builds upon Model 1 by including the rate of work from home as an additional explanatory variable. The work-from-home rate is the fraction of workers aged 15 to 69 who work most of their hours from home in their main jobs. This model tests whether the pandemic-induced shift to remote work, which persisted post-pandemic, has affected the Beveridge curve and the job vacancy rate.

Both models incorporate regional and seasonal fixed effects to account for regional disparities and seasonal fluctuations in the labour market.

For the Silo, Pierre Fortin.

The author is grateful to Mario Fortin, Gilles Grenier, Jeremy Kronick, Nicolas Marceau, Parisa Mahboubi, Pascal Michaillat, Mario Polèse, Statistics Canada data analysts, Mikal Skuterud, Daniel Schwanen, Christopher Worswick and several anonymous referees for valuable comments and suggestions. The author retains responsibility for any errors and the views expressed.

References

Advisory Council on Economic Growth. 2016. “The Path to Prosperity: Resetting Canada’s Growth Trajectory.” Report of the Advisory Council on Economic Growth to the Minister of Finance of Canada. October.

Ahn, Hie Joo, and Leland Crane. 2020. “Dynamic Beveridge curve accounting.” Finance and Economic Discussion Series 2020-27. Board of Governors of the Federal Reserve System, Washington. March.

Aksoy, Cevat Giray, Jose Maria Barrero, Nicholas Bloom, Steven Davis, Mathias Dolls and Pablo Zarate. 2023. “Working from home around the world.” Brookings Papers on Economic Activity, Fall 2022, 281-330.

Archambault, Richard, and Mario Fortin. 2001. “The Beveridge Curve and Unemployment Fluctuations in Canada.” Canadian Journal of Economics 34(1): 58-81.

Bank of Canada. 2024. Monetary Policy Report. Ottawa, January.

Barlevy, Gadi, Jason Faberman, Bart Hobijn and Ayşegül Şahin. 2024. “The Shifting Reasons for Beveridge Curve Shifts.” Journal of Economic Perspectives 38(2): 83-106.

Barnichon, Régis, and Andrew Figura. 2015. “Labor market Heterogeneity and the Aggregate Matching Function.” American Economic Journal: Macroeconomics 7(4): 222-249.

Beveridge, William. 1960. Full Employment in a Free Society. Second edition. London: Allen & Unwin.

Blanchard, Olivier, and Peter Diamond. 1989. “The Beveridge Curve.” Brookings Papers on Economic Activity (1)1-67.

Blanchard, Olivier, Alex Domash, and Lawrence Summers. 2022. “Bad news for the Fed from the Beveridge space.” Policy Brief. Peterson Institute for International Economics. July.

Bok, Brandyn, Nicolas Petrosky-Nadeau, Robert Valetta, and Mary Yilma. 2022. “Finding a soft landing along the Beveridge curve.” Economic Letter. Federal Reserve Bank of San Francisco. August.

Bowlus, Audra, Masashi Miyairi and Chris Robinson. 2016. “Immigrant job search assimilation in Canada.” Canadian Journal of Economics 49(1): 5-52.

Business Council of Canada. 2022. Report on Canada’s Immigration Advantage. Ottawa, June. At Canada’s immigration advantage | Business Council of Canada (thebusinesscouncil.ca)

Canadian Federation of Independent Business. 2021. “Using Immigration Programs to Overcome Labour Shortage Problems.” Ottawa. May. At Using immigration programs to overcome labour shortage problems | CFIB (cfib-fcei.ca)

Canadian Manufacturers & Exporters. 2023. Manufacturing Canada’s Future. Ottawa, November. At 2023-CME-Report-Manufacturing-Canadas-Future_Final-2_web.pdf (cme-mec.ca)

C.D. Howe Institute. 2024. “Graphic of the week: Canada’s plan to cut non-permanent residents by 30 percent by early 2027.” At Graph of the Week: Canada’s Plan to Cut Non-Permanent Residents by 30 Percent by Early 2027 | C.D. Howe Institute | Canada Economy News | Canadian Government Policy (cdhowe.org)

Century Initiative. 2024. “Canada’s Immigration Reality Check.” In National Scorecard on Canada’s Growth and Prosperity. Ottawa. November. At 665f8b1d9f801b398e1926db_Century Initiative Full Report 2024 – EN.pdf (website-files.com)

Conseil du patronat du Québec. 2022. Livre blanc sur l’immigration: Portait et solutions. Montréal, May. At Livre blanc sur l’immigration – Portrait et solutions | Conseil du patronat du Québec (cpq.qc.ca)

Dion, Richard, and David Dodge. 2023. “Labour force growth and labour market gap in Canada: 2011 to 2032.” Working Paper. Ottawa: Bennett Jones, May.

Doyle, Matthew, Mikal Skuterud and Christopher Worswick. 2024. Optimizing Immigration for Economic Growth. Commentary No. 662. Toronto: C.D. Howe Institute.

Elsby, Michael, Ryan Michaels and David Ratner. 2015. “The Beveridge Curve: A Survey.” Journal of Economic Literature 53(3): 571-630.

Fortin, Pierre.2024. “Does immigration help alleviate economy-wide labour shortages?” Working Paper #70, Canadian Labour Economics Forum, University of Waterloo. May.

Government of Canada. 2024. 2024 Annual Report to Parliament on Immigration. Immigration, Refugees and Citizenship Canada. October.

Hazell, Jonathon, Juan Herreño, Emi Nakamura, and Jón Steinsson. 2022. “The Slope of the Phillips Curve: Evidence from US states.” Quarterly Journal of Economics 137(3): 1299-1344.

Lam, Alexander. 2022. “Canada’s Beveridge curve and the outlook for the labour market.” Staff Analytical Note 2022-18, Bank of Canada, Ottawa. November.

Lu, Yuqian, and Feng Hou. 2023. “Foreign workers in Canada: distribution of paid employment by industry.” Economic and Social Reports. Catalogue No. 36-28-0001. Ottawa: Statistics Canada. December.

Mahboubi, Parisa, and William Robson. 2018. “Inflated Expectations: More Immigrants Can’t Solve Canada’s Aging Problem on Their Own.” E-Brief. Toronto: C.D. Howe Institute.

Michaillat, Pascal, and Emmanuel Saez. 2021. “Beveridgean unemployment gap.” Journal of Public Economics Plus 2. December.

Morissette, René, Vincent Hardy and Voltek Zolkiewski. 2023. “Working most hours from home: new estimates for January to April 2022.” Analytical Studies Branch Research Papers Series. Catalogue no. 11F0019M, No. 472. Ottawa: Statistics Canada. July.

Pissarides, Christopher. 2000. Equilibrium Unemployment Theory. Cambridge MA: MIT Press.

Putnam, Robert. 2007. “E Pluribus Unum: Diversity and community in the twenty-first century: The 2006 Johan Skytte Prize Lecture.” Scandinavian Political Studies 30(2): 137-174.

Romer, Christina, and David Romer. 2019. “NBER business cycle dating: Retrospect and prospect.” Paper prepared for the session “NBER and the Evolution of Economic Research, 1920–2020” at the ASSA Annual Meeting, San Diego, California, January 2020. Department of Economics, University of California, Berkeley.

Samuelson, Paul. 1955. Economics: An Introductory Analysis. New York: McGraw-Hill.

Schirle, Tammy. 2024. “Settling into a New Normal? Working from Home across Canada.” E-Brief. Toronto: C.D. Howe Institute.

Shimer, Robert. 2012. “Reassessing the Ins and Outs of Unemployment.” Review of Economic Dynamics 15(2): 127-148.

Statistics Canada. 2024. Job vacancies, third quarter 2023. January 18. https://www150.statcan.gc.ca/n1/en/daily-quotidien/240118/dq240118c-eng.pdf?st=36gTb__Z

What Can Be Done About Canada’s Debt Problem?

Presenters at last year’s C.D. Howe Institute’s conference on Canada’s debt problem had some pointed advice for our federal and provincial governments:

  • Canada’s public debt should be reduced about 10 percentage points of Canada’s GDP to ensure fiscal policy can be used to cushion the effects of future economic crises. Since major crises happen frequently, prudence suggests that the target should be achieved before the decade is out.
  • Tax increases harm economic performance, so elimination of public spending that does not provide enough benefits to offset this damage should be the first step in reducing deficits and debt. This will require undertaking comprehensive value-for-money assessments to identify wasteful spending.
  • Post-conference analysis found that achieving this prudent debt target would require increasing the combined federal-provincial primary balance by 1.4 percent of GDP, or $43 billion, starting in 2025/26. This amount includes a buffer – ensuring an 80 percent probability of meeting the debt target – to account for inevitable economic downturns, other crises that raise deficits and debt, and the uncertainty posed by fluctuating interest rates on financing costs.
  • The conference was one of four on deficits and debt held in Canada over the past 40 years. A clear and consistent message from these conferences – which politicians have yet to fully absorb – is that debt has economic costs and, therefore, imposes a burden on future generations. In this Commentary, the authors report on, and offer their analysis of, the findings of the latest conference.

Introduction

Does Canada have a debt problem? The answer from a recent C.D. Howe Institute conference is a resounding “yes.” Canada’s public debt should be about 10 percentage points of GDP lower to ensure sustainability. Given that major crises, which put upward pressure on deficits and debt, happen frequently, this target should be achieved before the decade is out.

The May 2024 conference was one of four on deficits and debt held in Canada over the past 40 years. Each aimed to provide guidance to policymakers on managing deficits and debt. While a common thread was concern about the economic cost of public debt, each conference provided context-specific policy advice.

The first conference, “Deficits: How Big and How Bad?” (Conklin and Courchene 1983), occurred when debt levels were rising rapidly but still relatively low. The key policy issue then was whether fiscal consolidation or expansion to support the economy was appropriate.

In the 1994 conference, “Deficit Reduction – What Pain, What Gain?” (Robson and Scarth 1994), and the 2002 conference, “Is the Debt War Over?” (Ragan and Watson 2004), there were clear recommendations to reduce debt levels. In 1994, this was motivated by concerns over economic damage caused by debt approaching 100 percent of GDP and questions about fiscal sustainability. By 2002, although the debt ratio had fallen substantially, further debt reduction was still advocated to reduce the burden on future generations who will not benefit from the spending.

A combination of discretionary measures and sustained economic growth led to a substantial reduction in the combined federal-provincial debt ratio from 2002 until the global financial crisis of 2007-2009. The debt ratio stabilized at a relatively high level after the crisis until the pandemic. The massive increase in debt during the pandemic and subsequent government spending raised the overall federal-provincial net debt ratio to about 75 percent of GDP, nearing levels from the time of the “Debt War” conference. This surge, combined with concerns about further increases, refocused attention on debt sustainability. This concern was reflected in the May conference, “Does Canada Have a Debt Problem?”, which recommended a debt target based on the need for fiscal prudence.

The latest conference included sessions on the economic costs of debt, the sustainability of federal debt, guidance for policymakers on a prudent and fair debt target, and reforming the federal fiscal framework. However, given the one-day format, not all issues could be thoroughly addressed. This report not only summarizes the proceedings but also fills some gaps by providing additional analysis to complement the presenters’ advice.

Economic Costs of Public Debt

Interest expenses were central to the analysis by University of Calgary economist Trevor Tombe of the economic costs of public debt. Interest paid on the public debt is often considered a transfer among individuals with no real impact on the economy. However, higher interest payments for a given level of program spending necessitate higher taxes, which harm economic performance by affecting incentives to work, save and invest. If not financed by tax increases, higher interest payments will crowd out valued program spending.

When discussing the opportunity cost of interest payments – the benefits of lower tax rates or higher program spending – Tombe cited work by Dahlby and Ferede (2022). They estimate the economic cost of raising an extra dollar of tax revenue, referred to as the “marginal cost of public funds” (MCPF). The MCPF includes both the dollar taken from the private sector and the loss in output per dollar of tax revenue raised due to reduced incentives to work, save and invest. Higher taxes shrink the tax base not only because of reduced economic activity but also due to efforts to reduce taxable income without changing economic behaviour.

Dahlby and Ferede (2022) find a very high cost from raising taxes. For the corporate income tax, the federal MCPF in 2021 was approximately two.1The MCPF from raising the top federal personal income tax rate has been higher than its corporate tax counterpart since 2012, when the corporate tax rate was reduced to 15 percent. The gap increased in 2016 when the top federal marginal personal income tax rate increased to 33 percent, pushing the MCPF to about 2.9.

The federal government expects to pay $54.1 billion in public debt charges in the current fiscal year. The economic cost of these payments is substantial. If the opportunity cost of these payments is lower corporate income taxes, their economic cost would also be about $54 billion. If their opportunity cost is a lower top personal income tax rate, their economic cost would exceed $100 billion. If the contribution from corporate income and top personal income tax were equal, the economic cost would be about $75 billion.

Other costs of public debt arise from a reduction in the national savings rate, which is the sum of public and private sector savings rates. Government deficits represent public sector dissaving, so with a constant private savings rate, national savings will decline when governments run deficits. Tombe highlighted the impact of lower national savings on investment, presenting data showing a negative correlation between debt ratios and investment ratios across countries (Figure 1). He stated there is “probably” a causal relationship between higher debt ratios and lower investment ratios.

Although Tombe did not elaborate, there are reasons to be circumspect about asserting causality. One reason is that the private savings rate may rise in response to budget deficits if economic agents anticipate higher future taxes to service the debt. Households might increase savings in anticipation, partially offsetting the decline in national savings. There is evidence that expansionary fiscal policy is partially offset by increased household savings. Johnson (2004) concluded that household savings would increase by 30-50 percent of the increase in government debt. In a recent study of fiscal expansions in the Euro area from 1999 to 2019, Checherita-Westphal and Stechert (2021) found that 19 percent of a fiscal stimulus is offset by higher household savings in the short-term, rising to 41 percent in the long-term.

Another reason for being cautious about inferring causality is that in an open economy, a decline in national savings does not necessarily lead to lower domestic investment, as any shortfall can be offset by borrowing from abroad. However, interest payments on borrowed funds and the return on foreign-owned capital reduce national income. An additional cost arises because the resulting current account deterioration must be offset by higher net exports, which requires a reduction in real wages in the export sector.

To complement Tombe’s analysis, we present an estimate of the economic cost of reduced national savings. In a closed economy with constant household savings, a budget deficit leads to a dollar-for-dollar crowding out of investment. Using historical returns on capital and assuming that national savings decline by 60 percent of the deficit due to offsetting increases in household savings, the $1,372 billion in federal net debt in the current fiscal year would have an economic cost of about $90 billion.2 This calculation does not capture the impact of lower capital intensity on productivity, so it underestimates the true cost.

If foreign savings offset the decline in national savings and foreigners invest directly in Canada, they receive the return on this capital, so the gross economic cost remains the same. However, the return is subject to corporate income tax, so the net economic cost would be about 25 percent lower. If Canadian firms borrow abroad to finance domestic investment, the economic cost is the interest paid to foreigners. While gross interest payments to foreigners will be less than the return on capital unless there is a large country-risk premium, interest payments are taxed more lightly.3 Therefore, the net economic cost may not differ substantially.

An additional cost of accessing foreign savings arises because higher capital servicing charges put downward pressure on the current account balance, which must be offset by an increase in net exports. In a small economy, export and import prices are determined in world markets, so the increase in net exports requires a decline in real wages in the export sector. However, if a country’s exports have unique features, increased supply can lower export prices, adding to the economic cost of borrowing from abroad (Burgess 1996).

Calculating the economic cost of investment crowding out when foreign borrowing is possible as the net-of-tax return on capital paid to foreigners establishes a minimum cost because it excludes the reductions in real wages required to increase net exports. The minimum cost would, therefore, be 0.75 x $90 billion = $68 billion, where the $90 billion reflects the economic cost of lower investment, adjusted by a factor of 0.75 to represent corporate income taxes on the returns paid to foreign investors. The $75 billion cost associated with raising taxes to finance higher federal interest expenses does not change with the availability of foreign financing, so the overall cost of the federal debt is approximately $142 billion, or 4.7 percent of GDP in 2024/25.

A similar calculation can be performed for overall provincial debt. In 2021/22, provincial net debt amounted to $784.7 billion, with debt service charges of $30.6 billion. Using the same weighted average economic cost of taxation as for the federal government, the economic cost of provincial debt service charges was $42 billion. The cost of investment crowding out adds another $39 billion, bringing the total cost of debt at the provincial level to $81 billion, or 3.2 percent of GDP in 2021/22. Assuming provincial debt remains at the same percentage of GDP from 2021/22 to 2024/25, the overall cost of Canada’s debt is about 8 percent of GDP.

Benefits of Debt and Its Optimal Level

Tombe also discussed the benefits of public debt, noting its role in financing long-lived assets, stabilizing the economy and smoothing tax rates over time. Governments should borrow to finance investments that will benefit future generations and should finance current expenditures out of current taxes. Spending on education, health and knowledge creation raises special concerns because it benefits both current and future generations. However, since each generation must make these investments, financing them through current revenues typically aligns with the benefit principle.

Counter-cyclical fiscal policy enhances social well-being by mitigating costly deviations from full employment. Additionally, governments can reduce the harmful effects of distortionary taxes by keeping them stable. Since the efficiency cost of taxes is higher when rates are above average than when rates are below average,4 governments should set tax rates at levels sufficient to support expected spending over the cycle and allow deficits to rise and fall in response to unexpected expenditures.5

An issue absent from discussions at the conference was the role of public debt in addressing market imperfections, which can improve efficiency. One such imperfection is the lack of adequate insurance markets against individual-specific wage income losses. As a result, individuals “self-insure” by increasing savings, which is more costly than paying the premiums in a well-functioning insurance market. Public debt puts upward pressure on interest rates and provides a safe savings instrument, allowing households to reduce their savings closer to the efficient level.

Unlike the efficiency gains from using public debt to stabilize the economy and smooth tax rates, mitigating the impact of inadequate insurance markets may justify a permanent increase in public debt. With a well-functioning insurance market, the optimal public debt ratio would be negative – governments should be net savers rather than net debtors. This would allow governments to finance expenditures from interest received on assets rather than from distortionary taxes.6

Empirical issues raised by the inadequate insurance-market approach include whether correcting the market failure is sufficient to make the optimal debt ratio positive and whether the penalty for deviating from the optimal ratio is significant enough to affect the choice of a debt target. Early analyses of incomplete markets found a positive optimal debt ratio. For instance, Aiyagari and McGrattan (1998) calculated an optimal debt ratio of 66 percent of GDP for the US economy. However, Peterman and Sager (2018), using a model with many of the same features as Aiyagari and McGrattan but incorporating multiple generations with standard life cycles instead of a single generation with an infinite life span, found that net government saving is optimal in the US economy. The main reason for the different result is that individuals in a life-cycle model spend a substantial fraction of their working lives accumulating enough savings to make self-insurance possible, so the benefit from self-insurance is smaller than if infinite life spans are assumed.

These results are less relevant for Canada for two reasons. First, employment insurance and other income support measures are more generous in Canada, so self-insurance leading to excess saving is less of an issue. Second, the US analysis assumes deficits are financed entirely by domestic savings, which is a much less realistic assumption for Canada. Foreign borrowing reduces the optimal debt ratio because it lessens the upward pressure on interest rates, which diminishes the impact of public debt on “self-insurance” savings and raises the cost of debt. James and Karam (2001) modified the Aiyagari and McGrattan model to allow borrowing from abroad, which changes the optimal debt ratio from 66 percent to about -80 percent. This qualitative result – that access to foreign savings reduces the optimal debt ratio – has been confirmed by other researchers (Nakajima and Takahashi 2017; Okamoto 2024; and Cozzi 2022).

This review suggests that the inadequate-markets approach does not reverse the conclusion from standard models that the optimal debt ratio is negative, implying that welfare gains can be realized when debt levels are reduced. However, the studies reviewed indicate that the penalty for deviating from the optimal debt ratio is small. In three of the six optimal debt studies reviewed, it is possible to compare the estimated economic costs. In the Peterman/Sager and Nakajima/Takahashi studies, a one-percentage-point increase in the debt ratio reduces consumption by .003 percent. The corresponding figure in the Cozzi study is much higher, approximately .02 percent. These estimates are very low relative to the estimates presented earlier, which imply a loss of .05 percent per percentage-point increase in the debt ratio.

It seems likely that these models are substantially understating the cost of debt. The benefits would have to be understated by an even larger percentage to overturn the conclusion that governments should be creditors not debtors. Since the argument for incurring debt to improve market efficiency is weak, the debt ratio should be chosen by considering only its impact on generational fairness. However, since debt is one of several factors affecting generational transfers, debt policy may have to deviate from the benefit principle to achieve a desired balance of the well-being of current and future generations.

Sustainability Analysis

High debt also raises concerns about its prudence or sustainability: can the interest expense be financed without requiring tax increases or cuts in program spending in the future? In his presentation, Alex Laurin, the Institute’s Vice President and Director of Research, challenged the federal budget’s claim that federal public finances are sustainable (Canada 2024, 382). The federal government’s sustainability claim is based on long-term projections showing a continuously declining debt-to-GDP ratio, reaching nine percent by 2055/56. Moreover, this trend holds even with less optimistic assumptions about interest rates and economic growth.

Laurin argued that this projection is not a convincing demonstration of sustainability for three reasons:

1) Interest Rate Assumptions: In the base case, the effective interest rate on federal debt (r) remains below the growth rate of the economy (g) for 32 years, which puts continuous downward pressure on the debt ratio. This assumption is inconsistent with the historical record. Over the past 35 and 45 years ending in 2022/23, averages of r-g are positive, at 0.8 and 0.4 percentage points, respectively. Only when the averaging period is extended back to include the high-inflation period starting in the 1970s does the multi-year average turn negative.7

2) Program Spending Assumptions: While revenues are assumed to grow in line with GDP, program spending decreases by about one percentage point of GDP over the projection period, causing the primary surplus to rise and putting downward pressure on the debt ratio. A more realistic “no policy change” assumption would keep the share of program spending roughly constant, allowing an assessment of the sustainability of current spending levels.

3) Exclusion of Economic Downturns: The projection fails to explicitly include economic downturns. Over the last 60 years, Canada has experienced five recessions, each prompting discretionary temporary stimulus measures that permanently increased debt. The policy response averaged 1.09 percentage points of potential GDP for each percentage point deviation from potential GDP (Table 1).

Laurin presented an alternative debt projection, assuming that overall program spending grows in line with GDP from 2029/30 to 2055/56 and that r equals g on average over the projection period.8 With these changes, the decline in the federal debt ratio is less pronounced, reaching 29 percent in 2055/56 compared to 9 percent in the budget projection.

Economic downturns were included in the projection by simulating 1,000 random probabilistic scenarios – assuming the frequency and magnitude of recessions over the past 60 years are representative of the future. Laurin assessed debt sustainability by calculating the probability that the debt ratio remains at or falls below its initial value over the projection period.9 The simulations showed an even chance that the debt ratio will exceed its 2028/29 value late in the projection period. Under the International Monetary Fund’s classification (IMF 2022), Canada’s federal debt would be considered unsustainable.

Some conference participants suggested that Laurin’s analysis might not fully capture the risks associated with the federal fiscal position because it assesses a single r-g profile. They also emphasized the importance of including provincial and territorial governments in any sustainability analysis, as these levels are most affected by demographic aging.

For this report, Laurin modified his approach to include provincial and territorial governments’ net debt and to capture the risks of r-g deviating from its assumed zero average over the long term. He introduced variability in the interest-rate growth-rate gap based on historical data, allowing for a more comprehensive risk assessment (methods and assumptions are provided in Appendix).

The modified analysis showed that, without any simulated shocks, the combined federal and provincial/territorial net debt-to-GDP ratio initially declines and then stabilizes until 2041/42, when rising healthcare costs due to demographic aging – and the associated interest on provincial debt – cause it to rise steadily (Figure 2, black dashed line). Introducing interest rate and recession shocks significantly alters the outlook, indicating a 50 percent chance that the debt ratio will begin its long-term rise in 2035/36, eventually surpassing 100 percent of GDP (black dotted line). There is a 20 percent chance (the 80th percentile) that the debt ratio will not decrease substantially from its current level and start a steady increase in 2033/34 (grey dotted line). Conversely, there is only a 20 percent chance (the 20th percentile) that the ratio will stay below its near-term value for the entire projection period (gold dotted line).

A Prudent and Fair Target

Prudence

According to McGill economist Christopher Ragan, the main concern about Canada’s high public debt is that it will reduce our ability to borrow to address the next economic crisis. He analysed this issue using three zones for the debt ratio: red (top), yellow (middle) and green (bottom) (Figure 3). The red (top) zone, which represents unsustainable debt, starts roughly five percentage points below the 1995 federal-provincial debt ratio’s peak of 100 percent, when Canada entered a period of “forced austerity.” This entry point to the red (top) zone is higher than the 90 percent threshold for negative effects on growth developed by Reinhart and Rogoff (2010). However, the threshold would be lower if the interest rate on public debt (r) were higher than the rate of economic growth (g).

Ragan argued that the current combined federal-provincial debt-to-GDP ratio is in the yellow (middle) “cautionary” zone. The height of this zone is determined by the buffer required to avoid being pushed into the red (top) zone by an economic crisis. Entering the red (top) zone would mean sharply higher interest rates and lower growth.

To avoid this, Ragan set the buffer at 28 percentage points of GDP, about a quarter more than the increase in the debt ratio during the COVID-19 pandemic. Given the frequency of economic crises, he advocated returning to the green (bottom) zone by 2029/30, nine years after the end of the pandemic-induced recession. This requires reducing the federal-provincial debt ratio by about 10 percentage points.

Laurin followed up by determining the fiscal effort required to return to the green (bottom) zone with high probability. His calculations show that, starting in the next fiscal year (2025/26), the combined federal-provincial primary balance would need to increase permanently by 1.38 percent of GDP – or $42.9 billion in 2025/26.10 If implemented through spending reductions, provincial spending would have to decline by about 7 percent, or federal spending would have to fall by almost 9 percent. Note that such spending reductions would still not fully return the combined federal-provincial program spending/GDP ratio to its pre-pandemic 2018/19 value. The federal government could achieve the same effect by raising the GST to 8.5 percent. However, since most spending pressures from an aging population are on provincial governments, it would be sound policy for the federal government to transfer tax points to provincial governments (Kim and Dougherty 2020). Even with near-term fiscal adjustment, additional consolidation may be necessary in the future to prevent a rise in the debt/GDP ratio.

Ragan favoured achieving the debt target through expenditure restraint rather than raising taxes, which he thinks may have reached their limit. Restraining expenditures will be particularly challenging given medium-term pressures from an aging society, rising military and security needs, and potentially increased public investments for the transition to a green economy. Canada, therefore, needs an ongoing and thorough program review to identify low-priority spending.

Fairness

Financing current government spending with debt is generally considered fair if the debt-to-GDP ratio is constant or declining over time, implying that future generations can receive the same level of government services without facing higher tax rates. However, stable tax rates alone are insufficient to prevent intergenerational transfers. Taxes must increase to finance the interest on the debt or remain higher than they would be otherwise. If the tax increase applies to both current and future generations, tax rates would be stable but higher than they would be without the increased debt. The higher tax rates required to finance debt interest and the deficit-induced reduction in national-savings transfer part of the cost of government spending to future generations who do not benefit from the spending.

Assessing generational fairness requires understanding the extent of intergenerational transfers resulting from fiscal policy. The presentation by Parisa Mahboubi, a Senior Policy Analyst at the Institute, offered insights into this issue using generational accounts. These accounts show lifetime net taxes imposed by federal and provincial governments for each birth cohort from 1923 to 2023 and for a composite future generation consisting of all persons born after 2023. The lifetime tax burdens of the 2023 birth cohort and future generations are comparable because a complete life cycle is captured in both cases. Her analysis shows that future generations are expected to face a slightly higher lifetime net tax burden than the youngest living generation.

Preparing generational accounts requires information on lifetime taxes and transfers for each birth cohort alive today and for future generations. Projected values of taxes paid by current birth cohorts are developed based on age-specific profiles of different types of taxes,11 assuming unchanged tax policies. Spending on health, education, elderly benefits, child benefits, social assistance and GST credits vary by age, while other government expenditures are evenly distributed per capita. Per capita taxes, transfers and expenditures are assumed to grow at the same rate as productivity.

The lifetime net tax burdens for currently alive birth cohorts are calculated as the present value of projected tax payments less the present value of projected government transfers the cohort will receive. Lifetime net tax burdens of future generations are calculated using the “no free lunch” constraint: someone, sometime, must pay for all that the government spends (US Congressional Budget Office 1995). The lifetime net tax burden of future generations equals the amount of future spending not paid by currently alive generations.12

In the baseline scenario, productivity grows 0.94 percent annually, the average GDP per capita growth from 2002 to 2022. The discount rate is the average return on real return bonds over the same period, 1.3 percent.13 Statistics Canada’s medium-growth scenario14 is used for demographic projections, with population growing at an average annual rate of 0.85 percent over the 100-year projection, driven entirely by net immigration. The ratio of those over 65 to those aged 18-65 – the old-age dependency ratio – more than doubles over the projection period, rising from 30 percent to 72 percent (Figure 4).

The increase in the old-age dependency ratio drives upward trends in elderly benefits and health-related expenditures as a share of GDP. Other categories of age-specific spending remain roughly constant.

In the baseline scenario, the lifetime net tax burden of future generations (“unborn”) exceeds that of the cohort born in 2023 (“newborn”) by $23,000 per person (Figure 5). Factors influencing this result include:15

  • Fiscal Position in the Base Year: In 2023, federal and provincial tax revenues exceeded program spending by over one percent of GDP. A smaller primary surplus would have decreased the lifetime net tax burden of the newly born, increasing the burden on the unborn.
  • Population Growth: Faster population growth reduces the relative tax burden on future generations by slowing the rise in the old-age dependency ratio and reducing the per-capita burden of existing debt.
  • Healthcare Costs: If real healthcare costs increase faster than productivity growth, the recently born will pay a smaller share, leaving more for future generations.

The baseline assumptions represent the midpoint of a range of plausible values. While results are sensitive to changes in assumptions, the baseline is considered the most likely outcome. The generational accounts, therefore, suggest that fiscal policy is generationally fair.

However, other factors must be considered when assessing fairness:

  • Population Stability: If there were no net population growth, the tax burden on future generations would be much higher, even if the old-age dependency ratio did not change, because the cost of existing debt would be spread over a smaller population. This observation draws attention to the fact that future generations will be paying for services they did not receive, even with stable lifetime net taxes.
  • Income Growth: Future generations will likely be richer due to productivity growth, which could justify asking them to bear some costs of current consumption. However, parents may not wish to pass on costs to their children, even if incomes are rising over time. Population growth through immigration substantially reduces intergenerational linkages, which could encourage the current generation to increase the target size of intergenerational transfers.
  • New Spending Pressures: The generational accounts do not capture new pressures like rising military and security commitments or higher spending to achieve a net-zero emissions economy. In both cases, underspending in the past has pushed costs into the future. Pre-funding some of this spending by increasing taxes in the near term would even out contributions across generations.
  • Comparisons with Near Term Future Generations: Generational accounts compare a representative future generation with the most recent birth cohort. Comparing the tax burden of living generations with the burden on near-term future generations is also relevant.

While the generational accounts indicate that the federal-provincial fiscal stance is fair to future generations under current assumptions, it is beneficial to supplement this analysis with assessments over shorter time horizons. For example, virtually all living generations benefited from the debt-financed income stabilization and health measures implemented during the pandemic-induced recession. There is a strong fairness argument for paying down pandemic-related debt before the next generation starts working and paying taxes, which would occur over the 2035-to-2045 period (Lester 2021).

Federal and provincial Covid-related spending amounted to approximately $430 billion from 2020/21 to 2022/23.16 Federal and provincial debt was $2,092 million in 2022/23. Reducing the level of debt to $1,660 million no later than 2045/46 would be fair to generations born in 2019 and later. However, in Laurin’s prudent scenario, in which debt is sustainable with 80 percent probability, the level of debt rises continuously over the projection period. The gap between the prudent and fair level of debt is $1,200 million in 2035/36. Achieving a fair level of debt would require more fiscal consolidation than is needed to achieve sustainability.

Reforming Expenditure Management

Ragan’s debt target and the recommendation to achieve it through expenditure restraint raise two issues:

1) Building Consensus: How to build a consensus on the proposed debt target and increase the likelihood of achieving it.

2) Identifying Savings: How to identify programs that don’t provide enough value to justify raising taxes to finance them.

Economist and C.D. Howe Institute Fellow-in-Residence John Lester emphasized that achieving a political consensus on a more prudent fiscal approach requires vigorous and sustained advocacy. Part of this advocacy involves convincing governments to surrender some policy flexibility to increase the odds of achieving the target reduction in debt and reduce the risk of relapse after the next crisis.

Lester and Laurin (2023) propose a principles-based fiscal governance framework intended to reduce the bias toward deficit financing in both good times and bad. Governments should adopt guiding principles for fiscal policy, set operational rules for achieving target outcomes and transparently assess consistency with these principles.

At the conference, Lester expanded upon one element of the governance framework: a binding multi-year ceiling on non-cyclical spending. A key motivation for this proposal is the failure to adhere to spending tracks set out in budgets and fiscal updates. For example, in the federal government’s 2019 Economic and Fiscal Update, program spending was projected to decline as a share of GDP, reaching 13.8 percent by 2024/25. The spending ratio projected for 2024/25 increased in successive budgets so that in 2024-25 it will be almost 2 percentage points higher than projected in 2019.18

Binding multi-year expenditure ceilings apply in 11 OECD member countries (Moretti, Keller, and Majercak 2023).19 In the Netherlands and Switzerland, the ceilings are set out in legislation that constrains expenditure growth. Alberta has recently adopted a similar approach.20 However, in most countries, expenditure ceilings are set by the government to ensure consistency with its self-defined fiscal objectives, which may or may not include expenditure restraint. This is the general approach recommended for Canada, although the hope is that the self-defined objective will be to achieve the debt target through expenditure restraint.

The expenditure ceiling would be binding for five years, ideally developed in the first year of a new electoral mandate after a campaign outlining spending plans in detail. The ceiling would cover all categories of spending directly affected by policy decisions. It would be updated annually to account for forecasting errors in program determinants (e.g., inflation, population growth). There would be escape clauses for major economic recessions, natural disasters and war. The ceiling could include a reserve for new policy initiatives, but in the context of expenditure restraint new initiatives may need to be funded by eliminating or modifying existing programs.

Identifying the programs that should be scaled back or eliminated because they don’t provide enough benefits to justify raising taxes to finance them requires, according to Lester, an overhaul of the way the government manages its spending, particularly the performance management framework that is key to establishing value for money. Yves Giroux set the stage for this discussion by describing the federal government’s current expenditure management system.

The requirement to evaluate programs was formalized following the creation of the Office of the Comptroller General in 1978. Despite several modifications, program evaluations have not been successful in affecting strategic spending decisions. The Ministerial Task Force on Program Review (the Nielsen Task Force) from 1984 to 1986 described evaluations as “generally useless and inadequate for the work of program review” (quoted in Grady and Phidd 1993). More recently, McDavid et al. (2018, 302) conclude that evaluations do not “address questions that would be asked as cabinet decision-makers choose among programs and policies.”

Under the current evaluation policy, federal government departments have considerable flexibility in conducting evaluations. They may focus on design and delivery, program beneficiary responses or a comparison of program costs and benefits. A review of 48 evaluations prepared since 2020 in eight departments21 found that only four went beyond assessing operational efficiency and impacts on beneficiaries to examine whether the program represented value for taxpayer money. Three of these applied formal benefit-cost analysis, which is the standard for assessing regulatory proposals.22

Evaluating programs in terms of operational efficiency and beneficiary impacts helps improve programs, but if evaluations are to inform strategic spending decisions, value-for-money assessments must be mandatory. These assessments should be based on the benefit-cost framework applied to regulatory proposals.

Benefit-cost analysis of regulatory proposals – and by extension, spending programs – assesses the overall social benefits and costs of policy initiatives. The quantitative analysis attempts to determine if the economic pie is larger or smaller after government intervention. For example, economic development programs (business subsidies) are implemented with the expectation that they will increase overall real income. To assess this, benefit-cost analysis considers not only the additional investment and employment resulting from the subsidy but also the opportunity cost of workers and capital – the amount that would have been earned otherwise. The net increase in the economic pie is the incremental earnings of workers and capital less efficiency losses from raising taxes or issuing debt to finance the subsidy and resources used to administer and apply for it.

The nature of the assessment should vary by program type. Business subsidies, labour market development programs and climate change mitigation/adaptation measures have benefits and costs measurable in monetary terms. These programs could be ranked by their net social benefits, allowing comparisons within and across program categories. Programs where benefits are less than costs would be candidates for elimination or modification.

A more nuanced approach is needed when assessing social programs and other measures with a fairness goal for several reasons. Their economic impact is ambiguous, and a negative economic impact is not a sufficient reason to eliminate a program. In addition, support for an income redistribution program depends on who benefits from it. As a result, evaluations of social programs should be more descriptive than prescriptive. They should present information on the economic impacts of measures, their fiscal cost, including administration expenses, and a discussion of who benefits from the program and how they benefit. Evaluations should also assess how the program fits into other measures providing support to the target population. This information will allow elected officials and, since all evaluations would be made public, Canadians, generally, to form an evidence-based opinion on the value for money of social programs.

A thorough assessment of government programs through a value-for-money lens may not identify enough wasteful spending to achieve deficit and debt targets. If so, tax increases should be used to achieve the objectives.

Adopting and achieving the debt target will require a political commitment that currently does not exist. The task for policy analysts is to help build a consensus on a more prudent approach to fiscal policy and a revamped expenditure management system. According to Lester, this consensus should be ratified by legislation setting out general principles for sound fiscal policy, supplemented with non-legislated operational rules to guide annual policy and monitor progress. This approach would impose discipline on fiscal policy while allowing flexibility to address unexpected developments. Legislation would strengthen the consensus on fiscal prudence and help prevent backsliding by future politicians.

Conclusion

The evidence presented at the conference confirmed that Canada has a debt problem. Existing debt levels are not prudent, and they raise concerns about generational fairness. Prudence requires that Canada’s public debt be reduced by about 10 percentage points of GDP before the decade’s end. This would require increasing the combined federal-provincial primary balance by 1.4 percent of GDP, or $43 billion, starting in 2025/26.

Tax increases harm economic performance, so elimination of public spending that does not provide enough benefits to offset this damage should be the first step in reducing deficits and debt. Identifying wasteful spending will require comprehensive value-for-money assessments. Governments must not take the easy way out by implementing across-the-board spending cuts. Successful expenditure restraint will also require setting binding multi-year expenditure ceilings to prevent governments from spending revenue windfalls or from increasing spending to improve chances of electoral success.

Canada’s public debt is imposing a burden on future generations. A comparison of the lifetime tax burden on the recently born with distant future generations reveals only a small generational transfer in favour of the recently born. However, burden shifting is much larger from currently living generations to persons born shortly after the pandemic-induced recession. The $430 billion in pandemic-related debt should be paid down by the people that benefited from the income stabilization measures. Achieving this fairness objective would require more fiscal consolidation than needed to ensure sustainability of the debt. For the Silo, Alexandre Laurin/John Lester via C.D. Howe Institute.

Appendix: Assumptions and Methods for the Sustainability Analysis

References

Aiyagari, S. Rao, and Ellen R. McGrattan. 1998. “The Optimum Quantity of Debt.” Journal of Monetary Economics 42 (3): 447–69.

Ambler, Steve, and Craig Alexander. 2015. “One Percent? For Real? Insights from Modern Growth Theory about Future Investment Returns.” E-Brief. Toronto: C.D. Howe Institute. October.

Burgess, David F. 1996. “Fiscal Deficits and Intergenerational Welfare in Almost Small Open Economies.” Canadian Journal of Economics, 885–909.

Canada. 2024. “Budget 2024.” Department of Finance Canada. April.

Checherita-Westphal, Cristina D., and Marcel Stechert. 2021. “Household Saving and Fiscal Policy: Evidence for the Euro Area from a Thick Modelling Perspective.” Available at: https://papers.ssrn.com/sol3/papers.cfm?abstract_id=3992188.

Conklin, David, and Thomas Courchene. 1983. “Deficits: How Big and How Bad?” Special Research Report. Toronto: Ontario Economic Council.

Cozzi, Marco. 2022. “Has Public Debt Been Too High in Canada and the US? A Quantitative Assessment.” University of Victoria, Economics. Available at: http://www.uvic.ca/socialsciences/economics/assets/docs/discussion/ddp2007.pdf.

Dahlby, Bev, and Ergete Ferede. 2022. “What Are the Economic Costs of Raising Revenue by the Canadian Federal Government?” Fraser Institute. Available at: https://roam.macewan.ca/items/73cf71a0-209f-4634-91a7-98d019750638/full.

Grady, Patrick, and Richard W. Phidd. 1993. “Budget Envelopes, Policy Making and Accountability.” Government and Competitiveness Project, School of Policy Studies, Queen’s University. http://global-economics.ca/budgetenvelopes.pdf.

International Monetary Fund (IMF). 2022. “Staff Guidance Note on the Sovereign Risk and Debt Sustainability Framework for Market Access Countries.” 2022–039. IMF Policy Papers.

James, Steven, and Philippe Karam. 2001. “The Role of Government Debt in a World of Incomplete Financial Markets.” Department of Finance, Economic and Fiscal Policy Branch.

Jenkins, Glenn, and Chun-Yan Kuo. 2007. “The Economic Opportunity Cost of Capital for Canada-an Empirical Update.” Queen’s Economics Department Working Paper. Available at: https://www.econstor.eu/handle/10419/189409.

Johnson, David. 2004. “Does the Debt Matter?” In Is the Debt War Over, pp. 173–96. Montreal: Institute for Research on Public Policy. Available at: https://books.google.com/books?hl=en&lr=&id=s4VcGvjVX0MC&oi=fnd&pg=PA173&dq=%E2%80%9CDoes+the+debt+matter%3F%E2%80%9D+&ots=t0fNWzkyoC&sig=TIQrfQbAitqgSIDuHypw_FT6Eeo.

Kim, Junghum, and Sean Dougherty (eds.) 2020. “Adaptability, accountability and sustainability: Intergovernmental fiscal arrangements in Canada,” in Ageing and Fiscal Challenges across Levels of Government, OECD Publishing, Paris.

Lester, John. 2024. “Minding the Purse Strings: Major Reforms Needed to the Federal Government’s Expenditure Management System.” Available at: https://www.cdhowe.org/sites/default/files/2024-09/For%20advance%20release%20EMS%20E-Brief_359.pdf.

Lester, John, and Alexandre Laurin. 2023. “Ottawa Needs a New Approach to Fiscal Policy.” E-Brief 338. Toronto: C.D. Howe Institute. Available at: https://papers.ssrn.com/sol3/papers.cfm?abstract_id=4397967.

Mahboubi, Parisa. 2019. Intergenerational Fairness: Will Our Kids Live Better than We Do? Commentary 529. Toronto: C.D. Howe Institute. January.

McDavid, Jim, Astrid Brousselle, Robert P. Shepherd, and David Zussman. 2018. “Linking Evaluation and Spending Reviews: Challenges and Prospects.” Canadian Journal of Program Evaluation 32 (3): 297–304. https://doi.org/10.3138/cjpe.43176.

Modigliani, Franco. 1983. “Government Deficits, Inflation and Future Generations.” In Deficits: How Big and How Bad, pp. 55–71.

Moretti, Delphine, Anne Keller, and Marco Majercak. 2023. “Medium-Term and Top-down Budgeting in OECD Countries.” OECD Journal on Budgeting 23 (3). https://www.oecd-ilibrary.org/content/paper/39425570-en.

Nakajima, Tomoyuki, and Shuhei Takahashi. 2017. “The Optimum Quantity of Debt for Japan.” Journal of the Japanese and International Economies 46:17–26.

Okamoto, Akira. 2024. “The Optimum Quantity of Debt for an Aging Japan: Welfare and Demographic Dynamics.” The Japanese Economic Review. May. Available at: https://doi.org/10.1007/s42973-024-00156-7.

Panizza, Ugo, Richard Varghese, and Yi Huang. 2019. “Public debt and private investment.” Centre for Economic Policy Research. VOXEU Column. December 4.

Peterman, William, and Erick Sager. 2018. “Optimal Public Debt with Life Cycle Motives.” https://papers.ssrn.com/sol3/papers.cfm?abstract_id=3187698.

Ragan, Christopher, and William G. Watson. 2004. “Is the Debt War Over?: Dispatches from Canada’s Fiscal Frontline.” Vol. 45. IRPP. Available at: https://books.google.com/books?hl=en&lr=&id=s4VcGvjVX0MC&oi=fnd&pg=PP11&dq=%22Is+the+debt+war+over%3F%22&ots=t0fNWqoDsw&sig=Q1poOT4AbHtIkx_NVf5GjrcXEtc.

Reinhart, Carmen M., and Kenneth S. Rogoff. 2010. “Growth in a Time of Debt.” American Economic Review 100 (2): 573–78. https://doi.org/10.1257/aer.100.2.573.

Robson, William, and Parisa Mahboubi. 2024. Another Day Older and Deeper in Debt: The Fiscal Implications of Demographic Change for Ottawa and the Provinces. Commentary 665. Toronto: C.D. Howe Institute. August.

Robson, William, and William Scarth. 1994. Deficit Reduction – What Pain, What Gain? (Policy Study 23). Toronto: C.D. Howe Institute.

US Congressional Budget Office. 1995. “Who Pays and When? An Assessment of Generational Accounting.” Available at: https://www.cbo.gov/sites/default/files/cbofiles/attachments/Genacct.pdf.

Why Canada On Track For Record Asylum Claims This Year

ANALYSIS: Canada Is On Track for Record Asylum Claims This Year—Here’s Why
An RCMP officer and a worker look on the demolition of the temporary installation for refugee claimants at Roxham Road Monday, in St. Bernard-de-Lacolle, Que., on Sept. 25, 2023. The Canadian Press/Ryan Remiorz

The closing of the unofficial border crossing Roxham Road last year stemmed the flow of asylum-seekers into Quebec from New York state, but overall numbers are rising in Canada with a spike in those arriving by air. The rise has many reasons behind it and can’t be accounted for by the growing scope of global conflict alone, immigration experts told The Epoch Times.

A major contributor is likely an increase in travel visa approvals.

The government has recently ramped up its visa processing to eliminate a backlog from the pandemic, Montreal immigration lawyer Stéphanie Valois told The Epoch Times. After arriving on travel visas, many people proceed to claim asylum.

A group of asylum seekers wait to be processed after being escorted from their tent encampment to the Canada Border Services in Lacolle, Quebec, on Aug. 11, 2017. Canada sees influx of 25,000 asylum seekers crossing border from US (alipac.us)

Fewer travel visa applicants have been asked to prove they will return home in recent years, said lawyer and York University international relations professor Michael Barutciski in an email. This is also likely contributing to an increase in air arrivals, he said.

From January to June this year, Canada processed just over 92,000 asylum claimants. That’s a lot more than the roughly 57,000 claimants in the same period last year—and 2023 was already a record-breaking year.

By contrast, from 2011 to 2016, the number of claimants Canada received each year ranged from around 10,000 to 25,000. The numbers began to climb thereafter, and Canada’s per-capita intake of asylum-seekers is now comparable to that of Germany, the European Union’s largest host country, according to Barutciski’s analysis of EU figures for a Macdonald-Laurier Institute paper published in July.

Nearly 28,000 claimants arrived via air in the first half of this year, compared with roughly 8,000 by land. This is a reversal of a long-standing trend of land arrivals being far more common, even before Roxham Road became a heavily used route.

The total number of asylum claimants processed by Canada Border Services Agency and Immigration, Refugees and Citizenship Canada during the first six months of 2017–2024. For 2011– 2016, only annual data is available, so we cut the annual total in half to give a rough estimate for comparison. (The Epoch Times)
The total number of asylum claimants processed by Canada Border Services Agency and Immigration, Refugees and Citizenship Canada during the first six months of 2017–2024. For 2011– 2016, only annual data is available, so we cut the annual total in half to give a rough estimate for comparison. The Epoch Times

From Land to Air

Roxham Road is an unofficial border crossing between New York and Quebec used by more than 100,000 migrants since 2017. Its use waned after Canada and the United States closed a loophole in their bilateral Safe Third Country agreement in March 2023.

The agreement says anyone seeking asylum must file their claim at the first of the two countries they enter. But the loophole was that this requirement applied only to official border crossings. Now it applies anywhere along the border: Asylum-seekers will be turned back to the United States to make their claims there.

Most of the asylum-seekers in 2023 were from Mexico—about 25,000 of all claimants that year, according to the Immigration and Refugee Board (IRB) of Canada.

The federal government further tightened restrictions on migrants from Mexico in February 2024 by requiring Mexicans to have travel visas.

“This responds to an increase in asylum claims made by Mexican citizens that are refused, withdrawn or abandoned,” said the federal government’s announcement at the time. “It is an important step to preserve mobility for hundreds of thousands of Mexican citizens, while also ensuring the sound management of our immigration and asylum systems.”

Prime Minister Justin Trudeau said in June, after meeting with Quebec’s premier, that his government would “improve the visa system“ in general, but he did not elaborate and it was not a major point of discussion.

The Epoch Times asked Immigration, Refugees and Citizenship Canada for any update or specific plans but did not receive a response as of publication.  

“When people apply for a visa, it’s almost impossible to know what their intentions are when they arrive in Canada,” immigration lawyer Valois said. They may be planning to seek asylum, or sometimes the situation changes in their homeland—if a war starts, for example—and they decide to make a claim, she said.

The same is true of international students who file asylum claims, she added. Federal Immigration Minister Marc Miller has expressed alarm regarding international student claims.

The number of international students claiming asylum at Seneca College increased from about 300 in 2022 to nearly 700 in 2023. Claims from Conestoga College students rose from 106 to 450 during that same period.

These increases are “alarming” and “totally unacceptable,” Miller said in February.

As the method of entering Canada to claim asylum has changed, so have the most common countries of origin and the destinations within Canada.

Countries of Origin, Destination

The highest number of claimants so far this year have arrived from India. IRB data on country of origin is only available for January through March. It shows approximately 6,000 claimants from India. The next greatest are those from Mexico (about 5,800), Nigeria (5,061), and Bangladesh (3,016).

Given that the data is limited to only three months, it’s hard to tell how the annual total will compare to 2023. But if the number of Mexican applicants remains steady, Canada may see numbers similar to last year.

However, the number of Haitians and Colombians—which were among the highest in 2022 and 2023—appears to be on the decline. These are also groups that would have come in large numbers through Roxham Road.

The new claimants coming in now are from countries that differ from the top source countries for refugee claims worldwide, Barutciski said, referencing data he analyzed from the United Nations High Commissioner for Refugees.

Canada’s spike is not following global trends, he said, which suggests it may have to do with a perception that Canada’s asylum policies are especially lenient. In other words, Canada is attracting claimants who feel they may not successfully seek asylum elsewhere.

Asylum-seekers are specifically people who arrive in the country without pre-approved refugee status. For example, although Canada has taken in many Ukrainian refugees, Ukraine is not a top source of asylum-seekers.

The majority of claimants so far this year have arrived in Ontario, whereas for years, Quebec was at the centre of the asylum issue.

Quebec has received more claimants than Ontario almost every year since 2016. The only exceptions were 2020 and 2021, but Ontario’s numbers were only slightly higher during those years (a difference of approximately 700 people in 2020 and roughly 1,600 in 2021).

In the first half of this year, Ontario received approximately 48,000 claimants and Quebec received 33,000. British Columbia and Alberta were the next highest recipients, with roughly 5,200 and 4,500 respectively.

How to distribute claimants, along with the federal funds for helping settle them, has been a hot topic.

Quebec received a pledge of $750 million in federal funds in June, and B.C. Premier David Eby was most outspoken about other provinces wanting help as well. Minister Miller replied in June that British Columbia needs to take on more asylum-seekers if it wants more money.

Manitoba and Newfoundland and Labrador have said they are willing to take on some of Quebec’s asylum-seekers.

Quebec has requested a federal quota system that would relocate asylum-seekers to other provinces.

The Parliamentary Budget Office (PBO) in May put together an estimate of federal costs associated with each asylum claimant from a visa-exempt country.

The average cost for each claimant is $16,500 cad in 2024, the PBO said.

Asylum-seekers are eligible for a work permit, with the processing time to get it about six to eight weeks, according to the Quebec government.

The claims themselves can take years to process. The current projected wait time, according to the Immigration and Refugee Board of Canada, is two years for a refugee claim and one year for an appeal. The backlog of cases has grown over the years to more than 186,000 as of March 31 this year. For comparison, the backlog was approximately 10,000 in 2015.

The proportion of claims that are approved is rising. The data available for 2024 so far, from January to March, shows 82 percent approved—or some 11,000 out of around 13,500 claims ultimately assessed—not counting others that weren’t assessed as they were either abandoned or withdrawn by the claimant.

Similarly, in the 2023 calendar year, roughly 79 percent were approved. That was a steep increase from the 69 percent figure in 2022, and the 71 percent in 2021. If we jump back to 2013, the number was 60 percent, which increased to 64 percent in 2014 and continued to climb.

Tara MacIsaac

For the Silo, Tara MacIsaac/The Epoch Times. The Canadian Press contributed to this report. Featured image via alipac.us : A group that stated they were from Haiti line up to cross the U.S.-Canada border into Hemmingford, Quebec, from Champlain in New York, Aug. 21, 2017.

Related

Quebec Calls for Asylum Seekers to Be Distributed Throughout Canada via Federal Quota System

Quebec Calls for Asylum Seekers to Be Distributed Throughout Canada via Federal Quota System

Traditional Family Fades In Canada As Some Women Advocate For Revival

On her fridge door, along with numerous family pictures, Danielle Brandt has a handwritten quote by Dr. John Trainer: “Children are not a distraction from more important work. They are the most important work.”

A proud Calgary mother of three boys (Aiden, 10, Theodore, 4, and Silas, 2), Mrs. Brandt is a homemaker. Her husband, Adam Brandt, is the breadwinner. At the core of their parenting philosophy is the belief that strong families make strong societies, Mrs. Brandt says.

She was a music teacher before becoming a stay-at-home mom, but when she returned to work shortly after giving birth to her first child, she says she realized she wanted to be fully involved in raising her children.

“The idea that your identity is found at home with your family and not out in the world with your peers, and that your parents and your family are what matters first … that’s the reason I wanted to be home with my children.”

While Mrs. Brandt persists in adhering to her traditional role in the family, there is declining interest among young Canadian women to pursue the same path.

Canadians are “increasingly less likely” to form families, and if they do, they are choosing to have fewer children, if any at all, according to a May 2024 report jointly published by the Macdonald-Laurier Institute (MLI) and the Centre for the Study of Living Standards.

ANALYSIS: To Reverse Canada’s Declining Birth Rate, Cultural Changes May Be More Important Than Economic Ones

How Marxism Broke Down the Nuclear Family

How Marxism Broke Down the Nuclear Family

The same report, based on evidence from existing data and literature, found that traditional families enjoy more prosperity and better health.

Adults who are in a couple tend to earn more money per person than singles of the same age and, if married, they tend to live longer, have healthier lifestyles, and are less stressed. Similarly, children benefit from being raised by their two biological parents in a stable marriage, appearing to have a higher standard of living and educational attainment, and being less likely to engage in risky behaviour, the report found.

But a significant fraction of Canadian children will see their families break up by the time they are 14, and more than a quarter live in one-parent families, the report said. The author, Tim Sargent, deputy executive director of the Centre for the Study of Living Standards, concluded that the rates of family dissolution in Canada are higher than those in the United States and the UK, culturally comparable countries.

Janice Fiamengo, a retired University of Ottawa English professor who now gives talks on the role of women in society, says the downward trends in family formation are largely due to how women’s priorities are being redefined in Canada.

“Their primary goal in life is to be independent, to have a career, and to regard marriage and childbearing as secondary, if not undesirable in general,” Ms. Fiamengo told The Epoch Times, describing the trends and messages aimed at young women today.

Trends Among Canadian Women

Women are now taking longer to complete their higher education. From 2000–2022, the participation in education of women aged 20 to 24 rose by 12 percent (to 51 percent), according to Statistics Canada.

Only 37 percent of men in the same age range participated in education in 2022, and that rate grew by just four percentage points since 2000. Similar trends are seen among men and women aged 25 to 29.

Source: Statistics Canada 2023h, Table 37-10-0196-01. (Chart: Carolina Avendano/The Epoch Times)

Women’s participation in the labour market has also increased dramatically in recent decades, with fewer and fewer women choosing to be stay-at-home moms.

Employment among women aged 25 to 54 has almost doubled from 40 percent in 1976 to about 80 percent as of May 2024, according to Statistics Canada. Employment rates for women in general remain higher than they were prior to the pandemic in 2017 and 2019.

In addition, more women aged 25 to 34 now delay living with their partner. The proportion of those who live with their parents increased by 3.3 percentage points, from 12.8 percent in 2011 to 16.1 percent in 2021.

Marriage rates are on the decline while divorce rates are increasing, and women are waiting until later to have children.

At the same time, Canada’s fertility rate has been declining persistently for the past 15 years, with the national rate hitting an all-time low in 2022 at 1.3 children per woman.

A study by the think tank Cardus found that the top factors that diminish a woman’s desire to be a mother are wanting to grow as a person, wanting to save money, focusing on a career, and believing that kids require intense care.

“Any woman who decides that what she primarily wants to do is to marry and to have children, that woman is seen as having failed, having let down other women, and having failed herself,” says Ms. Fiamengo.

She says the prevalence of feminism in Canada has played a role in shaping these views.

Changing Views on Traditional Family Roles

It wasn’t until the second-wave feminism of the 1980s that an idea with communist roots took hold—the dissolution of the traditional family structure, Ms. Fiamengo says.

Feminism takes many forms and contains different ideas—in the 19th century, it was about women’s suffrage. The idea that the traditional family is at odds with gender equality and women’s fulfilment has its origins in communist ideology.

In his 1884 book titled “The Origin of the Family, Private Property and the State,” Friedrich Engels, based on notes by Karl Marx, made the first allusion to the monogamous family as “the world historical defeat of the female sex,” in which the woman was reduced to servitude and turned into an instrument for the production of children.

He thus advocated for the liberation of the wife, the abolishment of the family, and for the care and education of the children to become a public affair.

“[Engels] explicitly makes that connection, that the man—the patriarch—is the capitalist oppressor. The woman is in the situation of being the oppressed worker or the sex slave in the family,” says Ms. Fiamengo.

“He saw no distinction between prostitution, in which a woman is bought by a man to have her body used for the man’s pleasure, and the situation of a woman in a marriage.”

Betty Friedan’s 1963 book “The Feminine Mystique,” a precursor of feminism as a struggle between genders, urged women to break free from the domestic sphere and find their own identity outside the home. Friedan promulgated that fulfillment could not be found through marriage and motherhood alone.

Ms. Fiamengo says feminism’s lack of encouragement for women to start a family makes them miss out on what she thinks is one of the greatest joys of human life—childbearing.

“The fact that our government doesn’t encourage marriage … or encourage couples to stay together for the good of their children, is doing a terrible disservice to the future generations,” she says.

Peter Jon Mitchell, program director for Cardus Family, says the prevalent view of marriage in Canada is that “it’s nice, but unnecessary.”

“We don’t really talk a lot about marriage and the benefits of marriage in our culture.” Mr. Mitchell also that, compared to the United States, where the two-parent privilege—the fact that children fare better in two-parent rather than single-parent households—and the benefits of marriage are part of the public discourse, Canada lags behind.

The May MLI report cites some studies showing that children in two-parent households fare better. One published by the National Library of Medicine in 2014 found such children do better physically, emotionally, and academically.

Likewise, in a 2015 research paper, David Ribar, honorary professor at the University of Melbourne, found that children who grow up with married parents enjoy more economic and family stability. Mr. Ribar argues that the benefits of marriage for children’s wellbeing are hard to replicate through policy interventions other than those that support marriage itself.

Consequences of Putting Family Role Second

Sociologist Brigitte Berger noted in her book “The Emerging Role of Women” that work is important for both sexes. Yet liberation through work means different things to different people.

To the working-class women and the poor, for whom work is a necessity, liberation means freedom from financial burden and the freedom to devote time to things that matter outside of work, such as family, community, and hobbies. Among women for whom work is not a necessity, modern thinking has led them to find identity and liberation through paid labour.

According to a 2021 survey by the Canadian Women’s Foundation, 28 percent of mothers reported difficulty keeping up with work demands, and half of mothers felt exhausted trying to balance work and childcare responsibilities.

“I think most mothers would prefer to be part-time,” says Mrs. Brandt. “They don’t actually want to leave their kids 100 percent of the time with someone else.”

She says the widespread notion that women can do it all is not realistic and can lead many to burnout. “I can’t fully parent my children well and fully do another job [outside the home], at least not the way I want to,” she says. “Something has to give; there’s not enough of me.”

Mrs. Brandt says she is not worried about her chances of returning to work at some stage.

“We live a long time nowadays. You can’t always have kids, you can’t always be with your kids when they’re young or get that time back when they’re young,” she adds. “But you could do a career later, and that’s the amazing thing about our culture, too.”

Last year, a study by the think tank Cardus found that half of Canadian women are not having as many children as they would like, and that this group reported lower life satisfaction than women who achieved their fertility goals.

Cardus senior fellow Lyman Stone noted low fertility rates are not because women want few kids, but the timeline most of them follow for school, work, self-development, and marriage leaves too few economically stable years to achieve the families they want.

One of the most striking findings of the May MLI report is that Canada has seen a marked deterioration in the mental health of young women over the last decade.

More than three-quarters of women aged 15 to 30 reported excellent or very good mental health between 2009 and 2010. Throughout the following nine years, that figure dropped 22.5 percentage points, to 54 percent. For women aged 31 to 46, mental well-being also declined, but only by 10.1 percentage points.

Source: Canadian Community Health Survey, 2003 to 2019. (Chart: Carolina Avendano/The Epoch Times)

Motherhood and Women’s Happiness

A Cardus 2023 study concluded that women’s happiness and fertility are linked. The think tank surveyed 2,700 women aged 18 to 44 about family and fertility, and found that mothers are happier than non-mothers everywhere (except when they are under 25 or living in poverty).

“The role of the mother really is to nurture and to develop children,” says Mrs. Brandt. “My husband is a wonderful nurturer, he’s fantastic at it, but my boys, even the ones that have the closest relationship with him, they still need mom … I’m still the safe place.

“I am not saying that men can’t do it, but sometimes women are built for it, and there’s nothing wrong with that.”

Danielle Brandt with her youngest son, Silas, at her Calgary home on June 1, 2024. Mrs. Brandt homeschools her oldest son, Aiden, because she saw he was falling behind in class. Seeing the positive response, she now plans to also homeschool her other two children. (Carolina Avendano/The Epoch Times)

She draws inspiration from her mother, who was also a teacher turned homemaker. Mrs. Brandt says her mother was always available for her and her three siblings, and would show up at their most important moments, including sporting events, school functions or field trips. “We felt like we were the priority because we were,” she says.

But being a stay-at-home mom is also demanding, Mrs. Brandt adds. Although it’s rewarding, she says the challenge is that there is no time off. “But at the end of the day, when I look at my children and see them peacefully sleeping, [I think to myself] ‘That’s it, that’s what this is about,’” she says. “They are the future generation. I want to pour into that, and there is no more valuable work than that.” For the Silo, Carolina Avendano.

Featured image- Danielle and Adam Brandt with their sons Silas (L), Aiden (C), and Theodore at their home in Calgary on June 1, 2024. (Carolina Avendano/The Epoch Times)

Why Are More Canadians Moving Abroad?

An increasing number of Canadians can’t afford a house or find a decent-paying job. Some can’t find a date or are fed up with the bitter politics, while others are in search of adventure, are sick of the cold winters, or simply miss the feeling of ‘being home’.

The solution they seek? Leave Canada.

The rising cost of living, record-high immigration, a stagnating economy, and political tensions are prompting rising numbers of Canadians—both native and naturalized—to leave the country.

Canada is increasingly becoming a country of emigrants, as well as a country of immigrants, experts say.

“We’re definitely seeing a lot more interest from people wanting to leave Canada,” Michael Rosmer, founder of Offshore Citizen, a Dubai-based company that offers relocation services to people around the globe. “This is disproportionate to their numbers overall.”

He said many of his clients are motivated by the increasing ability to work from anywhere, plus political tensions within Canada accompanied by a feeling of lost freedoms. Also a factor is the rising standard of living of many countries that were once far below Canada in terms of health care, education, and other services.

While Canada was once considered among the best places in the world to live, “it’s like the world has flipped,” Mr. Rosmer said. “The alternatives have gotten meaningfully better. Today if you go to Kuala Lumpur you’re going to find that it is arguably better than any Canadian city.”

Canada’s Immigration Conundrum: Economic Boon or Bust?

Immigration Minister Tells US Public Broadcaster Canada an ‘Open Country’

Some 94,576 people emigrated from Canada from mid-2022 to mid-2023, an increase of 1.8 percent from 92,876 in the year-earlier period, and up sharply from 66,627 in the period from mid-2020 to mid-2021, which fell during the pandemic lockdowns, according to data from Statistics Canada.

A study released last year by the immigration advocacy group Institute for Canadian Citizenship (ICC) showed  immigrants are also increasingly reluctant to stay, with the proportion who stick around to obtain full citizenship within 10 years of receiving permanent resident status plunging to 45.7 percent in 2021 from 60 percent in 2016 and 75.1 percent in 2001.

Cameron MacDonald, a 29-year-old from the Niagara Falls region of Ontario who left Canada in March for Japan, cited the high cost of living as the main reason for his move, which uprooted him from friends, family, and a job as an anti-fraud analyst with a major Canadian bank. He is now studying Japanese and looking for a job with a foreign firm, while living in Tokyo, which has a population density of 6,363 people per square kilometre compared to Toronto’s 4,427.8 per square kilometre.

“Here in Tokyo, the world’s biggest city, I pay $650 a month for a room that I would have had to pay $2,000 for in Toronto.” I had a routine and a cushy bank job and I was even living with my dad after a while but I still couldn’t get ahead financially.”

He said the high cost of housing in Toronto means that all of his friends of a similar age in Canada are still living with their parents and, as many of them consider starting families, they are watching his move with the thought of moving abroad themselves.

“My five-year goal includes a wife, a house, and kids and there’s no way I could afford that in Canada,” Mr. MacDonald said. “You can’t really date and find a wife when you’re living with your dad.”

“In Japan, I wake up with a smile on my face every day,” he said. “It’s like I have found a new passion—I can start a family here.

High Immigration

Like many people, Mr. MacDonald blames Canada’s rapid pace of immigration for driving up the cost of living and forcing him to move abroad.

As of Oct. 1, 2023, Canada’s population was estimated at 40,528,396, a record increase of 430,635 people in the previous three months alone, according to Statistics Canada. That growth rate, at 1.1 percent in a quarter, was the highest since 1957, amid Canada’s baby boom plus an immigration surge fueled by a refugee crisis in Hungary at the time.

In just the first nine months of last year, Canada’s population grew by 1,030,378 people, more than any other year dating back to confederation in 1867, the statistics show. And 96 percent of that growth came from immigration. Overall, the population grew 30 percent since it reached the 30 million figure in 1997.

Canada’s Plan to Welcome 500000 Immigrants by 2025. ascenda.com

Indeed, rapid population growth has outstripped economic growth in recent years, lowering the standard of living in Canada as more people compete for less housing space and place greater strains on health care, education, and other services, according to a study published in May by the Fraser Institute. The study shows Canada’s real gross domestic product per person dropped 3 percent between April 2019 and the end of last year, from $59,905 to $58,111. The only steeper drops in the 40 years covered by the study were from 1989 to 1994, with a decline of 5.3 percent, and the financial crisis of 2008 to 2009, when it dropped 5.2 percent.

Another factor propelling emigration may be the aging of the baby boomer generation. As more Canadians reach retirement age, emigration to the United States, particularly to sunny states such as Florida, is accelerating.

A study by Statistics Canada also shows that high immigration tends to push up emigration because some immigrants move back to their home country. The study showed that 15 percent of the people who immigrated to Canada between 1982 and 2017 returned within 20 years of admission.

Whatever the root cause, the interest in leaving Canada has caught the attention of the global industry of specialists offering services to wealthier emigrants around the world.

Videos created by people seeking to offer second-passport services and other relocation help are growing in popularity. “Nine Steps to Escape Canada,” a YouTube video watched 362,000 times, “5 Reasons to Leave Canada in 2024,“ watched by 261,000 and ”Canada is Dying!,” with 531,000 viewers are some of the most popular.

Jay Suresh, the founder of Goodlife Investor, which offers emigration services to people around the world looking to obtain second passports, foreign tax advantages, and other benefits, says the number of Canadians looking for dual citizenship jumped after the Canadian government banned unvaccinated people from flying or travelling by train in late 2021 until the summer of 2022.

“This was an eye-opener for a lot of people. They got frustrated with just that one citizenship and they wanted multiple citizenships,” he said in a video promoting his company. Now, he says, Canadians are nearly tied with U.S. citizens in searches for second passports, even though the United States has 10 times Canada’s population. For the Silo, Adam Brown.

Featured image: People line up to go through security screening at Pearson International Airport in Toronto on Aug. 5, 2022. (The Canadian Press/Nathan Denette)

Commonwealth Sec. General- Young People Need Our Support

Our world seems to be changing faster than ever – technologically, environmentally, socially – and in so many other ways. It is hard for any of us to keep up with the astonishing pace and scale of developments, and their impact for better or for worse on our own lives and the ways in which they affect the future of our planet. 

Email_Header_Opinion.png

Yet too often it seems that those with the greatest stake in the future, are least empowered to shape it: young people. This is something the Commonwealth has for more than 50 years been working hard to change; and never more so than today.

Population growth means that there are now more young people in the Commonwealth than ever before, and this offers choices and challenges for all involved in planning and making policy, and for young people themselves. The combined population of the Commonwealth is now 2.4 billion, of which more than 60 per cent are aged 29 or under, and one in three between the ages of 15 and 29.

Through social media, young people are more connected, informed, engaged and globally-aware than ever before. Even so, their potential to drive progress and innovation is often overlooked or remains untapped, despite pioneering Commonwealth leadership over the decades on inclusiveness and intergenerational connection.

20190731_Secretary-General_op-ed_photo_landscape.jpg

Since the 1970s, Commonwealth cooperation has supported member states with provision of education and training for youth workers, who have a central role to play in encouraging, enabling, and empowering young people. Practitioners may be of any age, and operate in many settings: youth clubs, parks, schools, prisons, hospitals, on the streets and in rural areas.

Commonwealth approaches and engagement recognise the dynamic role youth workers can play in addressing young people’s welfare and rights, and in connecting and involving them in decision-making process at all levels. In some Commonwealth countries, youth work is a distinct profession, acknowledged in policy and legislation to deliver and certify quality of practice, including through education and training. In others it is institutionalised less formally through custom and practice. In some countries there is little or no youth work activity – formal or informal.

To advance the cause of young people, and their direct participation in nation-building and the issues affecting them, the Commonwealth Secretariat supports the governments of member countries with technical assistance relating to policy and legislation in professionalising youth work. A pioneering Commonwealth contribution is the Commonwealth Diploma in Youth Development, which has been delivered in almost 30 Commonwealth member states.

The new Commonwealth Degree and Diploma in Youth Work provides countries with a resource for developing human capital using a consortium business model that makes the training resources accessible at low cost for persons in low income contexts.

The Commonwealth also supports the global collectivisation of youth work professionals through the emerging Commonwealth Alliance of Youth Workers’ Associations (CAYWA), an international association of professional associations dedicated to advancing youth work across the Commonwealth. CAYWA facilitates the cross-pollination of ideas and collegial support among youth work practitioners, and is developing into a unified global influence providing support to governments and all stakeholders in youth work profession.

Expertise is offered by the Commonwealth Secretariat with the design of short courses and outcomes frameworks that support just-in-time and refresher training to augment diploma and degree qualifications. Guidance is also offered on establishing youth worker associations that can help towards building and sustaining professional standards, thereby safeguarding the quality of services offered to young people.

In 2019 a conference in Malta bringing together youth workers from throughout the Commonwealth continued to build recognition and professional standards of youth work in member countries. Among outcomes was the establishment of a week-long celebration of the extraordinary services of full-time practitioners and volunteers – recognized as youth workers – who support the personal development and empowerment of young people.

Youth Work Week, with the theme ‘Youth Work in Action’, was observed 4 -10 November 2019 in the 53 member states of the Commonwealth including Canada.

Looking forward to the 2020 Commonwealth Heads of Government Meeting (CHOGM) in Rwanda next June, Youth Work Week will bring into sharper focus the challenges young people in our member countries face, and the opportunities they are offered – including through Commonwealth connection.

By recruiting and placing appropriately trained and properly supported youth workers, communities in Commonwealth countries can help young people channel their energies and talent in positive directions, especially during the transition from education into work.

Supported by positive role models and with mentors to whom they can relate, young people can be guided towards healthy and productive lives. When equipped to develop as well-rounded individuals and to contribute to the societies in which they live, young people can make immense contributions towards transforming our communities and our Commonwealth and – above all – to their own future.

For The Silo, by Patricia Scotland, Commonwealth Secretary-General

All Parties Support Ontario Greenbelt And Recognize Immense Values

Last week, a video was released showing Ontario’s PC Party leader Doug Ford promising to open up a “big chunk” of the Greenbelt to allow development on its protected areas, an idea he attributed to the “biggest developers in this country.”   

Our Executive Director, Tim Gray responded in the news that this would have severe consequences and allow land speculators to build massive subdivisions, at immense profits, on farms, forests and natural areas currently protected in the Greenbelt.

Watch Tim Gray’s interview on CTV news.

Ontario’s PC Party leader Doug Ford later reversed his position. This is consistent with polls that suggest more than 89 per cent of Ontarians support the protection of the Greenbelt. Ontarians like you.

The good news is that now all parties support the Greenbelt and recognize its immense values. Thank you for your help in securing the future of farmland, forests and water systems in Ontario. 

Over the last few months, many of you signed petitions supporting expansion of the Greenbelt. Your voice matters now more than ever. We encourage you to ask candidates questions on their views during the upcoming provincial and municipal elections.

It’s time to set the record straight.

The Greenbelt does not constrain housing supply or cause high house prices. In fact, municipal data shows that there is enough land available to provide for housing development within existing Greater Toronto and Hamilton Area urban boundaries until 2031.

The best way to address housing prices and supply in our region is by directing growth to existing urban areas, limiting sprawl, and building different kinds of affordable homes close to transit.

Read our latest blog highlighting 7 facts about the Greenbelt and what really impacts housing prices in the Greater Toronto and Hamilton Area. 

Thank you,

Susan Lloyd Swail
Livable Communities, Senior Manager