Tag Archives: pesticide

The Production And Distribution Of Organic Food

If you want to create healthier habits for yourself and your loved ones, it might be a good time to switch to organic foods. The benefits of this diet are numerous, and with the global expansion of the market, organic food has become readily available to all.

Ask yourself — what kind of food do I actually eat, and how is this food produced? You may not like the answer, but there is one simple solution to this problem — organic food. This type of diet may not look as appealing as GMO, but trust us when we say, it tastes the same, and it is not bad for your health.

Who Are the Leading Manufacturers of Organic Food?

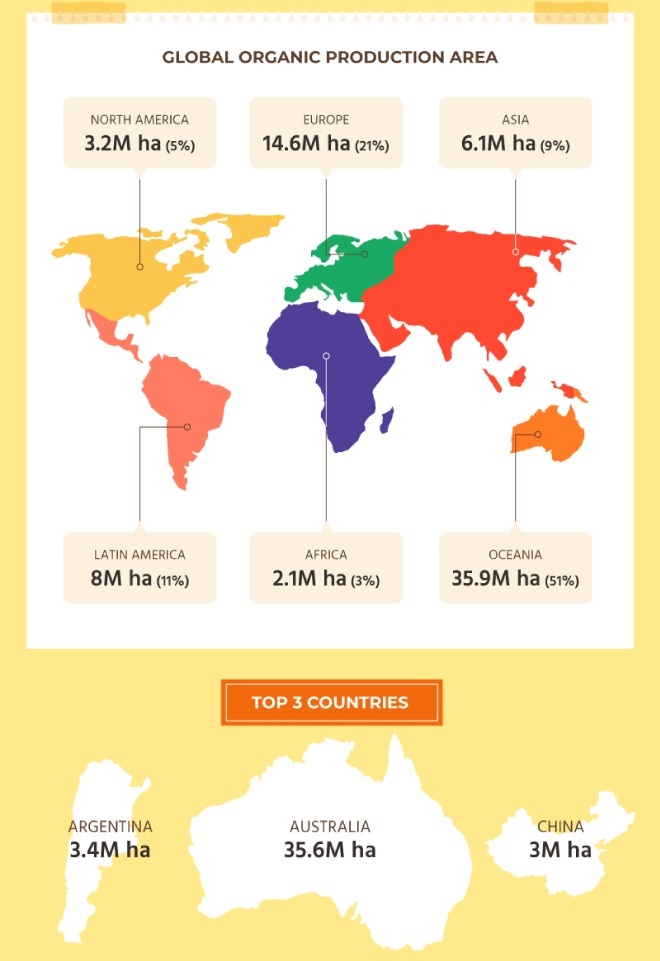
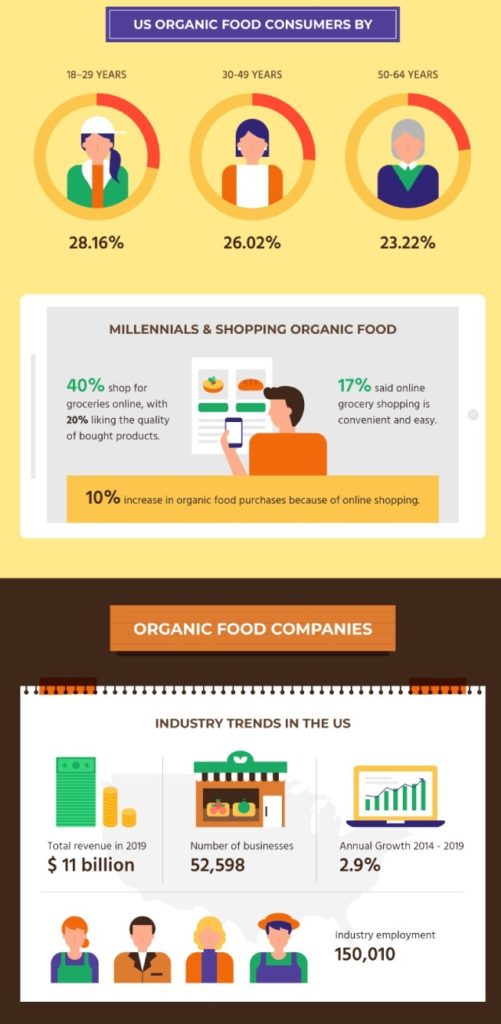
If we look at the bigger picture of organic food production, the leading place belongs to Australia where organic farms occupy an area of 35.9 million ha, followed by Europe with 14.8 million ha, South America with 8 million ha, Asia with 6.1 million ha, North America with 3.2 million ha, and finally Africa with 2.1 million ha.

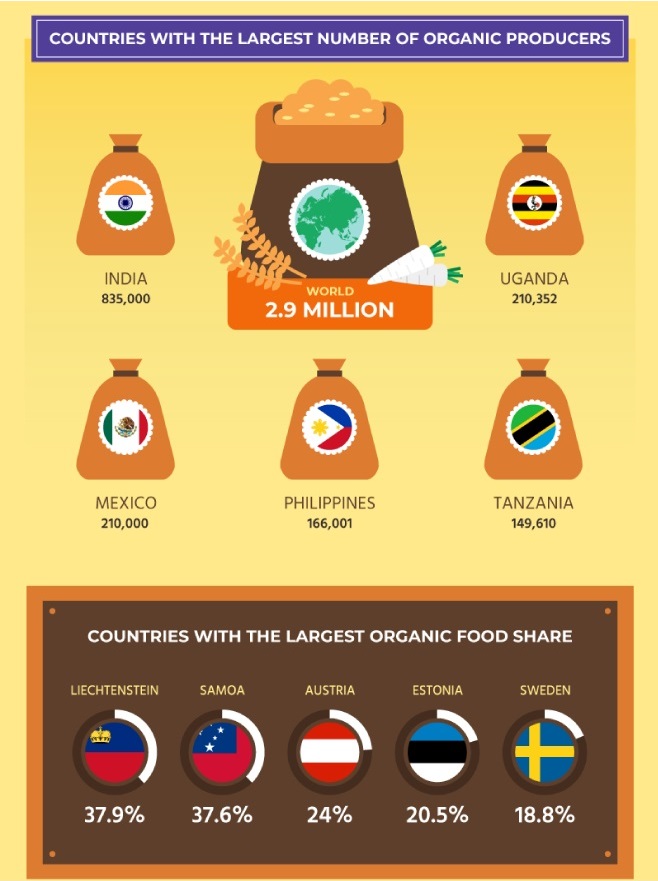
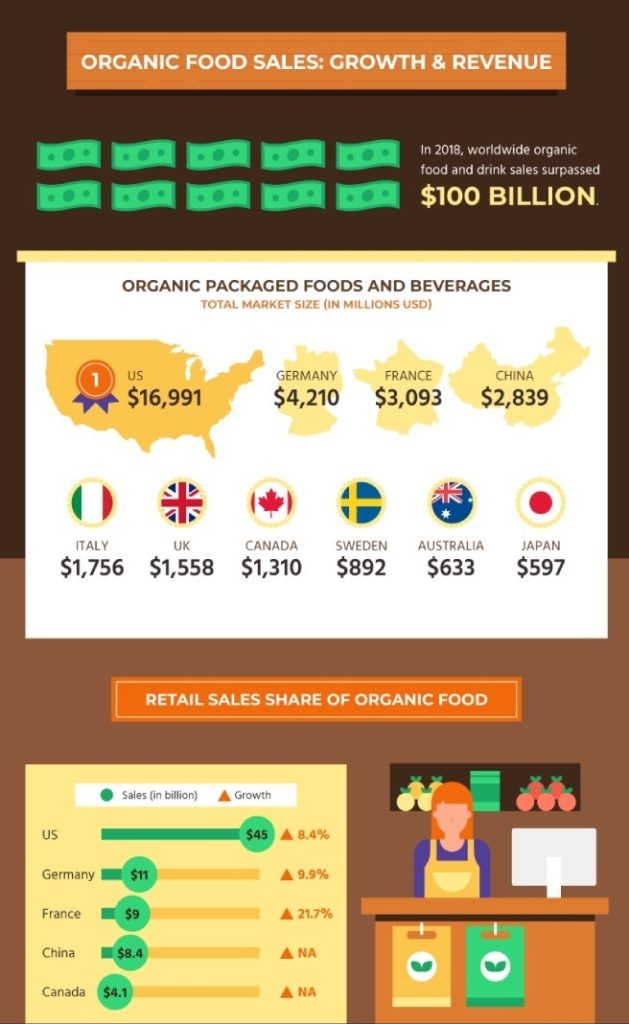
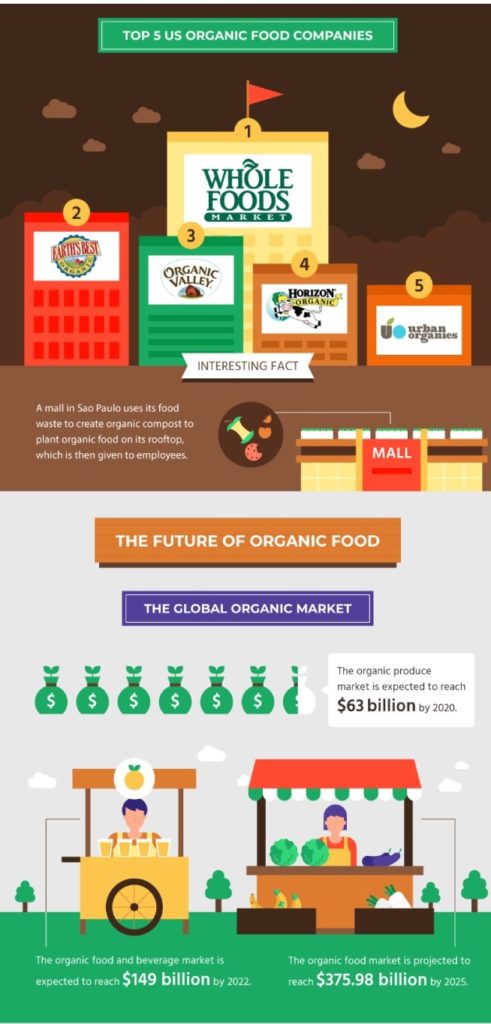
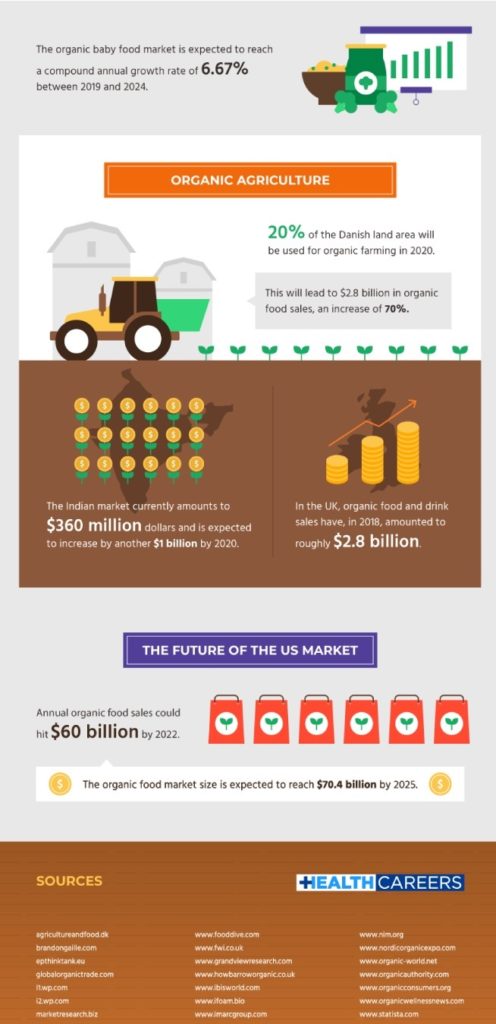
However, India has the most considerable number of registered organic producers – a whopping 835,000. Sounds like a big number? The organic industry is expanding every year and is expected to generate over $60 billion usd by the end of this year (2022).

The reason for this rapid growth is that more and more people in different countries are opting for this type of food.

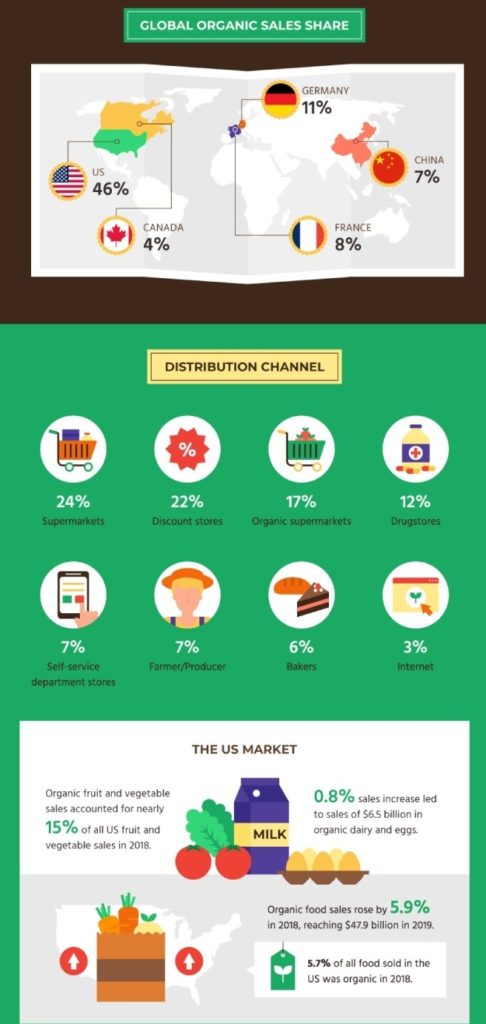
If we look at the 2016 American market, we can see that organic food has reached a staggering $38.9 billion in organic food retail sales. These numbers are showing that the production (and consumption) of organic products is on the rise, which is actually great news!

What About the Consumers?

Many people are living a fast-paced lifestyle, and this means that they spend much time planning their meals or doing workouts. This type of unhealthy eating regime can have a detrimental effect on our health.

According to stats, 57% of children are well on their way to being obese due to the consumption of unhealthy foods and foods that contain empty calories.

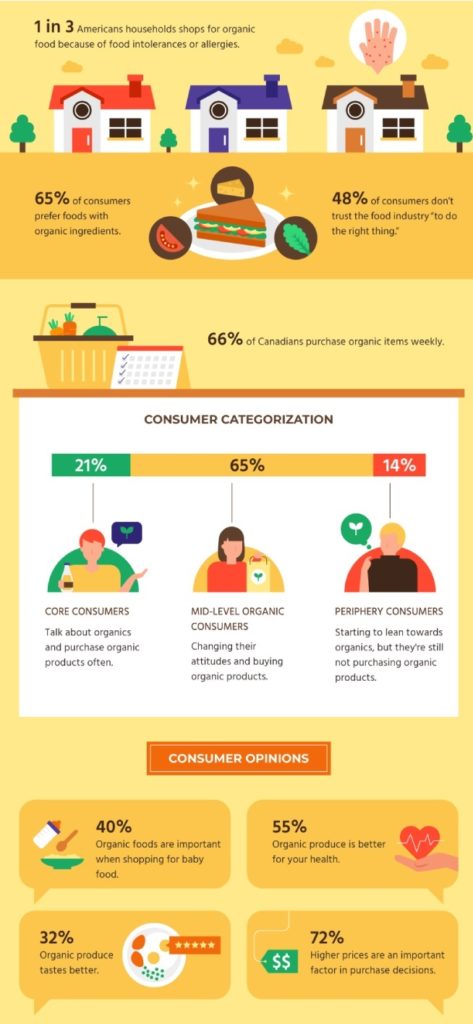
Fortunately, this trend is declining as 51% of parents opt for healthier foods, and they are even willing to pay 3-4% more for organic food to create healthier eating habits for their young ones.

An increasing number of people are becoming aware of the hazardous effects of food additives and supplements that may cause numerous health disorders. According to a survey conducted in France, about 70,000 people who consumed organic foods had 25% fewer cancer diagnosis than the ones who consumed conventional food.

Considering these facts, organic food consumption is expected to increase in the coming years.

Quality-Price Ratio

The production of organic food requires compliance with certain regulations that vary from country to country. Organic food refers to foods that are not genetically modified, not treated with pesticides and growth factors, and that are grown on land that doesn’t contain chemical substances such as artificial fertilizers.

You must have wondered how organic production manages to sustain itself. The secret is in prevention. Organic producers put a lot of time, resources, and effort to create the end product we find in the markets. That reflects a lot on the price. Organic food is 7.5% more expensive on average than non-organic.

The reason for this is that, despite the thorough preventative measures, organic food is more affected by various diseases and pollutants. That said, producers could lose their entire annual organic food production and end up losing substantial amounts of money.

That said, organic food is more expensive than conventional. However, if you decided to go organic, there are ways you can buy this type of food at a more affordable price. Here’s how:

  • buy directly from the manufacturer
  • compare prices
  • buy seasonal food
  • obtain membership in a community-supported agricultural farm or CSA.

Bottom Line

All of this considered, conventional food may not be a cheaper option than organic food. Why? Because good health is invaluable. So if it means that we must spend a couple of extra bucks to get rid of lousy eating habits, we’d say, go for it! For the Silo, Tarun Reddy.

Quirky Doc About One Man’s Quest For Supreme Tea

The movie poster says it all

Invest a little over an hour watching this documentary about tea and you might find yourself contemplating a new connection between rural farming communities and the tea farmers of China. That’s because All in this Tea deals with all aspects of Chinese tea production, but takes a special interest in how a new demand for high quality, organic Chinese tea is creating new opportunities for Chinese rural farmers.

The story begins by focusing on David Lee Hoffman’s elusive quest for rare and perfect teas.

David is a renowned tea importer and to say that he loves tea is an understatement. Based on the passion and knowledge shown in this doc, he seems to live for the stuff. Hoffman sees himself as a cultural zealot, promoting the rich history of simple Chinese farming practices and educating the western world on the merits of drinking pure, organic tea produced in the “Chinese way”.

He makes the act of producing tea seem like the ultimate expression of agricultural art.

His journey takes him to remote, obscure farms where he begins the process of encouraging the Chinese tea board to end mass farming practices and belligerent pesticide uses. His goal is to create a new tea farming economy, one where quality takes precedence over quantity.  If you like tea or if you want to learn more about Chinese tea farming practices, If you’re a tea drinker or know someone who is (don’t we all?) then All in this Tea is the right documentary for you.  For the Silo, Jarrod Barker.

Cost Of Marijuana In 120 Cities And How Much Tax Revenue If Legalized

First a few quick facts….

‏Tokyo, Japan has the most expensive cannabis‏ ‏, at 32.66 USD per gram. ‏

‏Quito, Ecuador has the least expensive marijuana‏ ‏, at 1.34 USD per gram.‏

‏Based on the average US marijuana tax rates currently implemented, ‏ ‏New York City could generate the highest potential tax revenue by legalizing weed‏ ‏, with 156.40 million USD per year. New York City also has the highest consumption rate of cannabis, at 77.44 metric tons per year.‏

‏Cannabis costs ‏ ‏$7.82 per gram in Toronto, Canada‏ ‏. ‏

‏Berlin, Germany – ‏ ‏Automatic cultivator device, ‏ ‏Seedo‏ ‏, after much research and data gathering, previously released the 2018 Cannabis Price Index, detailing the cost of marijuana in 120 global cities. Seedo is one of the many new ventures embracing the newly legalized cannabis industry. Their main goal is to allow both medicinal and recreational consumers to grow their own supply, avoiding extra taxes and bypassing harmful pesticides. The aim of this study is to illustrate the continuous need for legislative reform on cannabis use around the world, and to determine if there are any lessons to be learned from those cities at the forefront of marijuana legalisation.

‏Although Seedo’s technology enables smokers to get off the grid, this study considers one of the biggest byproducts of legalising cannabis—the potential tax revenue for the local government body. For this reason, Seedo decided not only to research the cost of cannabis around the world, but also to calculate how much potential tax a city could generate if they were to legalise marijuana. ‏

‏The study began first by selecting 120 cities across the world, including locations where cannabis is currently legal, illegal and partially legal, and where marijuana consumption data is available. Then, they looked into the price of weed per gram in each city. To calculate how much potential tax a city could make by legalising weed, Seedo investigated how much tax is paid on the most popular brand of cigarettes, as this offers the closest comparison. They then looked at what percentage marijuana is currently taxed in cities where it’s already legalised in the US. ‏

‏“This study has revealed some incredible insights into the kind of tax revenue that legalising weed could generate.” says Uri Zeevi, CMO at Seedo. “Take New York City for instance, which has the highest consumption level in the study at 77.44 metric tons of cannabis per year. If they taxed marijuana at the average US cannabis tax level, the city could make $‏ ‏156.4‏ ‏ million in potential tax revenue per year. This is equivalent to providing nearly 3 months worth of free school meals to every single public school kid in New York City.” ‏

‏The table below reveals a sample of the results for ‏ ‏Toronto, Canada‏ ‏:‏

‏City‏

‏Legality‏

‏Price per gram, US$‏

‏Total possible tax collection, if taxed at cigarette level, mil US$‏

‏Total possible tax collection, if taxed at average US marijuana taxes, mil US$‏

‏Total consumption in metric tons‏

‏Toronto‏

‏Partial‏

‏7.82‏

‏124.15‏

‏33.38‏

‏22.75‏

‏The table below shows the ‏ ‏top 10 most and least expensive cities for cannabis‏ ‏:‏

‏Top 10 Most Expensive Cities‏

‏Top 10 Least Expensive Cities‏

‏#‏

‏City‏

‏Country‏

‏Legality‏

‏Price per gram, US$‏

‏#‏

‏City‏

‏Country‏

‏Legality‏

‏Price per gram, US$‏

‏1‏

‏Tokyo‏

‏Japan‏

‏Illegal‏

‏32.66‏

‏1‏

‏Quito‏

‏Ecuador‏

‏Partial‏

‏1.34‏

‏2‏

‏Seoul‏

‏South Korea‏

‏Illegal‏

‏32.44‏

‏2‏

‏Bogota‏

‏Colombia‏

‏Partial‏

‏2.20‏

‏3‏

‏Kyoto‏

‏Japan‏

‏Illegal‏

‏29.65‏

‏3‏

‏Asuncion‏

‏Paraguay‏

‏Partial‏

‏2.22‏

‏4‏

‏Hong Kong‏

‏China‏

‏Illegal‏

‏27.48‏

‏4‏

‏Jakarta‏

‏Indonesia‏

‏Illegal‏

‏3.79‏

‏5‏

‏Bangkok‏

‏Thailand‏

‏Partial‏

‏24.81‏

‏5‏

‏Panama City‏

‏Panama‏

‏Illegal‏

‏3.85‏

‏6‏

‏Dublin‏

‏Ireland‏

‏Illegal‏

‏21.63‏

‏6‏

‏Johannesburg‏

‏South Africa‏

‏Illegal‏

‏4.01‏

‏7‏

‏Tallinn‏

‏Estonia‏

‏Partial‏

‏20.98‏

‏7‏

‏Montevideo‏

‏Uruguay‏

‏Legal‏

‏4.15‏

‏8‏

‏Shanghai‏

‏China‏

‏Illegal‏

‏20.82‏

‏8‏

‏Astana‏

‏Kazakhstan‏

‏Illegal‏

‏4.22‏

‏9‏

‏Beijing‏

‏China‏

‏Illegal‏

‏20.52‏

‏9‏

‏Antwerp‏

‏Belgium‏

‏Partial‏

‏4.29‏

‏10‏

‏Oslo‏

‏Norway‏

‏Partial‏

‏19.14‏

‏10‏

‏New Delhi‏

‏India‏

‏Partial‏

‏4.38‏

‏N.B. These tables are a sample of the full results. To find the complete results for all 120 cities, please see the bottom of the press release. ‏

‏The table below shows the ‏ ‏top 10 cities who could generate the most potential tax ‏ ‏by legalising cannabis, if taxed at the same rate as the most popular cigarette brand:‏

‏#‏

‏City‏

‏Country‏

‏Legality‏

‏Price per gram, US$‏

‏% of cigarette tax‏

‏Possible tax revenue, mil US$ ‏

‏1‏

‏Cairo‏

‏Egypt‏

‏Illegal‏

‏16.15‏

‏73.13‏

‏384.87‏

‏2‏

‏New York‏

‏USA‏

‏Partial‏

‏10.76‏

‏42.54‏

‏354.48‏

‏3‏

‏London‏

‏UK‏

‏Illegal‏

‏9.20‏

‏82.16‏

‏237.35‏

‏4‏

‏Sydney‏

‏Australia‏

‏Partial‏

‏10.79‏

‏56.76‏

‏138.36‏

‏5‏

‏Karachi‏

‏Pakistan‏

‏Illegal‏

‏5.32‏

‏60.7‏

‏135.48‏

‏6‏

‏Melbourne‏

‏Australia‏

‏Partial‏

‏10.84‏

‏56.76‏

‏132.75‏

‏7‏

‏Moscow‏

‏Russia‏

‏Partial‏

‏11.84‏

‏47.63‏

‏128.97‏

‏8‏

‏Toronto‏

‏Canada‏

‏Partial‏

‏7.82‏

‏69.8‏

‏124.15‏

‏9‏

‏Chicago‏

‏USA‏

‏Partial‏

‏11.46‏

‏42.54‏

‏119.61‏

‏10‏

‏Berlin‏

‏Germany‏

‏Partial‏

‏13.53‏

‏72.9‏

‏114.77‏

‏N.B. % of cigarette tax refers to the tax percentage on the most popular brand. Possible tax revenue refers to the total possible tax collection per year, if taxed at cigarette level. For a full explanation of how the study was conducted, please see the methodology at the bottom of the press release. ‏

‏The table below shows the ‏ ‏top 10 cities who could generate the most potential tax‏ ‏ by legalising cannabis, if taxed at the average US marijuana tax rate:‏

‏#‏

‏City‏

‏Country‏

‏Legality‏

‏Price per gram, US$‏

‏Possible tax revenue, mil US$‏

‏1‏

‏New York‏

‏USA‏

‏Partial‏

‏10.76‏

‏156.4‏

‏2‏

‏Cairo‏

‏Egypt‏

‏Illegal‏

‏16.15‏

‏98.78‏

‏3‏

‏London‏

‏UK‏

‏Illegal‏

‏9.20‏

‏54.22‏

‏4‏

‏Chicago‏

‏USA‏

‏Partial‏

‏11.46‏

‏52.77‏

‏5‏

‏Moscow‏

‏Russia‏

‏Partial‏

‏11.84‏

‏50.82‏

‏6‏

‏Sydney‏

‏Australia‏

‏Partial‏

‏10.79‏

‏45.75‏

‏7‏

‏Melbourne‏

‏Australia‏

‏Partial‏

‏10.84‏

‏43.9‏

‏8‏

‏Karachi‏

‏Pakistan‏

‏Illegal‏

‏5.32‏

‏41.89‏

‏9‏

‏Houston‏

‏USA‏

‏Partial‏

‏10.03‏

‏39.32‏

‏10‏

‏Toronto‏

‏Canada‏

‏Partial‏

‏7.82‏

‏33.38‏

‏N.B. Possible tax revenue refers to the total possible tax collection per year, if taxed at average US marijuana tax rate.‏

‏The table below shows the‏ ‏ top 10 cities with the highest and lowest consumption of cannabis, ‏ ‏per year:‏

‏Highest Consumers of Cannabis‏

‏ Lowest Consumers of Cannabis‏

‏#‏

‏City‏

‏Country‏

‏Legality‏

‏Price per gram, US$‏

‏Total consumption, metric tons‏

‏#‏

‏City‏

‏Country‏

‏Legality‏

‏Price per gram, US$‏

‏Total consumption, metric tons‏

‏1‏

‏New York‏

‏USA‏

‏Partial‏

‏10.76‏

‏77.44‏

‏1‏

‏Singapore‏

‏Singapore‏

‏Illegal‏

‏14.01‏

‏0.02‏

‏2‏

‏Karachi‏

‏Pakistan‏

‏Illegal‏

‏5.32‏

‏41.95‏

‏2‏

‏Santo Domingo‏

‏Dominican Rep.‏

‏Illegal‏

‏6.93‏

‏0.16‏

‏3‏

‏New Delhi‏

‏India‏

‏Partial‏

‏4.38‏

‏38.26‏

‏3‏

‏Kyoto‏

‏Japan‏

‏Illegal‏

‏29.65‏

‏0.24‏

‏4‏

‏Los Angeles‏

‏USA‏

‏Legal‏

‏8.14‏

‏36.06‏

‏4‏

‏Thessaloniki‏

‏Greece‏

‏Partial‏

‏13.49‏

‏0.29‏

‏5‏

‏Cairo‏

‏Egypt‏

‏Illegal‏

‏16.15‏

‏32.59‏

‏5‏

‏Luxembourg City‏

‏Luxembourg‏

‏Partial‏

‏7.26‏

‏0.32‏

‏6‏

‏Mumbai‏

‏India‏

‏Partial‏

‏4.57‏

‏32.38‏

‏6‏

‏Panama City‏

‏Panama‏

‏Illegal‏

‏3.85‏

‏0.37‏

‏7‏

‏London‏

‏UK‏

‏Illegal‏

‏9.20‏

‏31.4‏

‏7‏

‏Reykjavik‏

‏Iceland‏

‏Illegal‏

‏15.92‏

‏0.44‏

‏8‏

‏Chicago‏

‏USA‏

‏Partial‏

‏11.46‏

‏24.54‏

‏8‏

‏Asuncion‏

‏Paraguay‏

‏Partial‏

‏2.22‏

‏0.46‏

‏9‏

‏Moscow‏

‏Russia‏

‏Partial‏

‏11.84‏

‏22.87‏

‏9‏

‏Colombo‏

‏Sri Lanka‏

‏Illegal‏

‏9.12‏

‏0.59‏

‏10‏

‏Toronto‏

‏Canada‏

‏Partial‏

‏7.82‏

‏22.75‏

‏10‏

‏Manila‏

‏Philippines‏

‏Illegal‏

‏5.24‏

‏0.6‏

‏N.B. Total consumption is calculated per annum. ‏

‏Additional quotes:‏

‏“The way that the legalised cannabis industry is rapidly evolving alongside new technologies shows how innovative emerging tech companies are today.” says Uri Zeevi, CMO at Seedo. “Take the way that cannabis and cryptocurrency have joined forces, with ‏ ‏examples such as HempCoin or nezly, which manage processes and payments in the new marijuana industry.‏ ‏ When you consider too the potential that these new technologies have to disrupt the cannabis industry, there’s no denying that these are very exciting times.” ‏

‏“At Seedo, we’ve built technology that helps regular smokers to grow cannabis plants of the utmost quality from the comfort of their own home, avoiding pesticides and taking ownership of their personal supply.” says Uri Zeevi, CMO at Seedo. “We believe that by understanding the cost of weed around the world, we can help to educate smokers about the potential financial benefits of hydroponic growing technology.” ‏

‏“That illegal cannabis use is so high in countries that still carry the death penalty, such as Pakistan and Egypt, those in power ought to see how desperately new legislation is needed.” comments Uri Zeevi, CMO at Seedo. “By removing the criminal element from marijuana, governments will then able to more safely regulate production, take away power from underground gangs, and as we’ve shown in this study, generate huge tax revenues.”‏

‏Further findings:‏

‏New York City, USA has the highest consumption rate of cannabis‏ ‏, at 77.44 metric tons per year.‏

‏Boston, USA has the most expensive cannabis of all the cities where it’s legal‏ ‏, at 11.01 USD, while Montevideo, Uruguay has the least expensive at 4.15 USD. ‏

‏While Tokyo, Japan has the most expensive cannabis of all cities where it’s illegal, at 32.66 USD, ‏ ‏Jakarta, Indonesia has the least expensive at 3.79 USD, despite being classed as a Group 1 drug with harsh sentences such as life imprisonment and the death penalty.‏ ‏ ‏

‏For cities where cannabis is partially legal, Bangkok, Thailand has the most expensive at 24.81 USD, while Quito, Ecuador has the least expensive at 1.34 USD. ‏

‏Bulgaria has the highest tax rates for the most popular brand of cigarettes, at 82.65%, while Paraguay has the lowest, with rates of 16%. ‏

‏Cairo, Egypt would gain the most revenue in tax if they were to legalise cannabis‏ ‏ and tax it as the same rate as cigarettes, at 384.87 million USD. Singapore, Singapore would gain the least, at 0.14 million USD, due in part to the city’s low consumption of marijuana at 0.02 metric tons per annum.‏

‏Based on the average US marijuana tax rates currently implemented,‏ ‏ New York City could generate the highest potential tax revenue by legalising weed, with 156.4 million USD per year‏ ‏. Singapore, Singapore would gain the least, at 0.04 million USD

‏About “Seedo”‏ ‏: Seedo is a fully automated hydroponic growing device which lets you grow your own medicinal herbs and vegetables from the comfort of your own home. Seedo controls and monitors the growing process, from seed to plant, while providing optimal lab conditions to assure premium quality produce year-round. Seedo’s goal is to simplify the growing process, making it accessible for everyone, without compromising on quality. ‏

‏The full results of the 2018 Cannabis Price Index:‏

‏#‏

‏City‏

‏Country‏

‏Legality‏

‏Price per gram, US$‏

‏Taxes of cigarettes, % of the most sold brand‏

‏Total possible tax collection, if taxed at cigarette level, mil US$‏

‏Total possible tax collection, if taxed at average US marijuana taxes, mil US$‏

‏Total Consumption in metric tons‏

‏1‏

‏Tokyo‏

‏Japan‏

‏Illegal‏

‏32.66‏

‏64.36‏

‏32.14‏

‏9.37‏

‏1.53‏

‏2‏

‏Seoul‏

‏South Korea‏

‏Illegal‏

‏32.44‏

‏61.99‏

‏31.61‏

‏9.57‏

‏1.57‏

‏3‏

‏Kyoto‏

‏Japan‏

‏Illegal‏

‏29.65‏

‏64.36‏

‏4.64‏

‏1.35‏

‏0.24‏

‏4‏

‏Hong Kong‏

‏China‏

‏Illegal‏

‏27.48‏

‏44.43‏

‏19.72‏

‏8.33‏

‏1.62‏

‏5‏

‏Bangkok‏

‏Thailand‏

‏Partial‏

‏24.81‏

‏73.13‏

‏99.11‏

‏25.44‏

‏5.46‏

‏6‏

‏Dublin‏

‏Ireland‏

‏Illegal‏

‏21.63‏

‏77.80‏

‏29.31‏

‏7.07‏

‏1.74‏

‏7‏

‏Tallinn‏

‏Estonia‏

‏Partial‏

‏20.98‏

‏77.24‏

‏22.13‏

‏5.38‏

‏1.37‏

‏8‏

‏Shanghai‏

‏China‏

‏Illegal‏

‏20.82‏

‏44.43‏

‏49.12‏

‏20.75‏

‏5.31‏

‏9‏

‏Beijing‏

‏China‏

‏Illegal‏

‏20.52‏

‏44.43‏

‏43.10‏

‏18.21‏

‏4.73‏

‏10‏

‏Oslo‏

‏Norway‏

‏Partial‏

‏19.14‏

‏68.83‏

‏19.28‏

‏5.26‏

‏1.46‏

‏11‏

‏Washington, DC‏

‏USA‏

‏Partial‏

‏18.08‏

‏42.54‏

‏47.51‏

‏20.96‏

‏6.18‏

‏12‏

‏Cairo‏

‏Egypt‏

‏Illegal‏

‏16.15‏

‏73.13‏

‏384.87‏

‏98.78‏

‏32.59‏

‏13‏

‏Reykjavik‏

‏Iceland‏

‏Illegal‏

‏15.92‏

‏56.40‏

‏3.97‏

‏1.32‏

‏0.44‏

‏14‏

‏Belfast‏

‏Ireland‏

‏Illegal‏

‏15.81‏

‏77.80‏

‏13.55‏

‏3.27‏

‏1.10‏

‏15‏

‏Minsk‏

‏Belarus‏

‏Illegal‏

‏15.80‏

‏51.15‏

‏9.08‏

‏3.33‏

‏1.12‏

‏16‏

‏Athens‏

‏Greece‏

‏Partial‏

‏14.95‏

‏79.95‏

‏7.42‏

‏1.74‏

‏0.62‏

‏17‏

‏Auckland‏

‏New Zealand‏

‏Partial‏

‏14.77‏

‏77.34‏

‏106.03‏

‏25.73‏

‏9.28‏

‏18‏

‏Munich‏

‏Germany‏

‏Partial‏

‏14.56‏

‏72.90‏

‏50.90‏

‏13.10‏

‏4.80‏

‏19‏

‏Helsinki‏

‏Finland‏

‏Partial‏

‏14.42‏

‏81.53‏

‏27.12‏

‏6.24‏

‏2.31‏

‏20‏

‏Singapore‏

‏Singapore‏

‏Illegal‏

‏14.01‏

‏66.23‏

‏0.14‏

‏0.04‏

‏0.02‏

‏21‏

‏Berlin‏

‏Germany‏

‏Partial‏

‏13.53‏

‏72.90‏

‏114.77‏

‏29.55‏

‏11.64‏

‏22‏

‏Stuttgart‏

‏Germany‏

‏Partial‏

‏13.50‏

‏72.90‏

‏20.20‏

‏5.20‏

‏2.05‏

‏23‏

‏Thessaloniki‏

‏Greece‏

‏Partial‏

‏13.49‏

‏79.95‏

‏3.17‏

‏0.75‏

‏0.29‏

‏24‏

‏Stockholm‏

‏Sweden‏

‏Illegal‏

‏13.20‏

‏68.84‏

‏15.06‏

‏4.11‏

‏1.66‏

‏25‏

‏Vienna‏

‏Austria‏

‏Partial‏

‏12.87‏

‏74.00‏

‏59.21‏

‏15.02‏

‏6.22‏

‏26‏

‏Copenhagen‏

‏Denmark‏

‏Partial‏

‏12.47‏

‏74.75‏

‏20.65‏

‏5.18‏

‏2.22‏

‏27‏

‏Moscow‏

‏Russia‏

‏Partial‏

‏11.84‏

‏47.63‏

‏128.97‏

‏50.82‏

‏22.87‏

‏28‏

‏Hamburg‏

‏Germany‏

‏Partial‏

‏11.64‏

‏72.90‏

‏50.16‏

‏12.92‏

‏5.91‏

‏29‏

‏Chicago‏

‏USA‏

‏Partial‏

‏11.46‏

‏42.54‏

‏119.61‏

‏52.77‏

‏24.54‏

‏30‏

‏Philadelphia‏

‏USA‏

‏Partial‏

‏11.30‏

‏42.54‏

‏68.37‏

‏30.16‏

‏14.22‏

‏31‏

‏Bucharest‏

‏Romania‏

‏Partial‏

‏11.18‏

‏75.41‏

‏17.23‏

‏4.29‏

‏2.04‏

‏32‏

‏Cologne‏

‏Germany‏

‏Partial‏

‏11.14‏

‏72.90‏

‏28.51‏

‏7.34‏

‏3.51‏

‏33‏

‏Geneva‏

‏Switzerland‏

‏Partial‏

‏11.12‏

‏61.20‏

‏5.90‏

‏1.81‏

‏0.87‏

‏34‏

‏Boston‏

‏USA‏

‏Legal‏

‏11.01‏

‏42.54‏

‏28.59‏

‏12.61‏

‏6.10‏

‏35‏

‏Adelaide‏

‏Australia‏

‏Partial‏

‏10.91‏

‏56.76‏

‏41.60‏

‏13.75‏

‏6.72‏

‏36‏

‏Istanbul‏

‏Turkey‏

‏Partial‏

‏10.87‏

‏82.13‏

‏21.79‏

‏4.98‏

‏2.44‏

‏37‏

‏Melbourne‏

‏Australia‏

‏Partial‏

‏10.84‏

‏56.76‏

‏132.75‏

‏43.90‏

‏21.58‏

‏38‏

‏Sydney‏

‏Australia‏

‏Partial‏

‏10.79‏

‏56.76‏

‏138.36‏

‏45.75‏

‏22.59‏

‏39‏

‏New York‏

‏USA‏

‏Partial‏

‏10.76‏

‏42.54‏

‏354.48‏

‏156.40‏

‏77.44‏

‏40‏

‏Düsseldorf‏

‏Germany‏

‏Partial‏

‏10.70‏

‏72.90‏

‏15.82‏

‏4.07‏

‏2.03‏

‏41‏

‏Brisbane‏

‏Australia‏

‏Partial‏

‏10.63‏

‏56.76‏

‏66.88‏

‏22.12‏

‏11.09‏

‏42‏

‏Hanover‏

‏Germany‏

‏Partial‏

‏10.51‏

‏72.90‏

‏13.46‏

‏3.47‏

‏1.76‏

‏43‏

‏Prague‏

‏Czech Rep.‏

‏Partial‏

‏10.47‏

‏77.42‏

‏63.95‏

‏15.50‏

‏7.89‏

‏44‏

‏Frankfurt‏

‏Germany‏

‏Partial‏

‏10.29‏

‏72.90‏

‏18.06‏

‏4.65‏

‏2.41‏

‏45‏

‏Wellington‏

‏New Zealand‏

‏Partial‏

‏10.11‏

‏77.34‏

‏19.53‏

‏4.74‏

‏2.50‏

‏46‏

‏Dallas‏

‏USA‏

‏Partial‏

‏10.03‏

‏42.54‏

‏51.01‏

‏22.50‏

‏11.95‏

‏47‏

‏Houston‏

‏USA‏

‏Partial‏

‏10.03‏

‏42.54‏

‏89.13‏

‏39.32‏

‏20.89‏

‏48‏

‏Vilnius‏

‏Lithuania‏

‏Illegal‏

‏10.00‏

‏75.76‏

‏5.20‏

‏1.29‏

‏0.69‏

‏49‏

‏Zurich‏

‏Switzerland‏

‏Partial‏

‏9.71‏

‏61.20‏

‏10.33‏

‏3.17‏

‏1.74‏

‏50‏

‏Montpellier‏

‏France‏

‏Illegal‏

‏9.70‏

‏80.30‏

‏12.21‏

‏2.85‏

‏1.57‏

‏51‏

‏Canberra‏

‏Australia‏

‏Partial‏

‏9.65‏

‏56.76‏

‏10.96‏

‏3.63‏

‏2.00‏

‏52‏

‏Zagreb‏

‏Croatia‏

‏Partial‏

‏9.43‏

‏75.26‏

‏24.35‏

‏6.07‏

‏3.43‏

‏53‏

‏Nice‏

‏France‏

‏Illegal‏

‏9.40‏

‏80.30‏

‏15.80‏

‏3.69‏

‏2.09‏

‏54‏

‏Phoenix‏

‏USA‏

‏Partial‏

‏9.35‏

‏42.54‏

‏58.26‏

‏25.71‏

‏14.65‏

‏55‏

‏Paris‏

‏France‏

‏Illegal‏

‏9.30‏

‏80.30‏

‏102.25‏

‏23.90‏

‏13.69‏

‏56‏

‏Miami‏

‏USA‏

‏Partial‏

‏9.27‏

‏42.54‏

‏16.24‏

‏7.16‏

‏4.12‏

‏57‏

‏San Francisco‏

‏USA‏

‏Legal‏

‏9.27‏

‏42.54‏

‏30.94‏

‏13.65‏

‏7.85‏

‏58‏

‏London‏

‏UK‏

‏Illegal‏

‏9.20‏

‏82.16‏

‏237.35‏

‏54.22‏

‏31.40‏

‏59‏

‏Colombo‏

‏Sri Lanka‏

‏Illegal‏

‏9.12‏

‏73.78‏

‏3.98‏

‏1.01‏

‏0.59‏

‏60‏

‏Riga‏

‏Latvia‏

‏Illegal‏

‏9.00‏

‏76.89‏

‏10.23‏

‏2.50‏

‏1.48‏

‏61‏

‏Bratislava‏

‏Slovakia‏

‏Illegal‏

‏8.92‏

‏81.54‏

‏7.24‏

‏1.67‏

‏1.00‏

‏62‏

‏Milan‏

‏Italy‏

‏Partial‏

‏8.85‏

‏75.68‏

‏46.06‏

‏11.42‏

‏6.88‏

‏63‏

‏Varna‏

‏Bulgaria‏

‏Illegal‏

‏8.83‏

‏82.65‏

‏4.84‏

‏1.10‏

‏0.66‏

‏64‏

‏Marseille‏

‏France‏

‏Illegal‏

‏8.69‏

‏80.30‏

‏36.23‏

‏8.47‏

‏5.19‏

‏65‏

‏Glasgow‏

‏UK‏

‏Illegal‏

‏8.65‏

‏82.16‏

‏15.21‏

‏3.47‏

‏2.14‏

‏66‏

‏Toulouse‏

‏France‏

‏Illegal‏

‏8.62‏

‏80.30‏

‏18.67‏

‏4.36‏

‏2.70‏

‏67‏

‏Birmingham‏

‏UK‏

‏Illegal‏

‏8.58‏

‏82.16‏

‏27.73‏

‏6.34‏

‏3.93‏

‏68‏

‏Kuala Lumpur‏

‏Malaysia‏

‏Illegal‏

‏8.54‏

‏55.36‏

‏6.61‏

‏2.24‏

‏1.40‏

‏69‏

‏Monterrey‏

‏Mexico‏

‏Partial‏

‏8.45‏

‏65.87‏

‏4.17‏

‏1.19‏

‏0.75‏

‏70‏

‏Edinburgh‏

‏UK‏

‏Illegal‏

‏8.41‏

‏82.16‏

‏12.22‏

‏2.79‏

‏1.77‏

‏71‏

‏Lisbon‏

‏Portugal‏

‏Partial‏

‏8.36‏

‏74.51‏

‏4.69‏

‏1.18‏

‏0.75‏

‏72‏

‏Strasbourg‏

‏France‏

‏Illegal‏

‏8.35‏

‏80.30‏

‏11.13‏

‏2.60‏

‏1.66‏

‏73‏

‏Warsaw‏

‏Poland‏

‏Partial‏

‏8.31‏

‏80.29‏

‏29.27‏

‏6.84‏

‏4.39‏

‏74‏

‏Lyon‏

‏France‏

‏Illegal‏

‏8.20‏

‏80.30‏

‏19.45‏

‏4.55‏

‏2.95‏

‏75‏

‏Los Angeles‏

‏USA‏

‏Legal‏

‏8.14‏

‏42.54‏

‏124.88‏

‏55.10‏

‏36.06‏

‏76‏

‏Liverpool‏

‏UK‏

‏Illegal‏

‏7.94‏

‏82.16‏

‏10.86‏

‏2.48‏

‏1.67‏

‏77‏

‏Amsterdam‏

‏Netherlands‏

‏Partial‏

‏7.89‏

‏73.40‏

‏20.94‏

‏5.35‏

‏3.61‏

‏78‏

‏Manchester‏

‏UK‏

‏Illegal‏

‏7.88‏

‏82.16‏

‏58.99‏

‏13.48‏

‏9.11‏

‏79‏

‏Rome‏

‏Italy‏

‏Partial‏

‏7.86‏

‏75.68‏

‏88.16‏

‏21.86‏

‏14.82‏

‏80‏

‏Toronto‏

‏Canada‏

‏Partial‏

‏7.82‏

‏69.80‏

‏124.15‏

‏33.38‏

‏22.75‏

‏81‏

‏Denver‏

‏USA‏

‏Legal‏

‏7.79‏

‏42.54‏

‏20.53‏

‏9.06‏

‏6.20‏

‏82‏

‏Naples‏

‏Italy‏

‏Partial‏

‏7.75‏

‏75.68‏

‏29.82‏

‏7.40‏

‏5.08‏

‏83‏

‏Leeds‏

‏UK‏

‏Illegal‏

‏7.67‏

‏82.16‏

‏16.93‏

‏3.87‏

‏2.69‏

‏84‏

‏Seattle‏

‏USA‏

‏Legal‏

‏7.58‏

‏42.54‏

‏20.59‏

‏9.08‏

‏6.39‏

‏85‏

‏Madrid‏

‏Spain‏

‏Partial‏

‏7.47‏

‏78.09‏

‏93.40‏

‏22.45‏

‏16.01‏

‏86‏

‏Calgary‏

‏Canada‏

‏Partial‏

‏7.30‏

‏69.80‏

‏52.23‏

‏14.05‏

‏10.25‏

‏87‏

‏Luxembourg City‏

‏Luxembourg‏

‏Partial‏

‏7.26‏

‏70.24‏

‏1.62‏

‏0.43‏

‏0.32‏

‏88‏

‏San Jose‏

‏Costa Rica‏

‏Partial‏

‏7.23‏

‏69.76‏

‏7.84‏

‏2.11‏

‏1.56‏

‏89‏

‏Buenos Aires‏

‏Argentina‏

‏Partial‏

‏7.13‏

‏69.84‏

‏25.32‏

‏6.81‏

‏5.09‏

‏90‏

‏Brussels‏

‏Belgium‏

‏Partial‏

‏7.09‏

‏75.92‏

‏15.50‏

‏3.83‏

‏2.88‏

‏91‏

‏Santo Domingo‏

‏Dominican Rep.‏

‏Illegal‏

‏6.93‏

‏58.87‏

‏0.67‏

‏0.21‏

‏0.16‏

‏92‏

‏Graz‏

‏Austria‏

‏Partial‏

‏6.84‏

‏74.00‏

‏4.81‏

‏1.22‏

‏0.95‏

‏93‏

‏Budapest‏

‏Hungary‏

‏Illegal‏

‏6.74‏

‏77.26‏

‏7.70‏

‏1.87‏

‏1.48‏

‏94‏

‏Sofia‏

‏Bulgaria‏

‏Illegal‏

‏6.66‏

‏82.65‏

‏12.83‏

‏2.91‏

‏2.33‏

‏95‏

‏Ottawa‏

‏Canada‏

‏Partial‏

‏6.62‏

‏69.80‏

‏35.43‏

‏9.53‏

‏7.67‏

‏96‏

‏Vancouver‏

‏Canada‏

‏Partial‏

‏6.40‏

‏69.80‏

‏23.44‏

‏6.30‏

‏5.25‏

‏97‏

‏Sao Paulo‏

‏Brazil‏

‏Partial‏

‏6.38‏

‏64.94‏

‏68.55‏

‏19.81‏

‏16.55‏

‏98‏

‏Rotterdam‏

‏Netherlands‏

‏Partial‏

‏6.33‏

‏73.40‏

‏12.75‏

‏3.26‏

‏2.74‏

‏99‏

‏Ljubljana‏

‏Slovenia‏

‏Partial‏

‏6.32‏

‏80.41‏

‏3.43‏

‏0.80‏

‏0.67‏

‏100‏

‏Barcelona‏

‏Spain‏

‏Partial‏

‏6.23‏

‏78.09‏

‏39.59‏

‏9.51‏

‏8.14‏

‏101‏

‏Montreal‏

‏Canada‏

‏Partial‏

‏6.15‏

‏69.80‏

‏60.52‏

‏16.27‏

‏14.10‏

‏102‏

‏Kiev‏

‏Ukraine‏

‏Partial‏

‏6.00‏

‏74.78‏

‏14.73‏

‏3.70‏

‏3.28‏

‏103‏

‏Abuja‏

‏Nigeria‏

‏Illegal‏

‏5.88‏

‏20.63‏

‏7.40‏

‏6.73‏

‏6.10‏

‏104‏

‏Lima‏

‏Peru‏

‏Partial‏

‏5.88‏

‏37.83‏

‏12.28‏

‏6.09‏

‏5.52‏

‏105‏

‏Mexico City‏

‏Mexico‏

‏Partial‏

‏5.87‏

‏65.87‏

‏22.58‏

‏6.43‏

‏5.84‏

‏106‏

‏Cape Town‏

‏South Africa‏

‏Illegal‏

‏5.82‏

‏48.80‏

‏2.47‏

‏0.95‏

‏0.87‏

‏107‏

‏Karachi‏

‏Pakistan‏

‏Illegal‏

‏5.32‏

‏60.70‏

‏135.48‏

‏41.89‏

‏41.95‏

‏108‏

‏Manila‏

‏Philippines‏

‏Illegal‏

‏5.24‏

‏74.27‏

‏2.32‏

‏0.59‏

‏0.60‏

‏109‏

‏Rio de Janeiro‏

‏Brazil‏

‏Partial‏

‏5.11‏

‏64.94‏

‏28.82‏

‏8.33‏

‏8.69‏

‏110‏

‏Mumbai‏

‏India‏

‏Partial‏

‏4.57‏

‏60.39‏

‏89.38‏

‏27.78‏

‏32.38‏

‏111‏

‏New Delhi‏

‏India‏

‏Partial‏

‏4.38‏

‏60.39‏

‏101.20‏

‏31.45‏

‏38.26‏

‏112‏

‏Antwerp‏

‏Belgium‏

‏Partial‏

‏4.29‏

‏75.92‏

‏4.10‏

‏1.01‏

‏1.26‏

‏113‏

‏Astana‏

‏Kazakhstan‏

‏Illegal‏

‏4.22‏

‏39.29‏

‏1.78‏

‏0.85‏

‏1.07‏

‏114‏

‏Montevideo‏

‏Uruguay‏

‏Legal‏

‏4.15‏

‏66.75‏

‏19.54‏

‏5.50‏

‏7.06‏

‏115‏

‏Johannesburg‏

‏South Africa‏

‏Illegal‏

‏4.01‏

‏48.80‏

‏3.76‏

‏1.45‏

‏1.92‏

‏116‏

‏Panama City‏

‏Panama‏

‏Illegal‏

‏3.85‏

‏56.52‏

‏0.81‏

‏0.27‏

‏0.37‏

‏117‏

‏Jakarta‏

‏Indonesia‏

‏Illegal‏

‏3.79‏

‏53.40‏

‏1.92‏

‏0.68‏

‏0.95‏

‏118‏

‏Asuncion‏

‏Paraguay‏

‏Partial‏

‏2.22‏

‏16.00‏

‏0.16‏

‏0.19‏

‏0.46‏

‏119‏

‏Bogota‏

‏Colombia‏

‏Partial‏

‏2.20‏

‏49.44‏

‏15.80‏

‏6.00‏

‏14.53‏

‏120‏

‏Quito‏

‏Ecuador‏

‏Partial‏

‏1.34‏

‏70.39‏

‏0.56‏

‏0.15‏

‏0.60‏

‏Methodology‏

‏Selection of the cities:‏

‏To select the cities for the study, Seedo first looked at the top and bottom cannabis consuming countries around the world. Then they analysed nations where marijuana is partially or completely legal, as well as illegal, and selected the final list of 120 cities in order to best offer a representative comparison of the global cannabis price. ‏

‏Data:‏

‏Price per gram, US$ ‏ ‏- Crowdsourced city-level surveys adjusted to World Drug Report 2017 of the United Nations Office on Drugs and Crime.‏

‏Taxes on Cigarettes, % of the most sold brand‏ ‏ – Taxes as a percentage of the retail price of the most sold brand (total tax). ‏ ‏Source‏ ‏: Appendix 2 of the WHO report on the global tobacco epidemic, 2015.‏

‏Annual possible tax collection is calculated in the following way: ‏

‏Total_Possible_Tax=Population_City*Prevalence*Avg_Consumption_year_gr*price*tax_level, where:‏

‏Population: latest available local population data sources.‏

‏Annual Prevalence (percentage of population, having used weed in the year). Source: World Drug Report 2017 of the United Nations Office on Drugs and Crime‏

‏Average Consumption of weed per year in grams (people who consumed weed at least once in the previous year). ‏

‏Estimation, with the assumption, that one use of weed on average means one joint. ‏

‏One joint is assumed to have 0.66 grams of weed as in the paper of Mariani, Brooks, Haney and Levin (2010). ‏

‏The distribution of use during the year is assumed to be the same as in Zhao and Harris (2004), where the yearly usage varies from once or twice a year to everyday.‏

‏Total Consumption in Tons‏

‏Consumption=Population*Prevalence*Consumption_year_gr‏

‏Population: latest available local population data sources.‏

‏Annual Prevalence (percentage of population, having used weed in the year). ‏ ‏Source‏ ‏: World Drug Report 2017 of the United Nations Office on Drugs and Crime‏

‏Average Consumption of weed per year in grams (people who consumed weed at least once in the previous year).‏

‏Estimation, with the assumption, that one use of weed on average means one joint. ‏

‏One joint is assumed to have 0.66 grams of weed as in the paper of Mariani, Brooks, Haney and Levin (2010). ‏

‏The distribution of use during the year is assumed to be the same as in Zhao and Harris (2004), where the yearly usage varies from once or twice a year to everyday. ‏

‏US tax level ‏ ‏- Average tax level in the states of US where weed is legal: Alaska, California, Colorado, Maine, Massachusetts, Nevada, Oregon and Washington. Includes retail sales taxes, state taxes, local taxes and excise taxes.‏

‏Legality‏

‏Legal, if possession and selling for recreational and medical use is legal.‏

‏Illegal, if possession and selling for recreational and medical use is illegal.‏

‏Partial, if ‏

‏Possession of small amounts is decriminalised (criminal penalties lessened, fines and regulated permits may still apply)‏

‏OR medicinal use legal‏

‏OR possession is legal, selling illegal‏

‏OR scientific use legal‏

‏OR usage allowed in restricted areas (e.g. homes or coffee shops)‏

‏OR local laws may apply to legality (e.g. illegal at federal level, legal at state level)‏

‏First quote: Based on New York City Council’s free lunch initiative which began in September 2017, with 1.1 million public school children, at a cost of $1.75 per child per day.‏

Why We March Globally Against Monsanto

It takes strength to usher in change and there's strength in numbers.
It takes strength to usher in change and there’s strength in numbers.

For those who are not aware of Monsanto or its global influence, I would like to provide you with some background information before explaining just why it is important to stand against the corporation and its actions.

 Monsanto is an international agricultural corporation which is based out of the United States. It originated in 1901 and has functioned mainly as a pesticide corporation but as of recently it has been implementing genetically engineered seeds. These seeds, which are being sold and grow in many parts of the world, do not have the ability to reproduce, thereby forcing farmers to purchase a new set of seeds from the company each season. In many situations, the farmers have no choice but to continue paying into the corporation because no other seeds are available in their area. Monsanto is also the leader producer (and creator) of the herbicide “Glyphosate” (a herbicide which is used specifically to kill weeds around the GM crops but leave the crops un-harmed. This is made possible through the genetic tampering of the seeds which makes them resistant to the herbicide).

Monsanto has been adamantly rejecting many accusations that have been coming their way in more recent years. In fact, they go out of their way to address the international conversation that has been taking place about their “terminator” seeds and their inability to reproduce (provide seeds that can then be planted the following season). They claim in a statement on their website that “Monsanto has never commercialized a biotech trait that resulted in sterile – or “terminator” – seeds” (Monsanto Website). The website is littered with fabricated stories, pictures of smiling farmers and claims that Monsanto has their best interests at heart. The truth is many farmers are struggling to make the expensive purchases of Monsanto seeds and herbicide. Debt is rising in rural areas around the world (India taking one of the hardest hits, with thousands of farmer suicides being said to be associated with debt owed to Monsanto and their inability to support themselves) and a countless number of individuals are suffering because of the negative side effects. Monsanto has a huge stake in the worlds production of seeds and is already working on spreading their patents to broccoli and eggplant despite international disagreement.

This is why we march. The global March Against Monsanto is a worldwide call of action aimed at informing the public of the long term health, environmental, and financial effects of genetically modified foods. Last years globalized day of action took place with over 2 million people took to the streets to express their opinions and attempt to reclaim the food systems. We march for seed freedom (because seeds are a source of life, and corporations should not have the ability to patent life), for the labeling of GMO foods, to promote organic and sustainable alternatives, to demand the accountability of those responsible for corruption, and to further the scientific research around GMOs. *name withheld on request