Tag Archives: Ontario

Which Canadian Province Has Best Chance For UFO & UAP Sighting?

Our friends at BonusFinder Canada decided to find out which Canadian province has the highest chance of spotting a UFO. To do this, experts analyzed data from the National UFO Reporting Centre State Report Index to determine the volume and duration of sightings across the country. Data gathered for this study dates back to 1998.

BonusFinder Canada also spoke to Nick Popewho investigated UFOs for the British government, for his thoughts on the data and recent sightings. 

Top Canadian Provinces for October UFO sightings 

RankProvinceCount of UFO sightings in Octobers since 1998
1Ontario199
2Saskatchewan150
3British Columbia93
4Alberta57
5Quebec32
6Manitoba21
7New Brunswick20
8Nova Scotia19
9Prince Edward Island3
=10Newfoundland and Labrador2
=10North West Territories2
=10Yukon2
11Nunavut1

Ontario was the province with the best chance of spotting a UFO this past Halloween month, with 199 recorded sightings across October since 1998. In fact, the month of October has seen 89% more sightings than the month of October in neighboring Manitoba since 1998. A recent sighting on October 29, 2022, right before Halloween, featured a circular UFO documented in Orangeville. The report claims an abundance of visual evidence, including hundreds of standard photos and high-definition HDR images captured with astro cams.

In second position is Saskatchewan, with 150 recorded sightings in October since 1998. The month of October has seen 87% more sightings than the month of October in Nova Scotia since 1998. On October 11, 2016, three sightings were documented. The first, lasting  five minutes in La Ronge, featured seven moving lights across the northern sky. The second and third occurred in Saskatoon, both cylindrical in shape and lasting two minutes each.

Securing a spot in the top three, British Columbia boasts 93 UFO sightings in the month of October. B.C also has 39% more sightings in October than fourth place and neighboring province, Alberta. The most recent sighting took place in Surrey on October 30, 2021, featuring a circular object observed for a duration of 5 minutes.

In fourth place is Alberta with 57 sightings across the month of October, followed by Quebec with 32 sightings across the month of October. 

Canadian provinces with the most UFO sightings 

According to BonusFinder Canada, Ontario has had the highest number of total alleged UFO sightings in Canada at 2,416, each of which lasting an average of 14.42 minutes. Most of these sightings consisted of seeing bright or flashing lights in the sky. In one particular sighting, a Scarborough resident spotted two objects flying together at high speed on the 6th July last year. Other sightings included an orange-red circle flying North to South over Toronto in 2021.

Following on is British Columbia (1,163 UFO sightings), Alberta (665 UFO sightings), Quebec (305 UFO sightings) and Manitoba (241 UFO sightings).

Former government investigator shares his thoughts

Nick Pope, who investigated UFOs for the British Government, said  “This comprehensive new information paints a fascinating picture of the modern UFO mystery, at a time when the subject is making the news all around the world. The new data will be of interest to anyone intrigued about UFOs, and might even assist NASA, the Department of Defense, and the U.S. intelligence community, who are all working on UFO studies where identifying possible hotspots could be useful.

“These league tables of states and nations are really interesting, and while one has to control for population size – more people, more potential witnesses if there’s something strange in the sky – the information is exactly the sort of data that can help identify UFO hotspots. This, in turn, could give us some useful clues about the true nature of the phenomenon. A scientific, data-led approach to the UFO mystery is essential if we’re to get to the bottom of what’s going on in our airspace.

“One of the big surprises was the average duration of sightings. People have this idea that UFOs are here one minute, gone the next, with sightings lasting only a few seconds, and with witnesses getting only a brief glimpse. 

The new data shows that people are seeing UFOs for much longer periods of time than is commonly realized, which is why we’re getting more and more photos and videos, as people have time to take out their smartphones. 

Methodology

  1. Experts at BonusFinder Canada analyzed data from the National UFO Reporting Centre State Report Index, in regards to UFO sightings in Canada.
  2. The location of all 5,447 sightings, the duration of the sightings and descriptions of each were matched to each region they were seen in, to find an average number of sightings per region. Each province in Canada was ranked according to the number of UFO sightings.
  3. The data is correct as of 15/02/23.
  4. The full dataset can be found here

Jeff’s Gran Torino Sport and A Classic Car ‘Rescue’ Podcast

If you’ve spent time in rural Southern Ontario you know that there are many unique cultural identifiers. You may have noticed that things move a little slower…except for certain classic cars that continue to amaze with horsepower and style. I sure have, and it is a joy to cross paths with all of the “sweet rides” of Norfolk County nestled along the Lake Erie North Shore.

Jeffs Gran Torino Sport

Jeff’s Gran Torino Sport is, like many classic cars, an icon. 

This model of car starred in a funky 1970s show (and later a Stiller-Wilson movie) that needed a car with character. A car that would be believable chasing after a pimped out Lincoln or Caddy. And though formulaic in this simple premise of cops + cool car= fun, Starsky and Hutch just wouldn’t be the same were it not for the Gran Torino.

It is safe to say that the classic Gran Torino succeeded in showing that muscle, style and comfort catches the viewer’s eye, as well as the bad guys. Look for Jeff’s wheels in and around Port Rowan, Ontario. For the Silo, Jarrod Barker.

Supplemental- Port Dover’s Scott Misner talks about rescuing an El Camino and more-


Ontario Storm Chasers Warn Public Through Photography

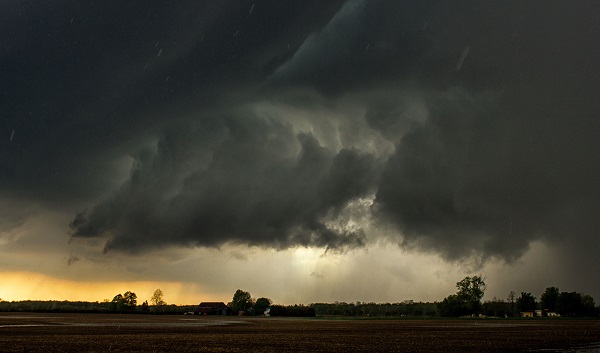
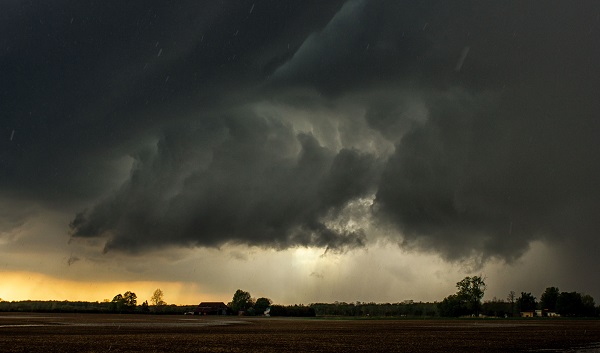
Photo shot in London, Ontario. Shot during a tornado warning for Middlesex county. photo: S. Sills

Did you know on average 12 tornadoes strike Ontario each year? That’s why David Chapman (@northof44pics) and I (@wxspencersills) commit our springs and summers to capturing severe thunderstorms on video and through photography.

My name is Spencer Sills and I am a chaser located in South Western Ontario. I have been chasing storms for about 20 years. I became obsessed with the weather and more specifically severe weather in 1996. On April 20, 1996 a tornado had hit Williamsford, Ontario. This was my first experience with a tornado and it has become a permanent fixture in my mind, partially due to the fact there was still snow on the ground the day it had hit.

Then in the summer of 2011, there were fourteen confirmed tornadoes including  the Goderich F3 tornado as well as three tornadoes during the August 24th severe weather outbreak during the late afternoon and evening. I was unable to be out during either of these days but what I was able to do was keep the public informed of the current severe weather as well as help give warning for the tornadoes.

Photo shot in South West London, Ontario. A waterspout advisory was in effect for Lake Huron and Erie, while on the way to Lake Huron I came across this Cold Core Funnel off of a early morning thunder shower. image: S. Sills

A Summer from years ago was…interesting.  I witnessed more than  my fair share of active weather. I encountered five funnel clouds, several gust fronts or more commonly known as squall lines here in Ontario, and hail from pea size to golf ball sized  in Seaforth. I’ve also encountered strong wind storms which included a storm in Birr, Ontario which uprooted several large trees.

My personal worst storm occurred on June 7, 2011 in Elora, Ontario. A large and intense cell came through late at night bringing with it 80-90 km/h winds, heavy downpours, frequent lightning and quarter-coin size hail. I was fortunate to not be injured during this storm because I was in a tent at the time and had no warning beforehand other than a loud lightning strike before it hit. There was a severe thunder storm warning with the cell but our campground chose not to relay that information to campers and I only found out about the warning once I put on my portable radio after the storm came.  That same storm went on to produce a tornado warning over Hamilton but did not spawn a tornado that night. It did however cause extensive wind damage in the city.

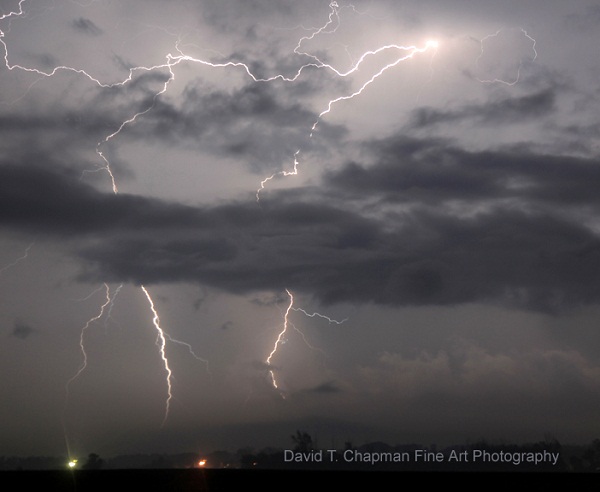
Cloud to Ground Lightning: photographed by D. Chapman

My chase partner is David Chapman.  David and I both grew up within minutes of each other but never met until recently due to the power of twitter.  From twitter I was able to glean that we both have similar interests and goals which will allow us to mesh well together. [ Check the hashtage #WX on twitter for tweets related to extreme weather CP ]

Hello Silo readers. My name is David T. Chapman and I am a professional photographer with a passion for storm photography. I developed an interest in weather when lightning hit my house in Guelph, Ontario, years ago. The thunder was terrifying and the rain was so heavy that even though I was only three years old at the time, I have clear, vivid memories of the storm. My interest in weather was rekindled in the late 1990’s when I spotted my first multi-vortex tornadoes with my dad and brother. Since then, I have followed the weather every day to determine the best time for photography in all kinds of conditions.

Waaaay back in 2011 , the Ontario storm season was an active one. It allowed me to get a personal record number of lightning photographs in one season with 105, not including sheet lightning shots. My first storm was in April, when a very weak storm pushed into the Niagara region. Something that you don’t see very often is a thunderstorm with snow on the ground, but that night I had both. But the storm chasing season  really didn’t start seriously until the end of May when an evening storm rolled through Southwestern Ontario right into my area. The squall line formed directly to our west and there was no way around it. We had to puncture the core of the storm to try to find a dry slot. We were hit hard with heavy rains, strong winds and continuous lightning.

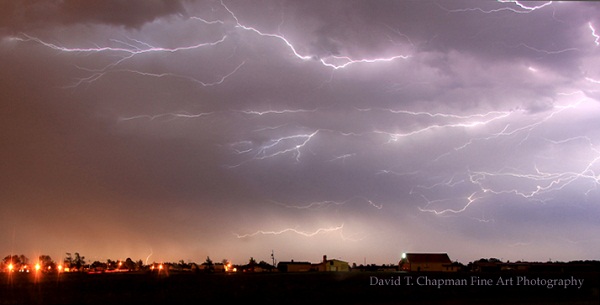
Anvil Crawler: photographed  Southeast of Hamilton, Ontario image: D. Chapman

One of the hardest things to get is a lightning photograph when there is a downpour because it blurs the image. The first line of storms went through when we crossed an open field area and then we were hit by a strong second line of storms. Extremely strong straight lines came at us with winds easily in excess of 90 km/hr. We got into position, but unfortunately, with the rain still pounding our photography team, it made it impossible to get crisp, clear lightning shots. It wasn’t until after the storm had passed that the back end of it lit up and we were able to capture some very beautiful lightning.

The summer carried on with sporadic thunderstorm activity consisting of small thunderstorm cells with intense lightning and hail. Generally, with smaller storms, you only get 4 to 5 lightning shots. I’ve come back after chasing a storm perfectly with only 1 or 2 lightning shots to show for it. It wasn’t until the outbreak of thunderstorms that our team had a very successful night of shooting. On that night, Faith Beni and I ended up in St. Mary’s, Ontario. There were tornado watches all across Ontario, the most I had ever seen. The thunderstorm cell that we were interested in was towards Nairn, Ontario. We left the Niagara region at 5:30 p.m. and got to St. Mary’s around 7:45 p.m.

Without daylight left, the thoughts of getting a tornado quickly changed to an opportunity for lightning photographs instead. One of the most dangerous things to do is to chase a tornadic thunderstorm in the dark, which is why our team has a policy to not chase these types of storms at night. We tend to focus on weaker storm cells that don’t have the tornadic potential but still have lots of lightning. The night of the 24th, though, was different. It seemed that any storm cell had the potential to drop a tornado. We pulled back to St. Mary’s and then we started getting reports of rotation heading to St. Mary’s.

In just under 2 minutes, I saw 4 reports of rotation for St. Mary’s. We started to get pounded with large hail and the the hydro went out. We left St. Mary’s and pushed north towards what looked to be some late evening twilight. We got to the back of the storm and were able to photograph the lightning that was in it. We got some of the best anvil-crawlers that I have ever seen. Anvil-crawlers are a particular type of lightning that can either go for short distances or for distances over 100 km.

This year for the first time, Spencer Sills and I will be working together to get some very powerful images. Our biggest goal is to get a photograph of a tornado. Last year, I was close 3 times. The first was in Grimsby, where an EF0 hit and damaged a small gazebo. Eric Chapman and I were right on the storm but unfortunately we could not see the tornado because of heavy precipitation. The second was the Nairn tornado and the third was a rotating wall-cloud that I photographed towards Bryson, Quebec.

Spencer and I often hear about how tornadoes don’t happen here. We want to let the public know that they can and do occur here, in South Western Ontario so that watches and warnings should always be taken seriously. The Goderich tornado in 2011, in which one person died, is a grim reminder of just how intense tornadoes can be and that they do, in fact, affect Ontario residents.

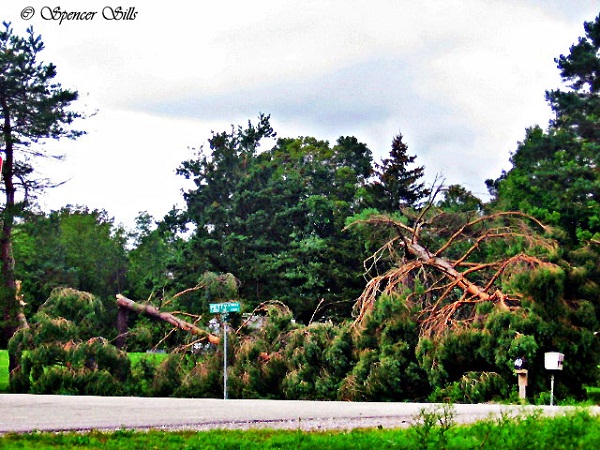
Photo shot in Nairn, Ontario. Tornado damage in Shady Pines Campground in Nairn. A tornado touched down the previous night and bent these pine trees in half, the tornado also caused extensive tree damage in the area as well as damaged a house and destroyed a metal silo. image: S. Sills

David and I both have experience in chasing storms, and take safety very seriously. We will be travelling with a First Aid kit just as well as weather alert radios and radar to help us along our way, we hope that we don’t ever need the kit but it’s always a great idea especially if others are in need of help, we could very well be the first people on the scene of a possible tragedy so we must be prepared. We will be posting pictures and videos throughout the season but do not recommend that anyone attempt to recreate either of them and place themselves in danger.

I will be working with David Chapman in hopes to help warn others as well as capture these storms through video and photography to share with others who may not get to experience them. We are ready to combine our passion for storms to get the best results possible and share those results with others.

MPP Brady Intros Farmland Protection Legislation

QUEEN’S PARK – Haldimand-Norfolk MPP Bobbi Ann Brady has introduced legislation that, if passed, will protect Ontario’s farmland.

“Land use planning affects our daily lives and Ontario’s farmland and arable land is an essential resource for the sustainability and security of our food systems, environment and local economies,” Brady said. “Farmland and arable land is productive, valuable and essential but most importantly it is finite and non-renewable, which is vital to consider in the face of increasing pressure to develop housing in the province.”

With Ontario having 52 per cent of the country’s prime arable land, and much of that being adjacent to cities, Brady said protecting these lands should be paramount. Further, according to census data, Ontario is losing 319 acres of farmland each day. Brady feels this is unsustainable. Constituents in Haldimand-Norfolk have also raised this same concern with the MPP since well before her election.

“As the government continues with its target to create 1.5 million new homes in Ontario, it is vital to put in place policies that will protect our farmers and their land, as well as the province’s food security, both now and in the future,” she said.

The bill requires the Minister of Agriculture, Food and Rural Affairs to develop a strategic action plan that aims to protect Ontario’s farmland and arable land from development, aggregate mining and the effects of fluctuating commodity prices and the availability of vacant land. It also stipulates a stakeholder-led Farmland and Arable Land Advisory Committee be set up to advise the Minister of Agriculture, Food and Rural Affairs. For the Silo, Jeff Helsdon.

The bill will be back before the Legislature for second reading debate on March 8.

For more information, contact MPP Bobbi Ann Brady directly at 519-428-0446 or 905-765-8413 or babrady-co@ola.org Please mention The Silo when contacting.

Living With Canada’s Urban and Rural Coyotes

Coyotes, like other wild animals, sometimes come into conflict with humans. Since migrating to Ontario and the eastern provinces from western Canada more than 100 years ago, coyotes have adapted well to urban environments and can now be found in both rural and urban settings. Coyotes can be found across Ontario but are most abundant in southern and eastern agricultural Ontario and urban areas.

Changes in land use, agricultural practices, weather, supplemental feeding and natural food shortages may contribute to more coyote sightings in your community.

Homeowners can take steps to make sure coyotes aren’t attracted to their property and to keep their pets safe. To reduce the potential for coyote encounters, the Ministry of Natural Resources has the following tips for the public.

Do not approach or feed coyotes

Coyote sightings reported in Kokomo parks, cemeteries | Local news |  kokomotribune.comCoyotes are usually wary of humans and avoid people whenever possible. However, they are wild animals and should not be approached.

                • People should NOT feed coyotes — either intentionally or unintentionally. It makes them less fearful of humans and makes them accustomed to food provided by humans.
                • Aggressive behavior towards people is unusual for coyotes, but people should always exercise caution around wildlife. Secure garbage, compost and other attractants 
                • Do not provide food to coyotes and other wildlife. Properly store and maintain garbage containers to help prevent coyotes from becoming a problem.
                • In the fall, pick ripe fruit from fruit trees, remove fallen fruit from the ground and keep bird feeders from overflowing as coyotes eat fruit, nuts and seeds.
                • In the summer, protect vegetable gardens with heavy-duty garden fences or place vegetable plants in a greenhouse. Check with your local nursery to see what deterrent products are available.
                • Place trash bins inside an enclosed structure to discourage the presence of small rodents, which are an important food source for coyotes.
                • Put garbage at curb-side the morning of the scheduled pickup, rather than the night before.
                • Use enclosed composting bins rather than exposed piles. Coyotes are attracted to dog and cat waste as well as products containing meat, milk and eggs.
                • Consider eliminating artificial water sources such as koi ponds.
                • Keep pet food indoors.  Use deterrents and fences to keep coyotes away from your home and gardens
                • Use motion-sensitive lighting and/or motion-activated sprinkler systems to make your property less attractive to coyotes and other nocturnal wildlife.
                • Fence your property or yard.  It is recommended the fence be at least six-feet tall with the bottom extending at least six inches below the ground and/or a foot outward, so coyotes cannot dig under the fence.  A roller system can be attached to the top of the fence, preventing animals from gaining the foothold they need to pull themselves up and over the top of a fence.
                • Electric fencing can also help deter coyotes from properties or gardens in some circumstances. Clear away bushes and dense weeds near your home where coyotes may find cover and small animals to feed upon.
            • Install proper fencing.
            • As coyotes are primarily nocturnal, pets should be kept inside at night.
            • Keep all pets on leashes or confined to a yard.
            • Keep cats indoors and do not allow pets to roam from home.
        • Spay or neuter your dogs. Coyotes are attracted to, and can mate with, domestic dogs that have not been spayed or neutered.

If you encounter a coyote:

        • Do not turn your back on or run. Back away while remaining calm.
        • Use whistles and personal alarm devices to frighten an approaching or threatening animal.
        • If a coyote poses an immediate threat or danger to public safety, call 911.
        • Never attempt to tame a coyote. Reduce risk of predation on livestock
        • Barns or sheds can provide effective protection from the threat of coyotes preying on livestock.
        • Guard animals, such as donkeys, llamas and dogs, can be a cost-effective way to protect livestock from coyotes. Guard animals will develop a bond with livestock if they are slowly integrated and will aggressively repel predators.
    • For more information on preventing livestock predation, please visit the Ministry of Agriculture and Food website.

Managing problem wildlife

  • Landowners are responsible for managing problem wildlife, including coyotes, on their own property.
  • The Ministry of Natural Resources helps landowners and municipalities deal with problem wildlife by providing fact sheets, appropriate agency referrals, and information on steps they can take to address problems with wildlife.

Indy MPP Brady Frustrated With Both Parties Re Bill 28

Brady stands up for educational workers and students

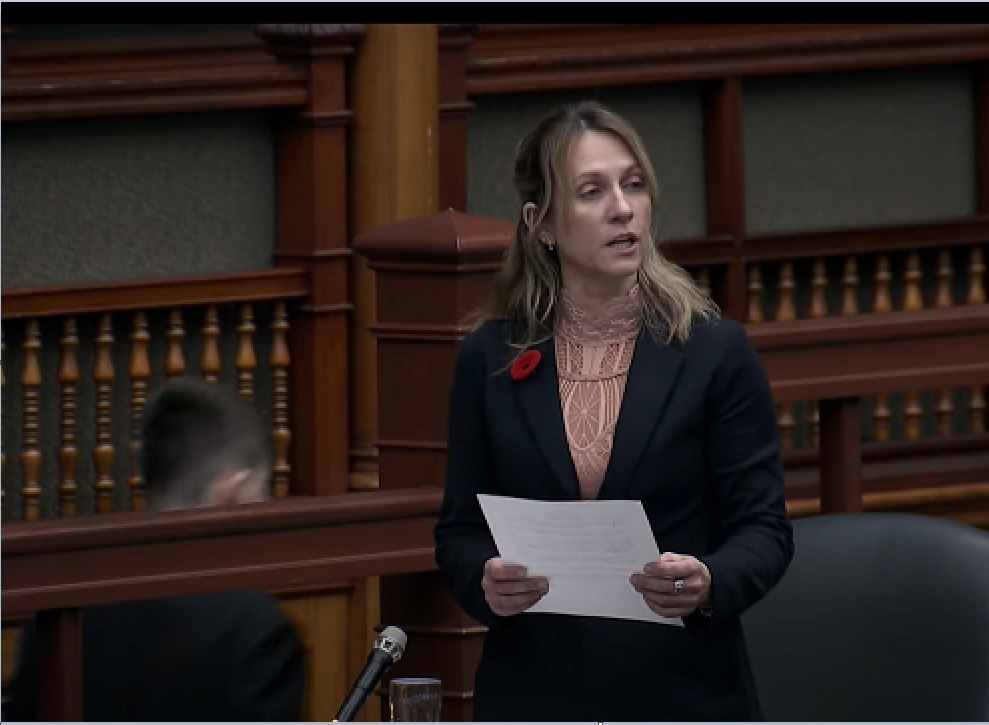
QUEEN’S PARK –   Haldimand-Norfolk MPP Bobbi Ann Brady over the past two days, stood in the House and implored the government and CUPE to tone down the rhetoric, work together through negotiations, and stop using education workers and students as political pawns.

“To this government, to CUPE, stop using some of the province’s lowest paid education workers and stop using our kids as political pawns,” MPP Brady stated in the Legislature.

The government declared Bill 28 to operate the notwithstanding clause during the dispute involving school board employees represented by the Canadian Union of Public Employees.  The notwithstanding clause blocks the ability of the union employees to walk off the job and keep students from class.

As an Independent member of the Legislature, MPP Brady has the unique position of viewing legislation genuinely and providing honest feedback about how it will affect her constituents as well the rest of the province.   

Through her question and statement on Tuesday and Wednesday respectively, Brady expressed her frustration with both sides of the House. She then questioned which side actually cares about education workers and students. 

“I’m a bit cranky with what is happening here.  Who here actually cares about our education workers? Who cares about our students?”

Brady is fearful that if the lives of students are impacted, education workers will be blamed by Ontario parents who are frustrated with kids being in and out of school the past few years. 

https://bobbiannbrady.com/

In a line of questioning yesterday, MPP Brady encouraged the government to do treat educational workers fairly and do what is right for Ontario students.

For more information, contact MPP Bobbi Ann Brady at babrady-co@ola.org or 519-428-0446 Please mention The Silo when contacting.

Self Driving Vehicles And The Trolley Problem

With the imminent arrival of Autonomous Vehicles, many people have started worrying about the safety of this new technology, especially when an issue arises to do with choice.

In this piece, we’ll delve into the issue of the “Trolley Problem” and how AVs will deal with this and whether all manufacturers have the same stance.

Infographic courtesy of our friends at selectcarleasing.co.uk

Supplemental- Silo archives, Fall 2015: Ontario became the first province to test AV’s on Canada’s roads.

Toronto Martinis Are All About The Garnish

TORONTO, Ont. — In a quiet, backlit corner, cozied up to a bar or amid the flashing lights on the dance floor, the distinctive silhouette is striking.

Ahhhh martinis.

1969's 007- George Lazenby
1969’s 007- George Lazenby

Slender where it needs to be, but flared in the right spots, the martini has an iconic image that exemplifies class and sophistication, which is perhaps why it is the drink of choice for the fictional British spy James Bond. And as the tuxedo is central to the image of 007, how you dress your martini is key to its image — a skewer of olives resting along the angle of the chilled cocktail glass, submerged in the clear mixture of vermouth and gin (or vodka, as your personal taste may dictate).

“The martini is drink for the refined, elegant individual, not unlike the fictional British spy James Bond,” says Desiree Sardo, head of communications and public relations at Sardo Foods. “Vodka or gin.

Shaken or stirred. The beauty of the drink is its versatility, and that applies to the olives as well. The question that must be asked is, what’s in your martini?”

With the future of the next Bond movie still up in the air (will we see a new actor taking on the 007 role?) , Desiree suggests shaking up a few martinis and settling in for a contemplative James Bond marathon.

[Here’s Radiohead’s superior and unused theme song for the opening of Spectre]

For a classic martini like Bond would enjoy, pour ½ oz. vermouth and 3 oz. of gin over ice in a mixing glass. Stir well, then strain into a chilled cocktail glass. Garnish with several green olives (martini enthusiasts insist on a minimum of three olives) and enjoy.

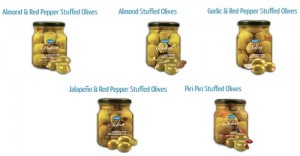
Up the Martini ante with Sardo Gourmet stuffed Olives.

Most people like a traditional pimento stuffed olive in their martini, but experimenting with garlic and red pepper stuffed olives, or jalapeno and red pepper, will add a little zest to your drink.

To complete the martini experience — and give you a healthy snack while watching a Bond film — pair it with an incredibly easy-to-make but classy antipasto skewer.

Start with a cured, salted meat — prosciutto is a good choice — as the base, then add on an artichoke heart, cherry tomato, a leaf of basil or mint and a bocconcini. The presentation is beautiful and the skewer makes it easy to eat while still holding your martini glass.

“Everybody has their favourite Bond actor and their favourite Bond film, but to get a true taste of the character I recommend a marathon that includes a good variety of Bond movies with a different Bond in each,” says Desiree. “Your James Bond martini and a viewing of Spectre with Daniel Craig would go well with GoldFinger starring Sean Connery, For Your Eyes Only with Roger Moore and Die Another Day with Pierce Brosnan. A martini or two with your marathon is a great way to spend a James Bond day.”

For more information, email contentproducer@thesilo.ca or visit sardofoods.ca.  Join the conversation on Instagram @sardofoods and Like on Facebook.

Toronto Martini CN Tower BackgroundAbout Sardo Foods:

Family owned and operated in Canada, Sardo Foods is world renowned for bringing all the unique flavours of the Mediterranean to your family’s table. Specializing in olives, antipasti, pesto, spreads, bruschetta and more, Sardo Foods aims to make gourmet cooking and entertaining easy.

Based in Bolton, Ont., Sardo Foods employs 150 people and boasts more than 200 product lines.

An Evolution Of Canadian Shopping Consumers Distributing Style

As a technology writer for the Silo, I am always focusing and thinking about the evolution of technology. I write about how computers and video games have changed over the years, but of course, many other things change around us and the one I have been thinking about a lot lately is shopping. ( Consumers Distributing may be back,  the relaunch namesake follows us on Twitter  )

CD had some serious PPMP’s (Portable Personal Music Players)- notice how the colour and graphic schemes are totally late 80’s/early 90’s?

When I was a kid, I remember getting the Consumers Distributing catalog and taking it into my room to read thoroughly. Of course, I tended to go directly to the toys section and more specifically I looked at the video games and computers. I dreamed about the day I would own some of these items, and I patiently saved my pennies from my job as a paper route carrier. Life can be tough when you are 12.

Started in 1957, Consumers Distributing tried to save costs for consumers by creating a warehouse like environment that allowed them to operate in smaller locations.

Customers would typically shop through a catalog (which they could take home or use in-store) and fill out a request form. This form was taken to the counter where a customer service representative would go fetch your item(s) and ring up the sale.

At its peak the chain would grow to 243 outlets in Canada and 217 in the United States. By 1996, however, the customers were fading as frustration grew with items being out of stock (or, more accurately, the customer perception was that items were always out of stock). In 2006, the company appeared to emerge from bankruptcy protection but little has been done to revive the stores to the way they once were.

Nothing says vintage or captures the ‘aura’ of shopping in a Consumers Distributing store quite like a polaroid.

Even though the end of the chain could be considered a failure, the evolution of the concept continues to this day. Stores like Home Depot and Costco operate in a warehouse-like environment, there are just no catalogs.

Canadian retail giant Hudson’s Bay Company also thought it was a pretty good idea since they purchased and ran a competitive chain of stores called “Shop-Rite” that were open from 1972 to 1982.

.At its peak, Shop-Rite had 65 stores in Ontario before conceding defeat to Consumers. It wasn’t the competition that was really the problem, it was the concept.

With the recent closing of the retail operations of Blockbuster and Rogers Video, we are seeing another step in the evolutionary process. Decades from now, people will probably think it was quite strange to obtain our movies from a retail store because everything will be digitally beamed into our homes and the physical disks and tapes we use now will be completely gone.

My friend Dave Thielking is a lot like me and he remembers the days when we were kids flipping through those catalogs.

So when he obtained some old catalogs I knew we could work together to put them online and share with our other friends who remember the old days of shopping and the great toys and items we wanted to save our pennies for. The result is a new website called the Consumers Distributing Archive and you can find it at http://www.cdarchive.ca.

We are never going to be able to stop evolution – of any kind – but it doesn’t mean we have to like it, or that we can’t go back to the way things were even just for an afternoon or two. For the Silo, Syd Bolton.

River Water Levels Are Favorite Discussion Among Ontario Paddlers

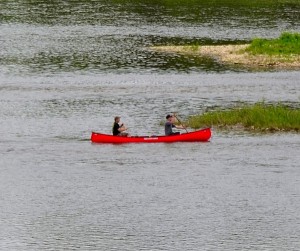
SUP- Stand up paddling is a popular sport along the Grand River system. image: grandriverrafting.ca

Is the water level in the river going to be okay for canoeing or kayaking on any given weekend?

This is a common question that people call the GRCA to ask. It is also an important question. Usually what  they mean is ” will there  be enough water?”, but occasionally, there is actually way too much water for most people to canoe or paddle safely.

Fly fishermen too need to check river levels so they are safe and don’t get swept off their feet by a strong current.

An angler will likely move to a different area rather than take a chance. As an organization, the GRCA does not make recommendations as to appropriate water flows for recreational activities along the Grand River and its tributaries because there are many variables to consider. Some people have the expertise and training to enjoy high flows that could be fatal to inexperienced and ill equipped paddlers.

Very low flows make for slow going as there may not be enough water for the canoe to float and it may need to be pulled to deeper water at certain times. A skilled paddler will be able to read the water to find the deepest water and will have fewer problems. Some people have a bad day if they have to step out of their boat even once, while others are more tolerant of low flows. That is why there is no definitive answer to this question.

Appropriate water levels are a favorite discussion among paddlers. Those who paddle regularly have their own personal chart, whether it is in their head or on a spreadsheet.

Checking flow information

Many avid river recreation enthusiasts in Southern Ontario bookmark the River Data section of the GRCA’s website and check it when trip planning. This is one of the most visited sections on the GRCA’s website and provides hourly updates on river flows from 39 gauges on the Grand and eight tributaries. Some gauge information is also posted on an Environment Canada website that includes rivers in other parts of Canada, but the GRCA site has data for more gauges from this
watershed.

The main chart here is called the Flow Summary.

Recreational users should pay attention to the column headed “flow.” This one is measured in cubic metres per second or cms. If the rate is 10 cms, that means that 10,000 litres of water is moving past the flow gauge each second at this part of the river. The cms gets bigger as the river moves towards Lake Erie. There are huge changes in river flow due to seasons, weather, ice jams and dam operation.

Compare this to the “summer lowflow” which is the average flow during the dry summer months and you will see in relative terms how much water is flowing down the river. Following this Flow Summary is a list of sections of the rivers and tributaries with graphs. For example, one of the most popular sections of the river for a day trip, Cambridge to Paris, a paddler would check the Galt gauge on the “Middle Grand River“section. The graph will tell you if the level is going up, down, or holding steady. Occasionally a flow gauge does not operate and the information can be inaccurate, so the information is provisional. There is also a River Flow Information line that is updated regularly and can be reached at 519-621-2763, ext. 2511.

Photo by Judi Thompson

Outfitter information

There are several local outfitters in the area and they have cut off levels, when they stop canoe rentals. Canoeing the Grand in Kitchener has a safety section on their website with a five step rating chart for paddling. This scale  goes from “Excellent” to “No Go” with five levels, depending on the paddler’s age, skill, expertise and river conditions.

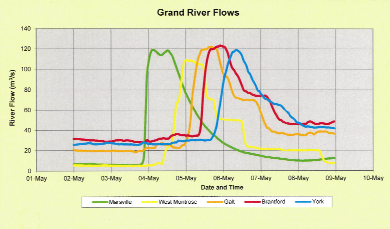
Grand River flow rates chart

When river flows skyrocket

As the graph above shows, the Grand River may not give much warning of a sudden increase in river flows, which is why the GRCA must sometimes issue high water safety warnings to the public. This is the flow information from the week of May 2 to 9 from a few years ago. Note that it shows heavy rain on Thursday night May 3 in the northern part of the watershed meant flows ballooned from 8 cms to 120 cms within a couple of hours, as the data from Marsville shows. The GRCA issued a warning after the storm. The rainwater gushed down the river and by the afternoon of Friday May 4, flows were dropping at Marsville but skyrocketing at West Montrose. By Saturday May 5, the river flows in Brantford were extreme and then they peaked at York on the southern Grand on Sunday.
A final important note, Dams can make the impact of a rainstorm less severe but they don’t eliminate flooding or high flows.

For the Silo ,Janet Baine, GRCA Communications Specialist

Connection Between Music And Math

I remember the first time I heard the statement “Did you know that listening to classical music enhances your mathematical abilities?”

I was both intrigued and excited, intrigued because I did not understand how music and math, two seemingly unrelated subject could possibly affect each other. I was also excited because I began to view classical music as some kind of magical potion that would transform my math skills from decent to extraordinary. When I had the opportunity to write this web paper for The Silo, I immediately jumped into the topic of music and math. The questions that I wish to answer throughout this paper are; does listening to music really help you do better in math? If so, which part of the brain is controlling the correlation between math and music? In addition, how does music stimulate the brain in a way that enhances mathematical abilities?

It turns out that there is much evidence that supports the positive effects of music on one’s ability to do math.

Most research shows that when children are trained in music at a young age, they tend to improve in their math skills. The surprising thing in this research is not that music as a whole is enhancing math skills. It is certain aspects of music that are affecting mathematics ability in a big way.

Studies done mostly in children of young age show that their academic performance increases after a certain period of music education and training. One particular study published in the journal ‘Nature’ showed that when groups of first graders were given music instruction that emphasized sequential skill development and musical games involving rhythm and pitch, after six months, the students scored significantly better in math than students in groups that received traditional music instruction. (1)

The result of this study posed another important question. How does this type of music that emphasized sequential skills, rhythm and pitch manage to improve children’s ability to do math? It turned out that there are two distinguished types of reasoning, spatial temporal (ST) reasoning and Language analytical (LA) reasoning. LA reasoning would be involved in solving equations and obtaining a quantitative result. ST reasoning would be is utilized in activities like chess when one needs to think ahead several moves.

The effect of music on math sometimes termed the Mozart effect.

The Mozart effect gain its name after the discovery that listening to Mozart’s compositions, which is very sequential, produces a short-termed enhancement of spatial-temporal reasoning. Some key reasoning features used in spatial temporal reasoning are:

1. The transformation and relating of mental images in space and time

2. Symmetries of the inherent cortical firing patterns used to compare physical and mental images and

3. Natural temporal sequences of those inherent cortical patterns (3).

The same people who conducted the Mozart effect experiment also suggested that spatial-temporal reasoning is crucial in math. The areas of math that require ST reasoning are geometry and certain aspects of calculus, which require transformations of images in space and time. In higher mathematics, the ability to write mathematical proofs is also associated with ST reasoning because proof writing is a task that requires intuitive sense of natural sequences and the ability to think ahead several steps.

As to the question, what part of the brain controls the correlation between math and music, there are also many resources that provide answers.

Dr. Gottfried Schlaug, found that certain regions of the brain such as the corpus callosum and the right motor cortex, were larger in musician who started their musical training before the age of 7 (2). As to what happens in that area of the brain when one listens to music, we turn to the experiment performed by Xiaodeng Leng and Gordon Shaw. Gordon and Leng developed a model of higher brain function, which is based on the trion model. The trion model is a highly structured mathematical realization of the Mountcastle organization principle, with the column as the basic neuronal network in mammalian cortex. The column comprises mini-columns called trions.

One particular columnar network of trions has a large repertoire of spatial-temporal firing patterns, which can be excited and used in memory and higher brain functions (3). Shaw and Leng performed an experiment in which they mapped the trion model of firing patterns in that particular column onto various pitches and instruments producing recognizable styles of music. This mapping of the trions gaves insight to relate the neuronal processes involved in music and abstract spatial-temporal reasoning (3).

It shows that the part of the cortex, which contains the repertoire of spatial-temporal firing patterns, can be excited by music and is utilized in higher brain functions such as spatial-temporal thinking in mathematics.

In conclusion, my research into math and music does seem to suggest that music truly enhances mathematics skills. Music targets one specific area of the brain to stimulate the use of spatial-temporal reasoning, which is useful in mathematical thinking. However, as to the question of whether or not music is the magical portion that will elevate anyone’s ability to do math, the answer unfortunately . . .would be no.

Just because most mathematicians are fond of music, doesn’t mean that all musicians are fond of mathematics. I found a letter posted on the web written by a fourteen-year-old overachiever to a mathematics professor. The student expresses his frustration that even though he is an excellent musician, math is one of his weakest subjects. In math, he is not making the grades that he needs to stay in a certain prestigious academic program (4).

This letter seems to suggest that listening to music, or being able to master a musical instrument does not automatically guarantee that one can perform well in math. In other words, there are many musicians who are good in music but not in math. Music is a lot more than notes conforming to mathematical patterns and formulas. Music is exhilarating because of the intricacies of the patterns that occurs. Whether or not these patterns resemble math has no relevance to many musicians. More often than not, musicians are inclined to practice music because of the wonders and awe that they feel for music even if they are not aware of the math that is in music. Cindy Zhan

WWW Resources (1)Making the case of music education (2)Music on the mind (3)Spatial-temporal versus language-analytical reasoning: the role of music training (4)Letter written by a young musician

This Is Your Brain On Music BookThis Is Your Brain on Music: The Science of a Human Obsession is a popular science book written by the McGill University neuroscientist Daniel J. Levitin, and first published by Dutton Penguin in the U.S. and Canada in 2006, and updated and released in paperback by Plume/Penguin in 2007. It has been translated into 18 languages and spent more than a year on The New York Times, The Globe and Mail, and other bestseller lists, and sold more than one million copies.

Cost Of Marijuana In 120 Cities And How Much Tax Revenue If Legalized

First a few quick facts….

‏Tokyo, Japan has the most expensive cannabis‏ ‏, at 32.66 USD per gram. ‏

‏Quito, Ecuador has the least expensive marijuana‏ ‏, at 1.34 USD per gram.‏

‏Based on the average US marijuana tax rates currently implemented, ‏ ‏New York City could generate the highest potential tax revenue by legalizing weed‏ ‏, with 156.40 million USD per year. New York City also has the highest consumption rate of cannabis, at 77.44 metric tons per year.‏

‏Cannabis costs ‏ ‏$7.82 per gram in Toronto, Canada‏ ‏. ‏

‏Berlin, Germany – ‏ ‏Automatic cultivator device, ‏ ‏Seedo‏ ‏, after much research and data gathering, previously released the 2018 Cannabis Price Index, detailing the cost of marijuana in 120 global cities. Seedo is one of the many new ventures embracing the newly legalized cannabis industry. Their main goal is to allow both medicinal and recreational consumers to grow their own supply, avoiding extra taxes and bypassing harmful pesticides. The aim of this study is to illustrate the continuous need for legislative reform on cannabis use around the world, and to determine if there are any lessons to be learned from those cities at the forefront of marijuana legalisation.

‏Although Seedo’s technology enables smokers to get off the grid, this study considers one of the biggest byproducts of legalising cannabis—the potential tax revenue for the local government body. For this reason, Seedo decided not only to research the cost of cannabis around the world, but also to calculate how much potential tax a city could generate if they were to legalise marijuana. ‏

‏The study began first by selecting 120 cities across the world, including locations where cannabis is currently legal, illegal and partially legal, and where marijuana consumption data is available. Then, they looked into the price of weed per gram in each city. To calculate how much potential tax a city could make by legalising weed, Seedo investigated how much tax is paid on the most popular brand of cigarettes, as this offers the closest comparison. They then looked at what percentage marijuana is currently taxed in cities where it’s already legalised in the US. ‏

‏“This study has revealed some incredible insights into the kind of tax revenue that legalising weed could generate.” says Uri Zeevi, CMO at Seedo. “Take New York City for instance, which has the highest consumption level in the study at 77.44 metric tons of cannabis per year. If they taxed marijuana at the average US cannabis tax level, the city could make $‏ ‏156.4‏ ‏ million in potential tax revenue per year. This is equivalent to providing nearly 3 months worth of free school meals to every single public school kid in New York City.” ‏

‏The table below reveals a sample of the results for ‏ ‏Toronto, Canada‏ ‏:‏

‏City‏

‏Legality‏

‏Price per gram, US$‏

‏Total possible tax collection, if taxed at cigarette level, mil US$‏

‏Total possible tax collection, if taxed at average US marijuana taxes, mil US$‏

‏Total consumption in metric tons‏

‏Toronto‏

‏Partial‏

‏7.82‏

‏124.15‏

‏33.38‏

‏22.75‏

‏The table below shows the ‏ ‏top 10 most and least expensive cities for cannabis‏ ‏:‏

‏Top 10 Most Expensive Cities‏

‏Top 10 Least Expensive Cities‏

‏#‏

‏City‏

‏Country‏

‏Legality‏

‏Price per gram, US$‏

‏#‏

‏City‏

‏Country‏

‏Legality‏

‏Price per gram, US$‏

‏1‏

‏Tokyo‏

‏Japan‏

‏Illegal‏

‏32.66‏

‏1‏

‏Quito‏

‏Ecuador‏

‏Partial‏

‏1.34‏

‏2‏

‏Seoul‏

‏South Korea‏

‏Illegal‏

‏32.44‏

‏2‏

‏Bogota‏

‏Colombia‏

‏Partial‏

‏2.20‏

‏3‏

‏Kyoto‏

‏Japan‏

‏Illegal‏

‏29.65‏

‏3‏

‏Asuncion‏

‏Paraguay‏

‏Partial‏

‏2.22‏

‏4‏

‏Hong Kong‏

‏China‏

‏Illegal‏

‏27.48‏

‏4‏

‏Jakarta‏

‏Indonesia‏

‏Illegal‏

‏3.79‏

‏5‏

‏Bangkok‏

‏Thailand‏

‏Partial‏

‏24.81‏

‏5‏

‏Panama City‏

‏Panama‏

‏Illegal‏

‏3.85‏

‏6‏

‏Dublin‏

‏Ireland‏

‏Illegal‏

‏21.63‏

‏6‏

‏Johannesburg‏

‏South Africa‏

‏Illegal‏

‏4.01‏

‏7‏

‏Tallinn‏

‏Estonia‏

‏Partial‏

‏20.98‏

‏7‏

‏Montevideo‏

‏Uruguay‏

‏Legal‏

‏4.15‏

‏8‏

‏Shanghai‏

‏China‏

‏Illegal‏

‏20.82‏

‏8‏

‏Astana‏

‏Kazakhstan‏

‏Illegal‏

‏4.22‏

‏9‏

‏Beijing‏

‏China‏

‏Illegal‏

‏20.52‏

‏9‏

‏Antwerp‏

‏Belgium‏

‏Partial‏

‏4.29‏

‏10‏

‏Oslo‏

‏Norway‏

‏Partial‏

‏19.14‏

‏10‏

‏New Delhi‏

‏India‏

‏Partial‏

‏4.38‏

‏N.B. These tables are a sample of the full results. To find the complete results for all 120 cities, please see the bottom of the press release. ‏

‏The table below shows the ‏ ‏top 10 cities who could generate the most potential tax ‏ ‏by legalising cannabis, if taxed at the same rate as the most popular cigarette brand:‏

‏#‏

‏City‏

‏Country‏

‏Legality‏

‏Price per gram, US$‏

‏% of cigarette tax‏

‏Possible tax revenue, mil US$ ‏

‏1‏

‏Cairo‏

‏Egypt‏

‏Illegal‏

‏16.15‏

‏73.13‏

‏384.87‏

‏2‏

‏New York‏

‏USA‏

‏Partial‏

‏10.76‏

‏42.54‏

‏354.48‏

‏3‏

‏London‏

‏UK‏

‏Illegal‏

‏9.20‏

‏82.16‏

‏237.35‏

‏4‏

‏Sydney‏

‏Australia‏

‏Partial‏

‏10.79‏

‏56.76‏

‏138.36‏

‏5‏

‏Karachi‏

‏Pakistan‏

‏Illegal‏

‏5.32‏

‏60.7‏

‏135.48‏

‏6‏

‏Melbourne‏

‏Australia‏

‏Partial‏

‏10.84‏

‏56.76‏

‏132.75‏

‏7‏

‏Moscow‏

‏Russia‏

‏Partial‏

‏11.84‏

‏47.63‏

‏128.97‏

‏8‏

‏Toronto‏

‏Canada‏

‏Partial‏

‏7.82‏

‏69.8‏

‏124.15‏

‏9‏

‏Chicago‏

‏USA‏

‏Partial‏

‏11.46‏

‏42.54‏

‏119.61‏

‏10‏

‏Berlin‏

‏Germany‏

‏Partial‏

‏13.53‏

‏72.9‏

‏114.77‏

‏N.B. % of cigarette tax refers to the tax percentage on the most popular brand. Possible tax revenue refers to the total possible tax collection per year, if taxed at cigarette level. For a full explanation of how the study was conducted, please see the methodology at the bottom of the press release. ‏

‏The table below shows the ‏ ‏top 10 cities who could generate the most potential tax‏ ‏ by legalising cannabis, if taxed at the average US marijuana tax rate:‏

‏#‏

‏City‏

‏Country‏

‏Legality‏

‏Price per gram, US$‏

‏Possible tax revenue, mil US$‏

‏1‏

‏New York‏

‏USA‏

‏Partial‏

‏10.76‏

‏156.4‏

‏2‏

‏Cairo‏

‏Egypt‏

‏Illegal‏

‏16.15‏

‏98.78‏

‏3‏

‏London‏

‏UK‏

‏Illegal‏

‏9.20‏

‏54.22‏

‏4‏

‏Chicago‏

‏USA‏

‏Partial‏

‏11.46‏

‏52.77‏

‏5‏

‏Moscow‏

‏Russia‏

‏Partial‏

‏11.84‏

‏50.82‏

‏6‏

‏Sydney‏

‏Australia‏

‏Partial‏

‏10.79‏

‏45.75‏

‏7‏

‏Melbourne‏

‏Australia‏

‏Partial‏

‏10.84‏

‏43.9‏

‏8‏

‏Karachi‏

‏Pakistan‏

‏Illegal‏

‏5.32‏

‏41.89‏

‏9‏

‏Houston‏

‏USA‏

‏Partial‏

‏10.03‏

‏39.32‏

‏10‏

‏Toronto‏

‏Canada‏

‏Partial‏

‏7.82‏

‏33.38‏

‏N.B. Possible tax revenue refers to the total possible tax collection per year, if taxed at average US marijuana tax rate.‏

‏The table below shows the‏ ‏ top 10 cities with the highest and lowest consumption of cannabis, ‏ ‏per year:‏

‏Highest Consumers of Cannabis‏

‏ Lowest Consumers of Cannabis‏

‏#‏

‏City‏

‏Country‏

‏Legality‏

‏Price per gram, US$‏

‏Total consumption, metric tons‏

‏#‏

‏City‏

‏Country‏

‏Legality‏

‏Price per gram, US$‏

‏Total consumption, metric tons‏

‏1‏

‏New York‏

‏USA‏

‏Partial‏

‏10.76‏

‏77.44‏

‏1‏

‏Singapore‏

‏Singapore‏

‏Illegal‏

‏14.01‏

‏0.02‏

‏2‏

‏Karachi‏

‏Pakistan‏

‏Illegal‏

‏5.32‏

‏41.95‏

‏2‏

‏Santo Domingo‏

‏Dominican Rep.‏

‏Illegal‏

‏6.93‏

‏0.16‏

‏3‏

‏New Delhi‏

‏India‏

‏Partial‏

‏4.38‏

‏38.26‏

‏3‏

‏Kyoto‏

‏Japan‏

‏Illegal‏

‏29.65‏

‏0.24‏

‏4‏

‏Los Angeles‏

‏USA‏

‏Legal‏

‏8.14‏

‏36.06‏

‏4‏

‏Thessaloniki‏

‏Greece‏

‏Partial‏

‏13.49‏

‏0.29‏

‏5‏

‏Cairo‏

‏Egypt‏

‏Illegal‏

‏16.15‏

‏32.59‏

‏5‏

‏Luxembourg City‏

‏Luxembourg‏

‏Partial‏

‏7.26‏

‏0.32‏

‏6‏

‏Mumbai‏

‏India‏

‏Partial‏

‏4.57‏

‏32.38‏

‏6‏

‏Panama City‏

‏Panama‏

‏Illegal‏

‏3.85‏

‏0.37‏

‏7‏

‏London‏

‏UK‏

‏Illegal‏

‏9.20‏

‏31.4‏

‏7‏

‏Reykjavik‏

‏Iceland‏

‏Illegal‏

‏15.92‏

‏0.44‏

‏8‏

‏Chicago‏

‏USA‏

‏Partial‏

‏11.46‏

‏24.54‏

‏8‏

‏Asuncion‏

‏Paraguay‏

‏Partial‏

‏2.22‏

‏0.46‏

‏9‏

‏Moscow‏

‏Russia‏

‏Partial‏

‏11.84‏

‏22.87‏

‏9‏

‏Colombo‏

‏Sri Lanka‏

‏Illegal‏

‏9.12‏

‏0.59‏

‏10‏

‏Toronto‏

‏Canada‏

‏Partial‏

‏7.82‏

‏22.75‏

‏10‏

‏Manila‏

‏Philippines‏

‏Illegal‏

‏5.24‏

‏0.6‏

‏N.B. Total consumption is calculated per annum. ‏

‏Additional quotes:‏

‏“The way that the legalised cannabis industry is rapidly evolving alongside new technologies shows how innovative emerging tech companies are today.” says Uri Zeevi, CMO at Seedo. “Take the way that cannabis and cryptocurrency have joined forces, with ‏ ‏examples such as HempCoin or nezly, which manage processes and payments in the new marijuana industry.‏ ‏ When you consider too the potential that these new technologies have to disrupt the cannabis industry, there’s no denying that these are very exciting times.” ‏

‏“At Seedo, we’ve built technology that helps regular smokers to grow cannabis plants of the utmost quality from the comfort of their own home, avoiding pesticides and taking ownership of their personal supply.” says Uri Zeevi, CMO at Seedo. “We believe that by understanding the cost of weed around the world, we can help to educate smokers about the potential financial benefits of hydroponic growing technology.” ‏

‏“That illegal cannabis use is so high in countries that still carry the death penalty, such as Pakistan and Egypt, those in power ought to see how desperately new legislation is needed.” comments Uri Zeevi, CMO at Seedo. “By removing the criminal element from marijuana, governments will then able to more safely regulate production, take away power from underground gangs, and as we’ve shown in this study, generate huge tax revenues.”‏

‏Further findings:‏

‏New York City, USA has the highest consumption rate of cannabis‏ ‏, at 77.44 metric tons per year.‏

‏Boston, USA has the most expensive cannabis of all the cities where it’s legal‏ ‏, at 11.01 USD, while Montevideo, Uruguay has the least expensive at 4.15 USD. ‏

‏While Tokyo, Japan has the most expensive cannabis of all cities where it’s illegal, at 32.66 USD, ‏ ‏Jakarta, Indonesia has the least expensive at 3.79 USD, despite being classed as a Group 1 drug with harsh sentences such as life imprisonment and the death penalty.‏ ‏ ‏

‏For cities where cannabis is partially legal, Bangkok, Thailand has the most expensive at 24.81 USD, while Quito, Ecuador has the least expensive at 1.34 USD. ‏

‏Bulgaria has the highest tax rates for the most popular brand of cigarettes, at 82.65%, while Paraguay has the lowest, with rates of 16%. ‏

‏Cairo, Egypt would gain the most revenue in tax if they were to legalise cannabis‏ ‏ and tax it as the same rate as cigarettes, at 384.87 million USD. Singapore, Singapore would gain the least, at 0.14 million USD, due in part to the city’s low consumption of marijuana at 0.02 metric tons per annum.‏

‏Based on the average US marijuana tax rates currently implemented,‏ ‏ New York City could generate the highest potential tax revenue by legalising weed, with 156.4 million USD per year‏ ‏. Singapore, Singapore would gain the least, at 0.04 million USD

‏About “Seedo”‏ ‏: Seedo is a fully automated hydroponic growing device which lets you grow your own medicinal herbs and vegetables from the comfort of your own home. Seedo controls and monitors the growing process, from seed to plant, while providing optimal lab conditions to assure premium quality produce year-round. Seedo’s goal is to simplify the growing process, making it accessible for everyone, without compromising on quality. ‏

‏The full results of the 2018 Cannabis Price Index:‏

‏#‏

‏City‏

‏Country‏

‏Legality‏

‏Price per gram, US$‏

‏Taxes of cigarettes, % of the most sold brand‏

‏Total possible tax collection, if taxed at cigarette level, mil US$‏

‏Total possible tax collection, if taxed at average US marijuana taxes, mil US$‏

‏Total Consumption in metric tons‏

‏1‏

‏Tokyo‏

‏Japan‏

‏Illegal‏

‏32.66‏

‏64.36‏

‏32.14‏

‏9.37‏

‏1.53‏

‏2‏

‏Seoul‏

‏South Korea‏

‏Illegal‏

‏32.44‏

‏61.99‏

‏31.61‏

‏9.57‏

‏1.57‏

‏3‏

‏Kyoto‏

‏Japan‏

‏Illegal‏

‏29.65‏

‏64.36‏

‏4.64‏

‏1.35‏

‏0.24‏

‏4‏

‏Hong Kong‏

‏China‏

‏Illegal‏

‏27.48‏

‏44.43‏

‏19.72‏

‏8.33‏

‏1.62‏

‏5‏

‏Bangkok‏

‏Thailand‏

‏Partial‏

‏24.81‏

‏73.13‏

‏99.11‏

‏25.44‏

‏5.46‏

‏6‏

‏Dublin‏

‏Ireland‏

‏Illegal‏

‏21.63‏

‏77.80‏

‏29.31‏

‏7.07‏

‏1.74‏

‏7‏

‏Tallinn‏

‏Estonia‏

‏Partial‏

‏20.98‏

‏77.24‏

‏22.13‏

‏5.38‏

‏1.37‏

‏8‏

‏Shanghai‏

‏China‏

‏Illegal‏

‏20.82‏

‏44.43‏

‏49.12‏

‏20.75‏

‏5.31‏

‏9‏

‏Beijing‏

‏China‏

‏Illegal‏

‏20.52‏

‏44.43‏

‏43.10‏

‏18.21‏

‏4.73‏

‏10‏

‏Oslo‏

‏Norway‏

‏Partial‏

‏19.14‏

‏68.83‏

‏19.28‏

‏5.26‏

‏1.46‏

‏11‏

‏Washington, DC‏

‏USA‏

‏Partial‏

‏18.08‏

‏42.54‏

‏47.51‏

‏20.96‏

‏6.18‏

‏12‏

‏Cairo‏

‏Egypt‏

‏Illegal‏

‏16.15‏

‏73.13‏

‏384.87‏

‏98.78‏

‏32.59‏

‏13‏

‏Reykjavik‏

‏Iceland‏

‏Illegal‏

‏15.92‏

‏56.40‏

‏3.97‏

‏1.32‏

‏0.44‏

‏14‏

‏Belfast‏

‏Ireland‏

‏Illegal‏

‏15.81‏

‏77.80‏

‏13.55‏

‏3.27‏

‏1.10‏

‏15‏

‏Minsk‏

‏Belarus‏

‏Illegal‏

‏15.80‏

‏51.15‏

‏9.08‏

‏3.33‏

‏1.12‏

‏16‏

‏Athens‏

‏Greece‏

‏Partial‏

‏14.95‏

‏79.95‏

‏7.42‏

‏1.74‏

‏0.62‏

‏17‏

‏Auckland‏

‏New Zealand‏

‏Partial‏

‏14.77‏

‏77.34‏

‏106.03‏

‏25.73‏

‏9.28‏

‏18‏

‏Munich‏

‏Germany‏

‏Partial‏

‏14.56‏

‏72.90‏

‏50.90‏

‏13.10‏

‏4.80‏

‏19‏

‏Helsinki‏

‏Finland‏

‏Partial‏

‏14.42‏

‏81.53‏

‏27.12‏

‏6.24‏

‏2.31‏

‏20‏

‏Singapore‏

‏Singapore‏

‏Illegal‏

‏14.01‏

‏66.23‏

‏0.14‏

‏0.04‏

‏0.02‏

‏21‏

‏Berlin‏

‏Germany‏

‏Partial‏

‏13.53‏

‏72.90‏

‏114.77‏

‏29.55‏

‏11.64‏

‏22‏

‏Stuttgart‏

‏Germany‏

‏Partial‏

‏13.50‏

‏72.90‏

‏20.20‏

‏5.20‏

‏2.05‏

‏23‏

‏Thessaloniki‏

‏Greece‏

‏Partial‏

‏13.49‏

‏79.95‏

‏3.17‏

‏0.75‏

‏0.29‏

‏24‏

‏Stockholm‏

‏Sweden‏

‏Illegal‏

‏13.20‏

‏68.84‏

‏15.06‏

‏4.11‏

‏1.66‏

‏25‏

‏Vienna‏

‏Austria‏

‏Partial‏

‏12.87‏

‏74.00‏

‏59.21‏

‏15.02‏

‏6.22‏

‏26‏

‏Copenhagen‏

‏Denmark‏

‏Partial‏

‏12.47‏

‏74.75‏

‏20.65‏

‏5.18‏

‏2.22‏

‏27‏

‏Moscow‏

‏Russia‏

‏Partial‏

‏11.84‏

‏47.63‏

‏128.97‏

‏50.82‏

‏22.87‏

‏28‏

‏Hamburg‏

‏Germany‏

‏Partial‏

‏11.64‏

‏72.90‏

‏50.16‏

‏12.92‏

‏5.91‏

‏29‏

‏Chicago‏

‏USA‏

‏Partial‏

‏11.46‏

‏42.54‏

‏119.61‏

‏52.77‏

‏24.54‏

‏30‏

‏Philadelphia‏

‏USA‏

‏Partial‏

‏11.30‏

‏42.54‏

‏68.37‏

‏30.16‏

‏14.22‏

‏31‏

‏Bucharest‏

‏Romania‏

‏Partial‏

‏11.18‏

‏75.41‏

‏17.23‏

‏4.29‏

‏2.04‏

‏32‏

‏Cologne‏

‏Germany‏

‏Partial‏

‏11.14‏

‏72.90‏

‏28.51‏

‏7.34‏

‏3.51‏

‏33‏

‏Geneva‏

‏Switzerland‏

‏Partial‏

‏11.12‏

‏61.20‏

‏5.90‏

‏1.81‏

‏0.87‏

‏34‏

‏Boston‏

‏USA‏

‏Legal‏

‏11.01‏

‏42.54‏

‏28.59‏

‏12.61‏

‏6.10‏

‏35‏

‏Adelaide‏

‏Australia‏

‏Partial‏

‏10.91‏

‏56.76‏

‏41.60‏

‏13.75‏

‏6.72‏

‏36‏

‏Istanbul‏

‏Turkey‏

‏Partial‏

‏10.87‏

‏82.13‏

‏21.79‏

‏4.98‏

‏2.44‏

‏37‏

‏Melbourne‏

‏Australia‏

‏Partial‏

‏10.84‏

‏56.76‏

‏132.75‏

‏43.90‏

‏21.58‏

‏38‏

‏Sydney‏

‏Australia‏

‏Partial‏

‏10.79‏

‏56.76‏

‏138.36‏

‏45.75‏

‏22.59‏

‏39‏

‏New York‏

‏USA‏

‏Partial‏

‏10.76‏

‏42.54‏

‏354.48‏

‏156.40‏

‏77.44‏

‏40‏

‏Düsseldorf‏

‏Germany‏

‏Partial‏

‏10.70‏

‏72.90‏

‏15.82‏

‏4.07‏

‏2.03‏

‏41‏

‏Brisbane‏

‏Australia‏

‏Partial‏

‏10.63‏

‏56.76‏

‏66.88‏

‏22.12‏

‏11.09‏

‏42‏

‏Hanover‏

‏Germany‏

‏Partial‏

‏10.51‏

‏72.90‏

‏13.46‏

‏3.47‏

‏1.76‏

‏43‏

‏Prague‏

‏Czech Rep.‏

‏Partial‏

‏10.47‏

‏77.42‏

‏63.95‏

‏15.50‏

‏7.89‏

‏44‏

‏Frankfurt‏

‏Germany‏

‏Partial‏

‏10.29‏

‏72.90‏

‏18.06‏

‏4.65‏

‏2.41‏

‏45‏

‏Wellington‏

‏New Zealand‏

‏Partial‏

‏10.11‏

‏77.34‏

‏19.53‏

‏4.74‏

‏2.50‏

‏46‏

‏Dallas‏

‏USA‏

‏Partial‏

‏10.03‏

‏42.54‏

‏51.01‏

‏22.50‏

‏11.95‏

‏47‏

‏Houston‏

‏USA‏

‏Partial‏

‏10.03‏

‏42.54‏

‏89.13‏

‏39.32‏

‏20.89‏

‏48‏

‏Vilnius‏

‏Lithuania‏

‏Illegal‏

‏10.00‏

‏75.76‏

‏5.20‏

‏1.29‏

‏0.69‏

‏49‏

‏Zurich‏

‏Switzerland‏

‏Partial‏

‏9.71‏

‏61.20‏

‏10.33‏

‏3.17‏

‏1.74‏

‏50‏

‏Montpellier‏

‏France‏

‏Illegal‏

‏9.70‏

‏80.30‏

‏12.21‏

‏2.85‏

‏1.57‏

‏51‏

‏Canberra‏

‏Australia‏

‏Partial‏

‏9.65‏

‏56.76‏

‏10.96‏

‏3.63‏

‏2.00‏

‏52‏

‏Zagreb‏

‏Croatia‏

‏Partial‏

‏9.43‏

‏75.26‏

‏24.35‏

‏6.07‏

‏3.43‏

‏53‏

‏Nice‏

‏France‏

‏Illegal‏

‏9.40‏

‏80.30‏

‏15.80‏

‏3.69‏

‏2.09‏

‏54‏

‏Phoenix‏

‏USA‏

‏Partial‏

‏9.35‏

‏42.54‏

‏58.26‏

‏25.71‏

‏14.65‏

‏55‏

‏Paris‏

‏France‏

‏Illegal‏

‏9.30‏

‏80.30‏

‏102.25‏

‏23.90‏

‏13.69‏

‏56‏

‏Miami‏

‏USA‏

‏Partial‏

‏9.27‏

‏42.54‏

‏16.24‏

‏7.16‏

‏4.12‏

‏57‏

‏San Francisco‏

‏USA‏

‏Legal‏

‏9.27‏

‏42.54‏

‏30.94‏

‏13.65‏

‏7.85‏

‏58‏

‏London‏

‏UK‏

‏Illegal‏

‏9.20‏

‏82.16‏

‏237.35‏

‏54.22‏

‏31.40‏

‏59‏

‏Colombo‏

‏Sri Lanka‏

‏Illegal‏

‏9.12‏

‏73.78‏

‏3.98‏

‏1.01‏

‏0.59‏

‏60‏

‏Riga‏

‏Latvia‏

‏Illegal‏

‏9.00‏

‏76.89‏

‏10.23‏

‏2.50‏

‏1.48‏

‏61‏

‏Bratislava‏

‏Slovakia‏

‏Illegal‏

‏8.92‏

‏81.54‏

‏7.24‏

‏1.67‏

‏1.00‏

‏62‏

‏Milan‏

‏Italy‏

‏Partial‏

‏8.85‏

‏75.68‏

‏46.06‏

‏11.42‏

‏6.88‏

‏63‏

‏Varna‏

‏Bulgaria‏

‏Illegal‏

‏8.83‏

‏82.65‏

‏4.84‏

‏1.10‏

‏0.66‏

‏64‏

‏Marseille‏

‏France‏

‏Illegal‏

‏8.69‏

‏80.30‏

‏36.23‏

‏8.47‏

‏5.19‏

‏65‏

‏Glasgow‏

‏UK‏

‏Illegal‏

‏8.65‏

‏82.16‏

‏15.21‏

‏3.47‏

‏2.14‏

‏66‏

‏Toulouse‏

‏France‏

‏Illegal‏

‏8.62‏

‏80.30‏

‏18.67‏

‏4.36‏

‏2.70‏

‏67‏

‏Birmingham‏

‏UK‏

‏Illegal‏

‏8.58‏

‏82.16‏

‏27.73‏

‏6.34‏

‏3.93‏

‏68‏

‏Kuala Lumpur‏

‏Malaysia‏

‏Illegal‏

‏8.54‏

‏55.36‏

‏6.61‏

‏2.24‏

‏1.40‏

‏69‏

‏Monterrey‏

‏Mexico‏

‏Partial‏

‏8.45‏

‏65.87‏

‏4.17‏

‏1.19‏

‏0.75‏

‏70‏

‏Edinburgh‏

‏UK‏

‏Illegal‏

‏8.41‏

‏82.16‏

‏12.22‏

‏2.79‏

‏1.77‏

‏71‏

‏Lisbon‏

‏Portugal‏

‏Partial‏

‏8.36‏

‏74.51‏

‏4.69‏

‏1.18‏

‏0.75‏

‏72‏

‏Strasbourg‏

‏France‏

‏Illegal‏

‏8.35‏

‏80.30‏

‏11.13‏

‏2.60‏

‏1.66‏

‏73‏

‏Warsaw‏

‏Poland‏

‏Partial‏

‏8.31‏

‏80.29‏

‏29.27‏

‏6.84‏

‏4.39‏

‏74‏

‏Lyon‏

‏France‏

‏Illegal‏

‏8.20‏

‏80.30‏

‏19.45‏

‏4.55‏

‏2.95‏

‏75‏

‏Los Angeles‏

‏USA‏

‏Legal‏

‏8.14‏

‏42.54‏

‏124.88‏

‏55.10‏

‏36.06‏

‏76‏

‏Liverpool‏

‏UK‏

‏Illegal‏

‏7.94‏

‏82.16‏

‏10.86‏

‏2.48‏

‏1.67‏

‏77‏

‏Amsterdam‏

‏Netherlands‏

‏Partial‏

‏7.89‏

‏73.40‏

‏20.94‏

‏5.35‏

‏3.61‏

‏78‏

‏Manchester‏

‏UK‏

‏Illegal‏

‏7.88‏

‏82.16‏

‏58.99‏

‏13.48‏

‏9.11‏

‏79‏

‏Rome‏

‏Italy‏

‏Partial‏

‏7.86‏

‏75.68‏

‏88.16‏

‏21.86‏

‏14.82‏

‏80‏

‏Toronto‏

‏Canada‏

‏Partial‏

‏7.82‏

‏69.80‏

‏124.15‏

‏33.38‏

‏22.75‏

‏81‏

‏Denver‏

‏USA‏

‏Legal‏

‏7.79‏

‏42.54‏

‏20.53‏

‏9.06‏

‏6.20‏

‏82‏

‏Naples‏

‏Italy‏

‏Partial‏

‏7.75‏

‏75.68‏

‏29.82‏

‏7.40‏

‏5.08‏

‏83‏

‏Leeds‏

‏UK‏

‏Illegal‏

‏7.67‏

‏82.16‏

‏16.93‏

‏3.87‏

‏2.69‏

‏84‏

‏Seattle‏

‏USA‏

‏Legal‏

‏7.58‏

‏42.54‏

‏20.59‏

‏9.08‏

‏6.39‏

‏85‏

‏Madrid‏

‏Spain‏

‏Partial‏

‏7.47‏

‏78.09‏

‏93.40‏

‏22.45‏

‏16.01‏

‏86‏

‏Calgary‏

‏Canada‏

‏Partial‏

‏7.30‏

‏69.80‏

‏52.23‏

‏14.05‏

‏10.25‏

‏87‏

‏Luxembourg City‏

‏Luxembourg‏

‏Partial‏

‏7.26‏

‏70.24‏

‏1.62‏

‏0.43‏

‏0.32‏

‏88‏

‏San Jose‏

‏Costa Rica‏

‏Partial‏

‏7.23‏

‏69.76‏

‏7.84‏

‏2.11‏

‏1.56‏

‏89‏

‏Buenos Aires‏

‏Argentina‏

‏Partial‏

‏7.13‏

‏69.84‏

‏25.32‏

‏6.81‏

‏5.09‏

‏90‏

‏Brussels‏

‏Belgium‏

‏Partial‏

‏7.09‏

‏75.92‏

‏15.50‏

‏3.83‏

‏2.88‏

‏91‏

‏Santo Domingo‏

‏Dominican Rep.‏

‏Illegal‏

‏6.93‏

‏58.87‏

‏0.67‏

‏0.21‏

‏0.16‏

‏92‏

‏Graz‏

‏Austria‏

‏Partial‏

‏6.84‏

‏74.00‏

‏4.81‏

‏1.22‏

‏0.95‏

‏93‏

‏Budapest‏

‏Hungary‏

‏Illegal‏

‏6.74‏

‏77.26‏

‏7.70‏

‏1.87‏

‏1.48‏

‏94‏

‏Sofia‏

‏Bulgaria‏

‏Illegal‏

‏6.66‏

‏82.65‏

‏12.83‏

‏2.91‏

‏2.33‏

‏95‏

‏Ottawa‏

‏Canada‏

‏Partial‏

‏6.62‏

‏69.80‏

‏35.43‏

‏9.53‏

‏7.67‏

‏96‏

‏Vancouver‏

‏Canada‏

‏Partial‏

‏6.40‏

‏69.80‏

‏23.44‏

‏6.30‏

‏5.25‏

‏97‏

‏Sao Paulo‏

‏Brazil‏

‏Partial‏

‏6.38‏

‏64.94‏

‏68.55‏

‏19.81‏

‏16.55‏

‏98‏

‏Rotterdam‏

‏Netherlands‏

‏Partial‏

‏6.33‏

‏73.40‏

‏12.75‏

‏3.26‏

‏2.74‏

‏99‏

‏Ljubljana‏

‏Slovenia‏

‏Partial‏

‏6.32‏

‏80.41‏

‏3.43‏

‏0.80‏

‏0.67‏

‏100‏

‏Barcelona‏

‏Spain‏

‏Partial‏

‏6.23‏

‏78.09‏

‏39.59‏

‏9.51‏

‏8.14‏

‏101‏

‏Montreal‏

‏Canada‏

‏Partial‏

‏6.15‏

‏69.80‏

‏60.52‏

‏16.27‏

‏14.10‏

‏102‏

‏Kiev‏

‏Ukraine‏

‏Partial‏

‏6.00‏

‏74.78‏

‏14.73‏

‏3.70‏

‏3.28‏

‏103‏

‏Abuja‏

‏Nigeria‏

‏Illegal‏

‏5.88‏

‏20.63‏

‏7.40‏

‏6.73‏

‏6.10‏

‏104‏

‏Lima‏

‏Peru‏

‏Partial‏

‏5.88‏

‏37.83‏

‏12.28‏

‏6.09‏

‏5.52‏

‏105‏

‏Mexico City‏

‏Mexico‏

‏Partial‏

‏5.87‏

‏65.87‏

‏22.58‏

‏6.43‏

‏5.84‏

‏106‏

‏Cape Town‏

‏South Africa‏

‏Illegal‏

‏5.82‏

‏48.80‏

‏2.47‏

‏0.95‏

‏0.87‏

‏107‏

‏Karachi‏

‏Pakistan‏

‏Illegal‏

‏5.32‏

‏60.70‏

‏135.48‏

‏41.89‏

‏41.95‏

‏108‏

‏Manila‏

‏Philippines‏

‏Illegal‏

‏5.24‏

‏74.27‏

‏2.32‏

‏0.59‏

‏0.60‏

‏109‏

‏Rio de Janeiro‏

‏Brazil‏

‏Partial‏

‏5.11‏

‏64.94‏

‏28.82‏

‏8.33‏

‏8.69‏

‏110‏

‏Mumbai‏

‏India‏

‏Partial‏

‏4.57‏

‏60.39‏

‏89.38‏

‏27.78‏

‏32.38‏

‏111‏

‏New Delhi‏

‏India‏

‏Partial‏

‏4.38‏

‏60.39‏

‏101.20‏

‏31.45‏

‏38.26‏

‏112‏

‏Antwerp‏

‏Belgium‏

‏Partial‏

‏4.29‏

‏75.92‏

‏4.10‏

‏1.01‏

‏1.26‏

‏113‏

‏Astana‏

‏Kazakhstan‏

‏Illegal‏

‏4.22‏

‏39.29‏

‏1.78‏

‏0.85‏

‏1.07‏

‏114‏

‏Montevideo‏

‏Uruguay‏

‏Legal‏

‏4.15‏

‏66.75‏

‏19.54‏

‏5.50‏

‏7.06‏

‏115‏

‏Johannesburg‏

‏South Africa‏

‏Illegal‏

‏4.01‏

‏48.80‏

‏3.76‏

‏1.45‏

‏1.92‏

‏116‏

‏Panama City‏

‏Panama‏

‏Illegal‏

‏3.85‏

‏56.52‏

‏0.81‏

‏0.27‏

‏0.37‏

‏117‏

‏Jakarta‏

‏Indonesia‏

‏Illegal‏

‏3.79‏

‏53.40‏

‏1.92‏

‏0.68‏

‏0.95‏

‏118‏

‏Asuncion‏

‏Paraguay‏

‏Partial‏

‏2.22‏

‏16.00‏

‏0.16‏

‏0.19‏

‏0.46‏

‏119‏

‏Bogota‏

‏Colombia‏

‏Partial‏

‏2.20‏

‏49.44‏

‏15.80‏

‏6.00‏

‏14.53‏

‏120‏

‏Quito‏

‏Ecuador‏

‏Partial‏

‏1.34‏

‏70.39‏

‏0.56‏

‏0.15‏

‏0.60‏

‏Methodology‏

‏Selection of the cities:‏

‏To select the cities for the study, Seedo first looked at the top and bottom cannabis consuming countries around the world. Then they analysed nations where marijuana is partially or completely legal, as well as illegal, and selected the final list of 120 cities in order to best offer a representative comparison of the global cannabis price. ‏

‏Data:‏

‏Price per gram, US$ ‏ ‏- Crowdsourced city-level surveys adjusted to World Drug Report 2017 of the United Nations Office on Drugs and Crime.‏

‏Taxes on Cigarettes, % of the most sold brand‏ ‏ – Taxes as a percentage of the retail price of the most sold brand (total tax). ‏ ‏Source‏ ‏: Appendix 2 of the WHO report on the global tobacco epidemic, 2015.‏

‏Annual possible tax collection is calculated in the following way: ‏

‏Total_Possible_Tax=Population_City*Prevalence*Avg_Consumption_year_gr*price*tax_level, where:‏

‏Population: latest available local population data sources.‏

‏Annual Prevalence (percentage of population, having used weed in the year). Source: World Drug Report 2017 of the United Nations Office on Drugs and Crime‏

‏Average Consumption of weed per year in grams (people who consumed weed at least once in the previous year). ‏

‏Estimation, with the assumption, that one use of weed on average means one joint. ‏

‏One joint is assumed to have 0.66 grams of weed as in the paper of Mariani, Brooks, Haney and Levin (2010). ‏

‏The distribution of use during the year is assumed to be the same as in Zhao and Harris (2004), where the yearly usage varies from once or twice a year to everyday.‏

‏Total Consumption in Tons‏

‏Consumption=Population*Prevalence*Consumption_year_gr‏

‏Population: latest available local population data sources.‏

‏Annual Prevalence (percentage of population, having used weed in the year). ‏ ‏Source‏ ‏: World Drug Report 2017 of the United Nations Office on Drugs and Crime‏

‏Average Consumption of weed per year in grams (people who consumed weed at least once in the previous year).‏

‏Estimation, with the assumption, that one use of weed on average means one joint. ‏

‏One joint is assumed to have 0.66 grams of weed as in the paper of Mariani, Brooks, Haney and Levin (2010). ‏

‏The distribution of use during the year is assumed to be the same as in Zhao and Harris (2004), where the yearly usage varies from once or twice a year to everyday. ‏

‏US tax level ‏ ‏- Average tax level in the states of US where weed is legal: Alaska, California, Colorado, Maine, Massachusetts, Nevada, Oregon and Washington. Includes retail sales taxes, state taxes, local taxes and excise taxes.‏

‏Legality‏

‏Legal, if possession and selling for recreational and medical use is legal.‏

‏Illegal, if possession and selling for recreational and medical use is illegal.‏

‏Partial, if ‏

‏Possession of small amounts is decriminalised (criminal penalties lessened, fines and regulated permits may still apply)‏

‏OR medicinal use legal‏

‏OR possession is legal, selling illegal‏

‏OR scientific use legal‏

‏OR usage allowed in restricted areas (e.g. homes or coffee shops)‏

‏OR local laws may apply to legality (e.g. illegal at federal level, legal at state level)‏

‏First quote: Based on New York City Council’s free lunch initiative which began in September 2017, with 1.1 million public school children, at a cost of $1.75 per child per day.‏

Warhol, Lichtenstein Art Auction look back

Is it us or is there something 'photoshop' and 'meme'-like to Warhol's work? CP

Almost one decade ago: Andy Warhol’s “Endangered Species and Ads” prints bring a combined $677,000 USD alone at this notable Modern and Contemporary Art event.

Two complete portfolios by Andy Warhol, Endangered Species, 1983 and Ads, 1985, sold for $338,500 USD each to far exceed their estimates among a field of fresh-to-market iconic works during Heritage Auctions’ $2.9 million USD Modern and Contemporary Art Signature® Auction, May 22 in Dallas.

The auction sold 90% by value and 78% by lot.

Close up of one of the ten screenprints up for auction by ANDY WARHOL (American, 1928-1987) Ads, 1985 Portfolio of ten screenprints on Lenox Museum Board 38 x 38 inches (96.5 x 96.5 cm) Ed. 50/190 Each signed and numbered in pencil Printed by Rupert Jasen Smith, New York Published by Ronald Feldman Fine Arts, Inc., New York PROVENANCE: Private collection, Texas LITERATURE: Feldman & Schellmann, II.350-359 Warhol, Andy:. American painter, photographer, filmaker and publisher, 1928-1987
Close up of one of the ten screenprints up for auction by ANDY WARHOL (American, 1928-1987)
Ads, 1985
Portfolio of ten screenprints on Lenox Museum Board
38 x 38 inches (96.5 x 96.5 cm)
Ed. 50/190
Each signed and numbered in pencil
Printed by Rupert Jasen Smith, New York
Published by Ronald Feldman Fine Arts, Inc., New York
PROVENANCE:
Private collection, Texas
LITERATURE:
Feldman & Schellmann, II.350-359
Warhol, Andy:. American painter, photographer, filmaker and publisher, 1928-1987

Here's a look at some of the other Warhol auctions. Endangered Species earned over 1/3 of a million dollars. CP

ANDY WARHOL (American, 1928-1987)

Ads, 1985

Portfolio of ten screenprints on Lenox Museum Board

38 x 38 inches (96.5 x 96.5 cm)

Ed. 50/190

Each signed and numbered in pencil

Printed by Rupert Jasen Smith, New York

Published by Ronald Feldman Fine Arts, Inc., New York

PROVENANCE:

Private collection, Texas

LITERATURE:

Feldman & Schellmann, II.350-359

Warhol, Andy: American painter, photographer, filmaker and publisher, 1928-1987

Condition Report*:

With original Ronald Feldman Fine Arts, Inc. cardboard portfolio box and index print. All screenprints unframed and in good condition with specifics listed below. Mobil: Minor rubbing 3/8″ in due to former frame. A few incidental surface scratches and rubs. One 5/8″ abrasion, resulting in very minor loss. Paramount: Minor rubbing 3/8′ to 1/2″ due to former frame. Very minor bumping to bottom right corner. Chanel: 1/2″ to 1″ light rubbing due to former frame. Slate purple backgrund has hazy toning, beginning about 1/4″ in. Apple: Very minor incidental rubbing to edge. Rebel Without A Cause (James Dean); Van Heusen (Ronald Reagan); Blackglama (Judy Garland): All have only very minor edgewear. Volkswagen; Life Savers: Very minor surface rubbing and edgewear. Donald Duck: Very minor edgewear. Top corners have minor wear. Light handling creases. Some wrinkling and an indentation at end of signature. Left side center shows some moderate wrinkling and creases with some minor loss, beginning at 11″ from the bottom up to 24″, and affecting 3″ into the work. The face and body of Donald Duck is affected somewhat, as well as the background near edge. Light wear in top left corner and a small abrasion on middle right side. Unframed
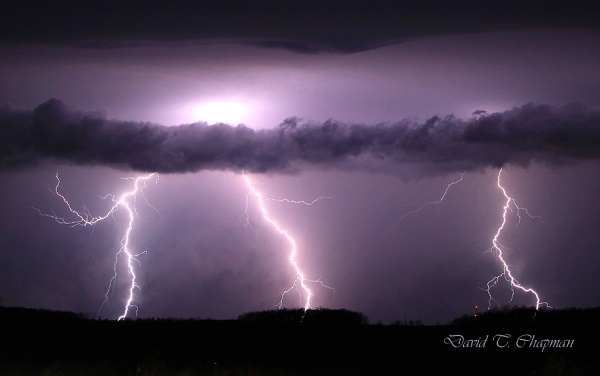
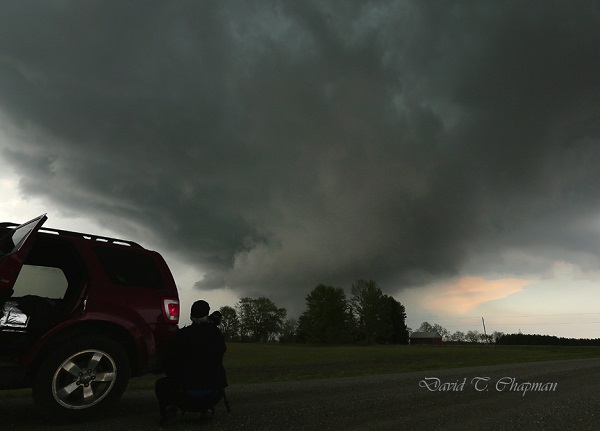
Two works by Ed Ruscha responded well among buyers as his gunpowder on paper titled Rustic Pines, 1967, realized $290,500 USD and a color screenprint, Double Standard, 1969, sold for $182,500 USD , setting a record for the work. Mel Ramos’ Georgia Peach, 1964, fresh from a Texas collection, sold for $158,500 USD.

“The market for good contemporary art doesn’t seem to have hit any ceiling,” said Frank Hettig, Director of Modern and Contemporary Art at Heritage. “Our focus is presenting fantastic, fresh-to-market discoveries and bidders certainly responded in kind. It gives us high expectations for our November 2 Modern and Contemporary auction in Dallas.”

Among the modern masterpieces in the auction, the magnificent, 7-foot Cobalt Chandelier, 2003, by Dale Chihuly reached $158,500 USD. It is the largest Chihuly chandelier to appear on the secondary market and was offered through a federal court-appointed receivership overseeing the sale of assets previously owned by R. Allen Stanford of Stanford Financial Group.

Forms in Space by Lichtenstein earned $53,125.

Roy Lichtenstein’s Forms in Space, 1985, a screenprint published by the artist for the Institute of Contemporary Art’s Rally round the Flag benefit, achieved $53,125 USD and Georges Rouault’s Chemineau, 1937, realized $40,625 USD.

Here's a look at what some Lichtenstein's other pieces sold for.
Here’s a look at what some Lichtenstein’s other pieces sold for.

Sculptural art performed well as Étienne Hajdu’s La Mer, 1964, sold for $35,000 USD and Pablo Picasso’s Vase deux anses hautes, 1953, sold for $30,000 USD while Robert Graham’s Frieze Figure I-G, 1989/1990, brought $21,250 USD.

So what is that Volkswagen Warhol worth today in 2021? It’s hard to pen the value but in Spring 2019 one single print ad brought 30,000 UK Pounds ( 52,000 $ CAD) in a Christie’s auction.


ROY LICHTENSTEIN (American, 1923-1997)

 Forms in Space, 1985

 Screenprint in colors on Rives BFK paper

 31 x 47-1/2 inches (78.7 x 120.7 cm)

 Ed. 35/125

 Signed, dated and numbered in pencil


LITERATURE:

 Corlett, 217

NOTE:

 Published by the artist for the Institute of Contemporary Art, University of Pennsylvania, Philadelphia.

 Forms in Space has been created especially in honor of ICA’s benefit, Rally round the Flag (label on frame verso) .

Lichtenstein, Roy:. American painter, printmaker; born 1923 in New York City, died 1997 in New York City


Condition Report*:

 Sheet: 35.75 x 51.5 A crease in upper center at extreme sheet edge; small pressure mark at lower right corner; lower right corner lightly bumped; paper lightly undulates; framed. Framed Dimensions 36.25 X 52.5 Inches


Supplemental- Apple logo designer dishes on history http://www.macworld.com/article/1142322/logo_design.html

How To Add Significant Value To Your Home

Your home isn’t the just place that you reside and raise your family, it is also an investment. This is why it is important to try and improve the overall value of your house whenever possible. Thus, if you need to sell it in the future, you can end up making quite a profit. Of course, this can only be achieved if you make the right changes to your home. To figure out what these are, keep reading…

Upgrade the Right Parts of Your Home

Believe it or not, only a few sections of your home need to be updated. The rest can be left as is and you can simply modify them with a coat of paint. However, there are some regions that people use more than others. So, by ensuring that they are kept modern and effective, you can boost your home value quite a bit.

In particular, you should upgrade your kitchen and your bathrooms. Now, there is no need to go overboard – a serious overhaul will not provide you with the return on investment that you are looking for. Instead, make changes to improve the look and the functionality of these spaces. Home buyers will look for these modifications in particular.

Add More Rooms

As you can imagine, homes with a greater number of bedrooms are also held in high value. This is why you should try to add one for the lowest price possible. So, instead of building a new space, see if you can convert a current room in your home. For instance, do you have a basement? If so, check out these Penguin Basements ideas to see just how you can transform this space into a functioning, livable area. It is actually a lot easier than you might imagine.

Penguin wine storage solution.

Create a Versatile Space

Even if you don’t want to build an extra bedroom, you should still get a quote for a basement finishing in Brampton. Why? This is because your basement can be used for a number of different purposes. And, while you may not have much need for it, the next family might. Thus, by making sure that it is all cleaned up and waterproofed, you will automatically be creating a versatile space. You will then be able to market this in any way that you want, depending on the people that you would like to sell it to.

Maintain Aesthetic Appeal

As you can imagine, aesthetic appeal can be rather important when selling your home. After all, most home buyers will base much of their decisions on how the house looks. Thus, painting the interior and exterior can go a long way towards boosting value. Not to mention, you should also fix or replace any fixtures or features that are worn out or damaged in any way. Last but certainly not least, make it a point to keep your gardens and curbs in good condition.

These are all of the ways that you can add some serious value to your home. So, if you are considering making any changes, these are the ones that you should begin with.

The Role of Proper Dental Care In Your Well-being

The average person doesn’t take too much care of their oral health. Sure, they will brush their teeth twice a day. And, if they are really particular, they may even floss on a regular basis. Beyond this, however, few people really pay attention to what is going on with their teeth and gums.


While this may seem like a suitable way to live, rest assured, it isn’t. What most people fail to understand is just how important good dental care is for their well-being. If you, yourself, are cynical about its significance, take a look at the facts below:


It Can Prevent Irreversible Problems


If you don’t really think about your oral health often, you may not understand that the tissues in your mouth can be a little different. This is especially true in the case of your gums. Now, in many parts of your body, the tissue has the ability to grow back. So, if there is some loss, this typically isn’t too much of a big deal.


This isn’t the case with gum tissue, though. So, if you experience recession due to gum disease or a similar issue, this loss will be permanent. Fortunately, if you visit Barrie dentists near you once or twice a year, then you will be able to keep this issue at bay. In turn, you will be able to prevent gum loss from happening in the first place.


It Can Reduce the Risk of Recurring Issues


There are few things that are more annoying than tooth problems that just won’t go away. Of course, these conditions aren’t just painful, they can also be rather dangerous too. Recurring infections, for instance, can do permanent damage. This is especially true in the case of wisdom teeth that are unable to correct themselves.


If you see your dentist as needed, though, there is no need to worry about these problems. They will simply inform you when your wisdom teeth have to be removed. This can often be done before your teeth cause too many issues. Then, by undergoing the necessary procedures, you will be able to prevent these conditions from coming back.


Dental Health Impacts Your General Health


It is easy to imagine that your dental health can only affect your mouth and gums. The truth, however, is that it can actually have an effect on your general health as well. Understand, diseases and infections in your mouth can travel to other parts of your body, including your heart. They can then take up residence there and cause extensive damage, resulting in serious diseases.

The team at Barrie Smile Centre will help you stay on top of your oral health.


If you stay on top of your oral health, though, then you will be able to stop these infections from occurring in the first place. At the very least, you will be able to catch them in their earlier stages and ensure that they don’t spread any further.


As you can see, oral care needs to be taken more seriously. So, make sure that you visit a dentist as often as you should. You may never know when such a precaution could end up saving your life! For the Silo, Michael Adams.

When Planting Native Ontario Trees Use This Tree Atlas

There are many reasons to plant a tree – to shade your home, help the environment, or just for the pleasure and beauty it brings. There are many questions when it comes to choosing the right tree. What kind of tree will thrive in my community, and on my property? How fast will it grow? Should I worry about choosing a native Ontario tree?

The Tree Atlas

You can get answers to those questions and much more information from an online Tree Atlas (ontario.ca/treeatlas).

The Tree Atlas shows you which trees will work where you live, your soil type, and other conditions to consider. It can also help you find the kind of tree that helps you achieve other goals, like offering shade to keep your home cool in the summer, attracting birds, or a fast-growing, bushy species to hide an unsightly view.

The Tree Atlas describes trees that are native to Ontario, so you’ll be planting a tree that’s adapted to the province and supports a healthy environment. You’ll also find tips on when and how to plant a tree to give it the best chances to thrive on your property.

Trees clean our air and water, help fight climate change, increase wildlife habitat, provide shade and help prevent flooding.  When you plant a tree, you’re helping the environment.

The Tree Atlas was developed by the Ministry of Natural Resources, so you can be confident that the information provided is accurate and reliable.

 Many Ontario towns and cities have tree planting programs – check with your municipality for tree planting information and assistance in your area. For the Silo, Emmilia Kuisma, District Strategic Officer Ministry of Natural Resources.

The Royal Ontario Museum Publishes Cloth That Changed The World: The Art And Fashion Of Indian Chintz

New book explores the story of India’s richly coloured textiles ahead of ROM original exhibition

Photography by Tina Weltz

TORONTO — The Royal Ontario Museum (ROM) is pleased to announce the publication of Cloth that Changed the World: The Art and Fashion of Indian Chintz on December 2, 2019. The collection of essays explores the far-reaching influence this vividly printed and painted cotton cloth has had on the world, from its origins 5,000 years ago to its place in fashion and home décor today. The volume is the official companion to the ROM-original exhibition The Cloth that Changed the World: India’s Painted and Printed Cottons, which runs from April 4 to September 27, 2020 in Toronto.

The scholarly and beautifully illustrated publication draws from the Royal Ontario Museum’s own Indian chintz collection, which ranks as one of the best in the world. Featuring extensive new research, this multidisciplinary book traces the story of chintz and the indelible footprint it has left on the world. The publication combines vivid field photography of artisans at work with striking images from the ROM’s world-class collection, as well as images from India’s fashion runways and the work of top designers embracing this heritage textile today.

“The world would be a drab place without India,” says Sarah Fee, editor, Cloth that Changed the World and ROM Senior Curator of Eastern Hemisphere Fashion and Textiles. “Our blue jeans and printed T-shirts trace much of their lineage back to the ingenuity of India’s cotton printers and dyers. This exhibition and companion book celebrate how India ‘clothed the world’ in exuberantly coloured cottons for thousands of years. It explores the art’s resiliency in the face of modern industrial imitation and shares the exciting stories of reviving natural dyes and hand skills in India today.”

Contributing writers include leading experts Ruth Barnes, Rosemary Crill, Steven Cohen, Deepali Dewan, Max Dionisio, Eiluned Edwards, Sarah Fee, Maria João Ferreira, Sylvia Houghteling, Peter Lee, Hanna Martinsen, Deborah A. Metsger, Alexandra Palmer, Divia Patel, Giorgio Riello, Rajarshi Sengupta, Philip Sykas, and João Teles e Cunha, and a preface by Sven Beckert, Harvard University’s Laird Bell Professor of History.

Next spring, the book comes to life in the ROM’s Patricia Harris Gallery of Textiles and Costumes, where ROM-original exhibition The Cloth that Changed the World: India’s Painted and Printed Cottons will take visitors on a journey through the ROM’s world-renowned collection of chintz, on public display for the first time in over 50 years.

The striking exhibition will explore thought-provoking themes, including the ingenuity, skill and technique of Indian artisans; the adaptation of chintz for international markets; and the environmental impact of the global textile industry over time. With a focus on attire and home furnishings, the exhibition features 80 objects spanning 10 centuries and four continents. Religious and court banners for India, monumental gilded wall hangings for elite homes in Europe and Thailand, and luxury women’s dress for England showcase the versatility and far-reaching desire for Indian Chintz.

About Sarah Fee (Curator and Editor)

Dr. Sarah Fee is Senior Curator of Eastern Hemisphere fashion and textiles at the Royal Ontario Museum. She has degrees in Anthropology and African studies from Oxford University and the School of Oriental Studies, Paris, and in 2002, guest-curated an exhibition on Madagascar for the Smithsonian’s National Museum of African Art. Today, she continues to focus on Malagasy historic textiles and fashions, in addition to those of Zanzibar and Western India. A research associate at the Musée du Quai Branly, Paris, and the Indian Ocean World Centre at McGill University, Fee also teaches at the University of Toronto’s Department of Art. Fee is a past Board Member of the Textile Society of America, and currently sits on the editorial board of the Textile Museum Journal (TMJ).

About the Publication

Cloth that Changed the World: The Art and Fashion of Indian Chintz
Editor: Sarah Fee
Available at the ROM store starting December 2, 2019.
9 x 12, 272 pages, 300 colour illustrations.
$50.00.
Royal Ontario Museum and Yale University Press.

ROM SOCIAL MEDIA 

Join the Conversation: @ROMtoronto
Like: ROM Facebook
Watch: ROM YouTube

Sarah Fee
@aTextilesCurator

ABOUT THE ROM

Founded in 1914, the Royal Ontario Museum showcases art, culture and nature from around the world and across the ages. Among the top 10 cultural institutions in North America, Canada’s largest and most comprehensive museum is home to a world-class collection of 13 million art objects and natural history specimens, featured in 40 gallery and exhibition spaces. As the country’s preeminent field research institute and an international leader in new and original findings, the ROM plays a vital role in advancing our understanding of the artistic, cultural and natural world. Combining its original heritage architecture with the contemporary Daniel Libeskind-designed Michael Lee-Chin Crystal, the ROM serves as a national landmark, and a dynamic cultural destination in the heart of Toronto for all to enjoy.

ON NOW


It’s Alive! Classic Horror and Sci-Fi Art from the Kirk Hammett Collection
Gods in My Home: Chinese New Year with Ancestor Portraits and Deity Prints

COMING SOON


November 16, 2019 | Bloodsuckers: Legends to Leeches
March 7, 2020 | Egyptian Mummies: Exploring Ancient Lives


À L’AFFICHE


Sauve qui peut! L’art des grands films d’horreur et de science-fiction de la collection de Kirk Hammett
Accueillir les divinités : Portraits d’ancêtres et estampes de dieux pour le nouvel an chinois

À VENIR


Le 16 novembre 2019 | Soif de sang
Le 7 mars 2020 | Les momies égyptiennes : À la rencontre des Anciens

Why A College Of Kinesiology For Ontario?

FYI exercise is medicine image: www.hungry-runner.com

Toronto, Ontario  – The numbers are well-known – regular exercise can reduce the risk of heart disease by 40 per cent, lower the risk of stroke by 27 per cent, decrease the incidence of high blood pressure and diabetes by 50 per cent and lower the risk of colon cancer by 60 per cent.  Exercise has also been noted to reduce mortality and the risk of recurrent cancer by 50 per cent and to reduce the risk of developing Alzheimer’s by a third.

It is clear that the role of exercise and the profession of Kinesiology, as human movement professionals, will continue to grow.

“The creation of  the College of Kinesiology of Ontario set the stage for a significantly increased focus on the role of physical activity in both the prevention and a treatment of illness and chronic disease,” said Janice Ray, President of the Ontario Kinesiology Association.

But instead of being concerned with the single hour that clients and patients spend in the gym or rehab facility, many Kinesiologists are focusing on ways to help promote optimal health during the other 23 hours of the day as well.

Dr. Chris Ardern, a Kinesiology Professor at York University, and a Research Scientist at Southlake Regional Health Centre in Toronto, has spent his career focusing on obesity and physical activity and how they affect a number of other precursors to chronic disease.  Dr. Ardern has published or co-authored almost three dozen papers on obesity and physical activity.

Beyond the standard focus on leisure-time activity, says Dr. Ardern, more attention needs to be paid to curbing the sedentary time people spend at work or commuting. A focus on  daily routine from a more holistic point of view is required instead of just how much time is spent being “moderate-to-vigorously active” if we are to make a more significant impact on preventing obesity, chronic disease and other illnesses.

Like obesity, physical inactivity is now understood as a serious problem, says Dr. Ardern. He suggests that aggressive promotion of physical activity is vital to offseting the impact of obesity and chronic disease. For Kinesiologists who see the consequences of our current lifestyles every day, there is a sense of urgency to counter-act the relentless marketing surrounding foods high in fat and sugar, and the inactvie lifestyles that come from sitting in front of some kind of screen for hours on end.

“Every little bit helps,” says Ray, referring to every opportunity, nor matter how small, to get moving throughout the day.  “Modern lifestyles often don’t leave much time for dedicated physical activity, and too many if us aren’t even programmed to think about the little opportunities that can really make a difference.”

Here are some simple ideas to get you started:

·      Avoid elevators and escalators – take the stairs whenever possible (at least take them down if up is too much) ·      Park in the back corner of the shopping mall or workplace parking lot (spots are easier to find too) ·      Walk to the corner store (remember walking is a real mode of transportation) ·      You don’t have to be a smoker to get outside on your break, (go ahead, enjoy a breath of fresh air and move around) ·      Share a walk with your kids, spouse, significant other, sibblings, parents, friends etc. (it’s a great way to talk without having to look at each other, or just as good – not talk)

The important role of physical activity to reduce the risk of chronic disease are well documented.  Large and small efforts all combine to reduce the risks of many chronic diseases, and when combined with the benefits physical activity brings to the treatment and management of chronic disease and illness and the it becomes clear the Provincial Government should be including a greater focus on physical activity to improve outcomes for patients and improve the quality of life for the people of Ontario.

About Kinesiology
As authorities on movement and exercise, Kinesiologists are committed to enhancing quality of life through the promotion of physical activity and workplace safety, the prevention and management of injury and chronic disease, and the improvement of health and performance.

About the Ontario Kinesiology Association (OKA)
The Ontario Kinesiology Association (OKA) is the voice for Kinesiologists in Ontario. Actively working on behalf of its members, the OKA is dedicated to promoting Kinesiology as an integral part of Ontario’s healthcare team and raising the profile of the profession across the province. For the Silo, John Armstrong

Record Number Of Clean Beach Blue Flags Now Flying

Pinterest
More Canadian beaches and
marinas awarded Blue Flags

2018 is another record year for Canada’s waterfronts, 27 beaches and nine marinas have been awarded a coveted Blue Flag, including our very first coastal flag at beautiful Aboiteau Beach, NB. The Blue Flag is the internationally recognized symbol of environmental excellence for beaches and marinas. Read on to find the best waterside spots to spend your Victoria Day weekend.

Time for
the Government
to step up on
plastic waste
Only 11 per cent of Canada’s plastic waste is recycled.  Let that sink in for a minute.  This problem goes way beyond individual changes, we need the Federal Government to step up and take meaningful action before it’s too late. Sign the petition now to ask for a plastic free environment.
Banned chemicals found in products that babies chew, play and nap on A new study reveals that 86 per cent of tested products sold in Canada contain toxic chemicals, some of which are banned. Baby bibs, blankets and more were found to contain water and stain resistant chemicals linked to hormone disruption, and even cancer. Find out how you can take action.
Tell Canada that all high-carbon projects need an impact assessment What the frack?! The Canadian government is proposing to exempt fracking and in situ tar sands from the new federal environmental review process. We have until June 1st to fix this – send a letter now to tell the government that ALL high-carbon projects should get an impact assessment.

Chasing Ontario’s Tornados

Part One

I have seen many storms in my life. Most storms have caught me by surprise, so I had to learn very quickly to look further and understand that I am not capable of controlling the weather, to exercise the art of patience and to respect the fury of nature”

My name is Spencer Sills, and I am a storm chaser, some of you may remember a few years back reading about my good friend David Chapman and myself in this very newspaper and our journeys on the road to capture Nature’s fury through our lenses. Not much has changed since then, we are both still on the hunt for the elusive supercell and what fury may come with it.

In 2014 my overall goal to capture a tornado in Ontario was once again successful, on July 7th I teamed with Scott Burlovich of Restless Skies photography and his chase partner Harry for the day and we set out to capture some pulse storms that were flaring up in the afternoon, most of these cells were just rain makers but on the way back to my home I had noticed a wall cloud that was lit up by the sun, we pulled off to the side of the road directly South of Norwich and briefly documented a EF0 tornado in a farmers field before it lifted causing no damage since it was in a dry field. This was my only tornado of the year, in a busy season. I did however get to document several gorgeous storm cells throughout the year, including several beautiful stacked shelf clouds and a great Wall cloud early in the season that brought golf ball sized hail to the area.

A Wall cloud in SW Ontario approaches my location as the RFD cuts around with hail starting to fall.

In 2015 I hope to achieve a few goals, one of which is to capture yet another tornado in this province, hopefully just like 2014 in an open field away from any properties. I also have set my sights on some goals with lightning and capturing it in a different perspective, I can’t go into much detail but it will be a stunning sight if I can achieve it. As far as how I believe the season will go, I do believe it will be a slow start, April and May will bring the return of storms, but I don’t expect anything too severe until June and July once the humidity and warmth really have a chance to build in. I do however once again stress to leave chasing to the pros, if you’re interested in storm spotting, please look into Canwarn, the more spotters in the province the quicker warnings can be issued thanks to verified ground reports.

Lightning by Chapman

I will be working alongside another photographer and storm spotter this year, Scott Burlovich of Restless Skies, please feel free to check out his amazing work at restless-skies.com and give him a follow on twitter @restless_skies , you can also follow my journey for the year at Lightningfastphotography.com or on twitter @spencersills. I also want to send my best wishes to David Chapman for a great 2015, and as always look forward to meeting him in the field under the Meso, stay tuned for more updates and stay sky aware this summer!

Part Two

Another winter has come and gone, although perhaps slower than a lot of us would like. At least this means that the storm season is once again upon us in Ontario. As usual, Brian Chapman and I, a father and son chase team, will be back out on the roads looking for the best images of lightning and searching for Ontario’s tornadic super cells.

We will also be in close communication with our good friends and fellow chasers, Spencer Sills and Scott Burlovich, as we tend to share a lot of information about the biggest potential storms before we go chasing. You’ll notice when you look through their photography collections that they are a couple of the best for chasing down the biggest storms in our province.

You might be curious on what we do when it comes to chasing the actual storm. Brian’s job is to be the driver. This is his first priority. Once we are parked and in a safe but photographic position for the storm, he is our main videographer. As for myself, I choose where I think the biggest storm will form from looking at weather models that meteorologists use as well as talking to fellow storm chasers in the area. I am also the main photographer. I do some video work and navigate us to the most photogenic side of the storm. This is usually right next to the most dangerous part of the storm but still in the safest position possible.

Rapidly Rotating wall-cloud photo being documented by Brian Chapman)

In the past 2 years, our team has seen and recorded a number of funnel clouds, 2 confirmed tornadoes and 4 waterspouts. One of the tornadoes was near Arthur, Ontario on August 7, 2013 and the landspout tornado was near Listowel, Ontario on May 14th 2014. The Arthur tornado was a really great one to document. It lasted for close to 15 minutes and we were able to see it from start to finish. The best part about it was the fact that  no one was injured and it caused very little damage. Those are the kinds of tornadoes we love to see because they allow you to enjoy the pure power and beauty that they possess but without injuries or major destruction.

Tornado by Chapman

Another thing that was interesting with the tornado that hit near Arthur was the fact that it tried to form a second tornado at the same time the first one was on the ground. If that funnel had reached the ground, it would have been called a satellite tornado. They are typically smaller and weaker but not always. In Pilger, Nebraska in 2014, two EF-4’s were on the ground at the same time. Sadly they hit a town, killing 5 people and injuring 19. Those are the days I dread as a chaser and hope I never see first hand. As for the second funnel near Arthur, it didn’t quite have the energy to make it the rest of the way to the ground. This probably wasn’t such a bad thing with so many people focusing on the main, larger tornado just to its north.

A Funnel Cloud
A Funnel Cloud

Fortunately, a lot of Ontario’s tornadoes hit open areas that cause little to no damage. There have been some exceptions, as the tornadoes that hit both Durham, Ontario on August 20, 2009 and Goderich on August 21, 2011 showed, both killing one person in each of them. That is why many storm chasers as well as dedicated weather enthusiasts in our province have a direct line to Environment Canada that allows us to contact them when we see threatening weather approaching the area we are in. It can help Environment Canada confirm what they are seeing on radar so that they can issue the proper watches and warnings accordingly. Refer to Spencer Sills’ Part One above for more details on how you can become a spotter. Lightning will also be a big focus for our team this year. We continue to work to get lightning photos as close as possible in order to capture the positive leaders that come up to meet the main negative current coming down from the cloud. The leaders can come from the ground, hydro poles, houses and even people.

Although this may be risky and dangerous, we have worked out ways to minimize the risk to us. We stay in the car when lightning is close with the windows up. We also won’t park under a tree, not so much from the fear of a direct lightning strike but in case lightning hits and splits the tree causing it to fall on the vehicle. I remember seeing one like that when I was young and it has had an everlasting impression on me. One of the first big wind storms I chased along Lake Erie on November 1, 2013 knocked down a tree onto a woman‘s car and unfortunately she was in it and was killed. So debris is always a concern and something to be very aware of when it comes to storm chasing.

You can follow our storm chasing throughout the year on our social media pages. https://twitter.com/DTChapmanPics https://www.facebook.com/pages/David-T-Chapman/173134962767601?fref=ts https://twitter.com/WeatherHunters

Toby Barrett
~CLICK ME~


What Keeps The Mona Lisa Smiling?

This is the most famous painting in the history of art. It is titled the Mona Lisa but it’s original name was Monna Lisa- a short form of “Madonna” or “my lady” but thanks to a spelling error we know this work as the Mona Lisa. Painted by Leonardo Da Vinci in the years 1503-1507, there are actually three different versions painted beneath the visible version. In one hidden version (discovered using xrays) she is seen clutching the arms of a chair. image/info courtesy of prlog.org

Every year 8.5 million visitors see the renowned work of art that is the Mona Lisa. It is a vision that graces t-shirts, calendars, coffee mugs, and art history books worldwide. Still, among those millions, I would wager that few are those that have left Paris remarking on the wall on which Mona is placed. More on this later….

Did you know that the Mona Lisa is the only work of art to be stolen from the Louvre( in 1911) and recovered? Not only that, but in 1956, it was attacked with acid and, in that same year, cut open with a rock thrown at Mona’s elbow. It would seem that times haven’t changed much either. In 2009 a coffee mug was thrown at it by a gazing woman.

Art hygiene: the Mona Lisa is protected by bulletproof glass while on display at Paris’ Louvre photo: Gilli8888/flickr

Time has provided the foresight to maintain Mona’s beauty. With 2 centimeters of bullet proof glass and an inner casing protecting against heat and humidity the artwork seems safe. But what about the wall ‘holding’ the Mona for all of us to admire?

Take a look at these choppers…are they healthy enough to support a Mona Lisa smile? Pay attention because we’re about to switch gears and talk a little oral health.

As a dentist I am prone to notice the wall and that famous Mona Lisa smile. That smile, seen on TV and used in advertising everything from vacations to toothpaste, would be worth little without considering the healthy gums and bone that keep it in place. In other words, without noticing the wall. Years spent in my business have taught me, that if not protected properly, a smile can be stolen from us, chipped, and worn away with acid leading to very costly repairs. If you value your smile then the bullet proof glass is a worthy investment.

By focusing on in-office prevention and care the need for extensive intervention is often averted. It is more time and cost effective to put up and maintain a very impressive wall for your work of art than it is to meticulously rework the masterpiece. This analogy holds true for your teeth, gums and your smile. Maintenance is the greatest security from acid and coffee alike and with it, your smile can continue to break the ice… but I wouldn’t count on 8.5 million visitors. That may be a little more than any of us can chew. For the Silo by Dr. Peter Gunn. Dr. Gunn’s practice is in Port Rowan, Ontario. www.facebook.com/caredental

SupplementalNew Scientist article: Mona Lisa’s smile a mystery no more

Identify Toxic Cosmetics

What does the ingredients list above represent? It’s taken from the label of a popular name brand soap advertised with fresh faces, and as leaving no residue on the skin. Would it surprise you? Perhaps you recognized it, but thought well it’s being sold in stores so it must be safe.

The good news is that since 2006,  Canadians have been provided with mandatory labeling on personal care products. Health Canada has even gone a step further providing a “hotlist” or list of prohibited or restricted chemicals . This is a huge step above our neighbours to the south, whom currently have minimal regulation on personal care products. Canada is on the right track, but is still a few steps behind the European Union, where personal care products are held to stringent guidelines.

The bad news is that even though there are guidelines set of by Health Canada, some of the products on the market today still contain chemicals, with similar structures to those chemicals that have been restricted. And if something shares a similar structure it is likely to interact with the human body in a similar fashion, thus causing similar health concerns.

What at can you do? The good folks at the David Suzuki Foundation performed a Survey of Canadians and their use of personal care products, and from this developed a “dirty dozen” of chemicals to avoid. Results of their survey demonstrated that 80% of products contained at least one ingredient on the list, and only 20% did not contain any. By visiting the www.davidsuzuki.org and searching “What’s Inside? That Counts,” you can download your own copy of the list, or even visit the mobile site when you are out shopping.

Why does this all matter? Many of the chemicals that are found in personal care products can bio-accumulate, meaning they can increase in concentration over time, and be passed on to our next generations. There is also well documented evidence of effects within the human body caused chemicals affecting the endocrine system. Within the human body endocrine disruptors have been implicated in neurological diseases, reproductive disorders, thyroid dysfunction, immune and metabolic disorders. Cancer is also another health concern that has been linked to many of the chemicals found in personal care products.

What about my health? As a naturopathic doctor I am always thinking from a preventative medicine point of view. The more I learn, I continue to look for natural/chemical free personal care products. Also important is optimizing your body’s innate ability to remove build up of chemicals through organs such as liver, skin, and kidneys. As always, prevention is the best medicine, and becoming a savvy consumer involves reading labels and asking questions. For the Silo, Ashley Beeton Bsc. ND. 

Ontario Gets Highest Grade Ever For Red Tape Reduction

SIMCOE — Ontario received the province’s highest grade ever in an annual report card that evaluates governments across Canada based on their progress in cutting red tape.

The Canadian Federation of Independent Business (CFIB) gave Ontario an A- in its 2019 Red Tape Report Card. This was a dramatic increase from the C+ that the previous government received in 2018 — which was tied for Ontario’s lowest grade ever. The jump from the province’s lowest to its highest grade ever is a result of the new government’s determination to cut the cost of doing business in Ontario and make companies more competitive.

“The last thing small business needs in Ontario is continued unnecessary, bureaucratic, regulation, rules, paperwork and red tape,” said Haldimand-Norfolk MPP Toby Barrett.

“I am proud that CFIB has recognized we mean business when it comes to cutting red tape,” said Todd Smith, Minister of Economic Development, Job Creation and Trade, who is the lead minister on reducing red tape and regulatory burden. “Ontario businesses face the highest cost to comply with regulations in any province — about $33,000 per company — and small businesses are being hit the hardest. Lowering the cost of doing business here will make companies more competitive so they can create and keep good jobs right here in Ontario. And we won’t stop until we get the job done.”

People across the government are rolling up their sleeves to lighten the regulatory burden on businesses, and Ontario will take this work to the next level this spring. Ministries are already pitching in with ideas for new actions to help meet an aggressive target – reducing regulatory red tape affecting businesses by 25 per cent. From the Premier on down, the government is continuously looking for ways to lower business costs to help create and protect good jobs for the people of Ontario.

QUICK FACTS

  • CFIB is a non-profit organization representing and advocating for the interests and concerns of more than 110,000 Canadian owners of small and mid-sized businesses.
  • It has published an annual Red Tape Report Card since 2011. CFIB says its goal is to hold the federal, provincial and territorial governments accountable for one of the biggest headaches for small businesses — excessive regulations.

QUOTES

“We’re committed to reducing red tape and easing regulatory burden for our businesses, so they can grow, create jobs and compete on a global level,” said Ernie Hardeman, Ontario Minister of Agriculture, Food and Rural Affairs. “I was so pleased to see the CFIB award Ontario its highest grade on their Red Tape Report Card. We’ll continue earning top marks by further lowering the costs of doing business in our province.” – Ernie Hardeman, Oxford MPP and Minister of Agriculture, Food and Rural Affairs

“Speaking to just about everyone in all sectors, red-tape is one of the single biggest hurdles community agencies and small businesses face in serving our region. It’s so great to see CFIB recognize the great work we are doing to make Ontario open for business.” – Will Bouma, Brantford-Brant

“This is great news for our province. Receiving this grade shows that our government is on the right track to creating an environment in Ontario where businesses will want to come and create jobs” – Toby Barrett, Haldimand-Norfolk MPP

ADDITIONAL RESOURCES

Statement by Minister Smith on the Passage of the Making Ontario Open for Business Act

Ontario’s Government for the People Cutting Red Tape to Help Create Jobs

Ontario Open for Business

Winds Of Change Bring New Environmental Reality

The Ontario government is taking action to address issues of climate change.  Once in office, we have been acting as quickly as possible to fulfill our commitment to Ontario families and businesses.  For example, we revoked the cap-and-trade carbon tax and ended emissions trading and allowances. In addition, we have now released our Made-in-Ontario Environment Plan that takes concrete steps to protect our air, water, and land and fight climate change.

Climate change is here.  It is a reality and our environmental legacy will be predicated on our capacity to adapt, and to stop the worst consequences from materializing.

Fortunately, another reality is the fact the Ontario government is committed to protecting the environment using a sensible and balanced approach that creates jobs, respects taxpayers and grows the economy. But it is important to discuss what we’re fighting…the actual impact climate change can have on all of us.

Our government understands that climate change is a reality. It is a serious, worldwide problem.

More frequently, we hear media reports of severe weather that results in flooded basements, structural damages, and costly cleanups—sometimes in our own backyard. And the insured losses we’ve incurred in Ontario during 2018 give an unnerving snapshot of the consequences.

Earlier this year, a storm caused more than $46 million of insured damage in Brantford, Cambridge, London and the GTA. A spring storm in southern Ontario resulted in almost $80 million in costs. Soon after, winds and rains hit Hamilton and the GTA and caused over $500 million in damage. Last summer, a rainstorm in Toronto caused $80 million in damage. Further, we can’t forget the destruction left in the path of the Ottawa tornadoes this September.

The people across Haldimand-Norfolk are close to the land and are among the first to notice changes in the weather and the attendant damage and costs extreme weather can inflict on crops and buildings.  Farmers and those that work outdoors have long been aware of fluctuating temperatures and are taking note when scientists predict that the average annual temperature in Ontario could be increasing significantly.

Prediction Ontario Rising TemperaturesMilder winters and hotter summers create a paradise for insect and plant diseases. Are you getting more tick and mosquito bites? Lyme disease and West Nile virus, and other mosquito and tick-borne diseases, have been moving northward as our part of the world warms.  And with increasing temperatures and phosphorus loads, many have taken notice of Lake Erie’s more frequent algal blooms and accelerated aquatic plant growth.

These aren’t news items from a far-off land.  These events effect our health, increase food costs, hurt our communities, and can mean large repair bills and higher insurance premiums.

In a subsequent column, I’ll discuss our Made-in-Ontario Environment Plan and how it’s constructed to meet the needs of Ontarians by protecting and conserving our air, land and water; fighting litter and waste; building resilience to the impacts of climate change—particularly extreme weather—and illustrating ways for all of us to do our part to decelerate climate change by reducing greenhouse gas emissions.

As one with a background in agriculture and the outdoors, I’m excited about our environment plan. It draws on the expertise of environmentalists, scientists, stakeholders, Indigenous people, and the general public—more than 8,000 ideas and recommendations were received through our online portal.   But more on that in a future column. For the Silo, Toby Barrett.

Leave Your Art Behind For Others To Carry Forward

Random acts of kindness come in all shapes and sizes, something as simple as a smile to a stranger, or paying for the guy behind you in the cue at the coffee shop drive-thru counts. The idea is to leave someone, whether you know them or not, with a brightened day and a reminder that there are good people. There is an amazing movement happening in the artistic circles, created with the same purpose, it is called art abandonment and artists from all over are leaving behind their artworks anonymously.


All photos except for Iliad courtesy of the author. Iliad photo: J. Barker

Michael deMeng is credited as starting the Facebook Group, Art Abandonment  ttps://www.facebook.com/groups/ArtAbandonment/ , although he says the group created itself.

“It’s something that I’ve done for a number of years now, albeit infrequently, usually on beverage napkins and the like,” says deMeng in an introduction to Art Abandonment on his blog. “About ten or so years ago I would walk to the same place by a river and leave a little charcoal drawing. So recently I started this activity up again…leaving little sketches with a note on the back”

deMeng acknowledged that he did not create the idea of art abandonment, but perhaps discovered its use as a random act of kindness as opposed to a political message used by many urban guerilla artists.

In fact, Haldimand-Norfolk  artist Jarrod Barker created several guerilla art installations in Haldimand-Norfolk including one at Simcoe’s now demolished American Can property back in the summer of 2010.

 Barker’s piece titled Iliad features an amoebic-like form that pays homage to the shields of the Trojan War, where an art piece in the form of a wooden horse was abandoned at the gates of Troy. The amoeba-like form lends reference to the “sleeping soldiers” within homemade preserves known as amoebic dysentery which was a serious cause of food related death prior to the canning industry boom. LW
ILIAD. J. Barker. Abandoned canned food factory Norfolk, Ontario.

deMeng outlined some of his theories behind the art of abandoning art and its purpose, including that its good for the heart and a little addictive once you begin and the simple fact that money is tight and giving a gift like this could encourage someone to continue to support the arts.

“I think it’s important to be able to let one’s art live beyond it’s creator, I love imagining what becomes of my art after it is gone…whether given or sold,” said deMeng.


“Some folks can’t seem to let go of their work, even when they sell it. This is a great way to learn to move on.”

The concept is very simple: 

1) Create a piece of art.

2) Write or attach a note explaining it is a free gift, purposely left behind including contact information if you so wish.

3) Take a photo of your art and its place of abandonment and then sneak away unnoticed.

abandonment 3 I myself am not an art abandoner, although if I had the time and resources I would, but I thought I could offer a unique opportunity for the abandoners I find so much joy in following on social media.

June 30, 2013 I will have departed to Peru for a ten day journey across a wide variety of landscapes including urban centers, Machu Picchu, and the Amazon rainforest.

I invited artists to send me their work in order to abandon on my journey, and I would share the photos of their abandonment locations with the artists as I continue my journey.

abandonment 2

“Machu Picchu is on my bucket list,” said Burlington artist Heather Kuzyk who sent three art trading cards (atc) to be abandoned.

“So if I never perchance to make it there in body at least a part of my soul has been. ”I was excited by the thought of the photos I could take of the abandoned art on the Machu Picchu ruins with the beautiful Peruvian mountains sprawling in the background. Although I sincerely hope some of the finders will share of their discovery, I’m pleased just to imagine how excited I would be if I found something like that in such a magical place. For The Silo, Lacie Williamson.

Post-script: Remember to never install or leave behind work that contains string, toxic or synthetic materials, small pieces of plastic etc. Anything that can harm or interfere with the natural environment or wildlife must never be used.

Why Toronto Will Have 25 City Councilors Instead Of 47

The Province of Ontario boasts 444 municipalities, including the City of Toronto, which provide critical services for people in Ontario.

On August 14, as an elected representative, I voted in favor of Bill 5 – Better Local Government Act.  Our goal as government was clear then, and we remain committed to that same goal today: to have Toronto, which is Ontario’s largest municipality and a major economic engine for both the province and the country, move away from a dysfunctional council system, a broken system that has difficulty with decision-making, a broken system that gets very little done.

Toronto residents deserve an efficient council that gets things done on big issues like transit, infrastructure and housing.

Having 47 Toronto councilors in one room is dysfunctional. For example, after days of debate at the committee level, city council took 15 hours to pass its 2017 budget – 15 hours of going back and forth and back and forth on a document that was already nearly set in stone, 15 hours to express opinions expressed numerous times before on the record. And after all that, council passed a budget that created a $2-million budget hole that meant it had to hastily draw from a reserve fund.

Over a month ago, we passed Bill 5 as an answer to the unacceptable public policy stalemates at Toronto city hall. However, due to a ruling by a Superior Court of Justice, we made a decision to replace Bill 5 with new legislation. However, on September 19, we received news the Ontario Court of Appeal concluded, “…there is a strong likelihood that the application judge erred in law and that the attorney general’s appeal to this court will succeed.” The court of appeal’s tentative conclusion was that, “Bill 5 does not suffer from constitutional infirmity.”

Read Court Document- Ontario Appeal Court Sides With Ford Government

Our government concurs with the Stay, which goes on to recognize the change voted in by Bill 5 is undoubtedly frustrating for candidates who are campaigning in 25-ward boundaries. However, the frustration is not enough to persuade that there is substantial interference with their freedom of expression.

The inconvenience candidates will experience because of the change from 47 to 25 wards does not prevent or impede them from speaking their mind about the issues arising in the election. The Stay indicates candidates have no constitutionally guaranteed right to the 47-ward system, and Bill 5 does not deprive them of their constitutional right to speak on civic issues.

Over the summer, there has been much debate and many views expressed, including many former politicians. Christy Clark, the former Premier of British Columbia, has expressed support for our legislation. She said people all across Canada, not just in Toronto, are wondering why governments can’t move things faster.

Former Premier of Saskatchewan Brad Wall understands why we need to act and to be able to use the legal tools that are available to us.

Similarly, Former Premier of Quebec Jean Charest pointed out that the political gridlock and dysfunction at Toronto city hall is known far and wide.

With the date of the municipal election rapidly approaching, we need to take action – October 22 is just a few weeks away – to provide greater certainty for everyone and to ensure the election in Toronto proceeds. For the Silo, Haldimand-Norfolk MPP Toby Barrett.


Pull On Blundstone Boots Style Every Season

Blundstone wearers are devoted- its not that unusual for the artist types to even sketch their beloved, worked-in Blunds.... sketch: Richard McLean image: redbubble.com
Blundstone wearers are devoted- its not that unusual for the artist types to even sketch their beloved, worked-in Blunds…. sketch: Richard McLean image: redbubble.com

A pair of Blundstone boots has a way of replacing a big chunk of your everyday footwear. Not only because Blundstone boots are so functional, but also because these are boots you want to wear every day. The two-tone styles aim to appeal to those who like a bit more colour in their fashion choices. Blundstone’s two-tone styles give you the same fantastic quality in a more colourful package.

“In the past, we’ve played it safe with neutral colours like Classic Black, Steel Grey and Rustic Brown,” says Ian Heaps of Blundstone Footwear. “The two-tone boots are perfect for those who want the same great quality, durability and functionality of the classic Blundstone boot, but with a little extra edge and a pop of colour.”

Blundstone Canada CEO Mr. Ian Heaps


Blundstones are widely recognized for their practicality and adaptability as footwear, but they are also an extremely versatile fashion accessory. All styles are unisex, and the sleek look of the boots make them compatible with anything from jeans or shorts, to slacks and even skirts. The two-tones styles are available in women’s 6 to men’s 14 sizes.


#1319 Rustic Brown with two tone sole from Blundstone Boots Fall line.


....and the devilishly stylish #1316 Red and Black with two tone sole.
….and the devilishly stylish #1316 Red and Black with two tone sole.


About Blundstone

Blundstones have been available in Canada since 1993 at Australian Boot Company and other retailers, and now sold at over 600 locations across Canada.  Tin Shack is the exclusive Canadian distributor of Blundstone, located in Collingwood, Ontario.  Founded in Vancouver in 1998, Tin Shack distributes footwear made by Blundstone, Pty, of Tasmania, Australia.  Founded in 1870, Blundstone is Australia’s leading manufacturer of quality footwear and remains a family-owned company to this day.  Blundstones have been toughing it out for no-nonsense, go-anywhere, do-anything types seeking comfort, durability and rugged style.  Boasting pull-on comfort, Blundstones are all-weather, lightweight, durable and no-gimmick footwear.  For more information, visit www.blundstone.ca.


Rankings Of One Day Cost At Over 300 Beaches Worldwide

Amsterdam, Netherlands,Online travel specialists, TravelBird, have released their annual Beach Price Index, featuring more than 300 seaside locations from 70 countries around the globe. On a year-to-year basis, the price of holiday beaches can change substantially when you take into account factors such as currency fluctuation and inflation. As a company which prides itself on inspiring travelers, TravelBird ranked the beaches in order to provide holidaymakers with the information they need to make a smart decision when booking.

TravelBird first examined an extensive catalogue of the world’s most popular beaches, before reducing this to a final shortlist of just over 300 locations, ranked on the cost of spending a day at each. To calculate their affordability, the price of five essentials were then researched for each destination: the cost of a bottle of sun cream (200 ml), a bottle of water (500 ml), a beer (33 cl bottle), lunch (including drink and dessert for one person), and an ice cream. The sum of these five essentials determined the final affordability ranking of each seaside location. All prices were calculated by standardizing the sizes of products, and with monetary transactions true to exchange rates on 1st June 2017.

Steve Klooster

“It is very interesting for travelers who are planning their trip to see how much the price of spending a day at the beach varies across the world. There are many useful tips in here. One to easily forget, currency fluctuations can make a big difference in the actual cost of your holiday, so keep those in mind. For example, beaches in the UK have become almost 10% more affordable for continental European visitors due to the decline of the pound after the Brexit referendum.” Said TravelBird CEO Steven Klooster. “Also, if you are keen on enjoying local food on the beach, pick Vietnam for instance, where you can enjoy delicious local food on the beach that is very affordable. Another one: in some places you pay a lot for sunscreen, up to 3 times more than you would pay in The Netherlands, so make sure you take some with you!“

The study reveals the 10 most expensive beaches are:

#

Beach

Country

Sunscreen

Water

Beer

Ice-cream

Lunch

Total (USD)

1

Kristiansand Beach

Norway

$21.58

$2.65

$8.48

$4.53

$27.37

$64.61

2

Huk Beach

Norway

$20.67

$2.97

$8.83

$5.09

$24.38

$61.94

3

Solastranda

Norway

$20.14

$2.83

$7.63

$4.71

$25.02

$60.33

4

Mareto Plage Publique

French Polynesia

$21.96

$2.01

$7.30

$3.99

$23.43

$58.69

5

La Plage de Maui

French Polynesia

$20.88

$2.01

$7.49

$3.53

$24.49

$58.40

6

Åkrasanden

Norway

$22.26

$2.57

$8.47

$4.24

$20.44

$57.98

7

Hamresanden

Norway

$22.97

$2.39

$7.42

$4.35

$20.01

$57.14

8

Ribersborg Beach

Sweden

$17.38

$2.12

$6.79

$3.31

$25.73

$55.33

9

Anse Vata

New Caledonia

$15.33

$1.82

$7.42

$2.28

$28.29

$55.14

10

Anse Georgette

Seychelles

$26.63

$0.94

$6.89

$1.24

$17.66

$53.36

Most expensive beach according to study- Kristiansand Beach, Norway. image: kristiansand.norway.com

In contrast, the study reveals the 10 most affordable beaches are:

#

Beach

Country

Sunscreen

Water

Beer

Ice-cream

Lunch

Total (USD)

310

Cua Dai Beach

Vietnam

$1.95

$0.50

$2.04

$0.88

$7.81

$13.18

309

City Beach

Vietnam

$2.32

$0.33

$2.14

$0.88

$8.23

$13.90

308

Long Beach

Vietnam

$2.57

$0.43

$2.09

$0.99

$8.34

$14.42

307

Marsa Nayzak

Egypt

$6.61

$0.21

$1.96

$0.83

$6.83

$16.44

306

Sunken City

Egypt

$7.12

$0.20

$2.02

$0.84

$6.64

$16.82

305

Varkala Beach

India

$3.98

$0.37

$3.32

$0.73

$9.21

$17.61

304

Benaulim Beach

India

$4.65

$0.31

$3.20

$0.61

$9.15

$17.92

303

Palolem Beach

India

$4.65

$0.24

$3.13

$0.67

$9.52

$18.21

302

Cavelossim Beach

India

$4.65

$0.37

$3.41

$0.83

$9.15

$18.41

301

Sharm El-Naga Bay

Egypt

$7.12

$0.21

$1.96

$0.84

$8.44

$18.57

Most affordable beach according to study- Cua Dai Beach, Vietnam. image: vietnamguidenews.com

Click here for the full results: https://travelbird.nl/beach-price-index-2017/

4 Canadian beaches appear in the Index, with the following results:

#

Beach

Region

Sunscreen

Water

Beer

Ice-cream

Lunch

Total (USD)

118

Grand Beach

Manitoba

$9.15

$1.61

$3.59

$2.89

$20.90

$38.14

121

Brady’s Beach

British Columbia

$9.28

$1.74

$3.65

$3.00

$20.00

$37.67

136

Wasaga Beach

Ontario

$9.15

$1.70

$3.59

$3.38

$19.08

$36.90

149

Parlee Beach

New Brunswick

$8.87

$1.66

$3.57

$2.95

$18.87

$35.92

Grand Beach, Manitoba. image: travelmanitoba.com

Other findings from the study include:

Sun cream is most expensive when bought from beaches in The Seychelles, costing $26.63 for a 200ml bottle. In comparison, Cua Dai Beach in Vietnam has the world’s least expensive sun cream, costing just $1.95 per bottle.

The seaside location with the most expensive bottle of water is Huk Beach in Norway, costing $2.97 for a 500ml bottle. The beach with the least expensive bottle of water is Sunken City in Egypt, where the same sized bottle costs just $0.20.

The beach with the most expensive beer globally is Huk Beach in Norway, where a 33cl bottle costs $8.83. In contrast, Soma Bay in Egypt is the seaside destination with the least expensive beer, available for just $0.63.

Norway’s Huk Beach also has the world’s most expensive ice creams, at $5.09 each. Egypt’s El Gouna is the beach with the least expensive ice creams in the world, costing just $0.52.

West Palm Beach in the American state of Florida has the world’s most expensive seaside lunch, costing $28.61 for one person. Egypt’s El Gouna is the beach with the most affordable lunches, available for just $5.63.

About our friends at TravelBird: TravelBird is an online travel company offering a curated collection of holiday and travel experiences – from short inspirational breaks to international get-aways. TravelBird’s passionate local travel advisors work directly with tour operators across the world to offer a selection of travel experiences that invite travellers to discover something new and immerse themselves in different cultures. For more information, please visit: https://travelbird.nl

Methodology:

The study has 310 of the most visited beaches in 70 countries based on local tourism board numbers and data from the UNWTO.  

Total Price = $ Sunscreen + $ Water + $ Beer + $ Ice-cream +$ Lunch

Sunscreen costs calculated by taking an average cost from a store in local resort/hotel, a hostel and local pharmacy or supermarket (all where available). We searched for SPF 30, 200 ml.

Lunch costs calculated by taking full meal cost, including a drink and dessert, for one person from a walking distance of maximum 10 minutes from the beach or the closest establishments to it (largely within tourist areas), outlets include hotels and restaurants.

Beer costs were calculated by taking an average of the biggest local beer brand along with the retail cost of Heineken, Budweiser, Becks, Guinness and Fosters at local prices, where available. Where sizes were not available, calculations were undertaken to make serving sizes equal.

Water calculations were found by taking the three largest local brands and calculating an average of these.

Ice-cream costs calculated by taking an average prepackaged branded ice-cream price in the capital city of each country and applying consumer produce cost differences to each area, where applicable.  For the Silo, Ricky Sutton.

Featured image- Wasaga Beach, Ontario courtesy of expedia.com