Tag Archives: marijuana

(Mostly) All You Need To Know About The Marijuana Market

With legal ‘weed’ readily available from licensed dispensaries in Canada, more states to the South of us are legalizing marijuana for use in America and as such, the demand is increasing.

A good example is Colorado.

The state opened the first regulated recreational marijuana market in the world. A 2014 study also showed that 30% of the heaviest “pot” users in Colorado were responsible for 87% of the demand for the drug. Judging from these stats, we can see that the demand for marijuana is steadily rising as it is becoming accepted and legalized in more places around the world.
The marijuana market is getting bigger by the day as Americans spend roughly $40 USD billion annually on legal and illegal marijuana. There is so much more to these impressive figures and the rest of this article and info-graphic will discuss these factors. Let’s dive in, shall we?


Legalization

Typically, only two countries in the world allow the recreational use of marijuana – Uruguay and Canada. Although marijuana is still illegal under federal law in the United States, there are state laws that make it legal to consume under certain conditions. Marijuana is legal in 12 states for recreational use, and in 33 states for medical use. In the states where marijuana is legalized for medical use, there are licensed dispensaries that distribute it. These states restrict the number of dispensaries and they are usually non-profits. If we take into consideration the fact that the majority of Americans (62%) support legalizing marijuana, we can surely expect even more states to adopt new marijuana-friendly laws. As the public learns more about proven marijuana benefits, the support increases.


Sales and Demand

The rising demand for marijuana keeps driving it to record high sales as 55 million people use marijuana regularly. Studies show that by the end of 2022, recreational marijuana sales in the U.S are projected to more than triple.
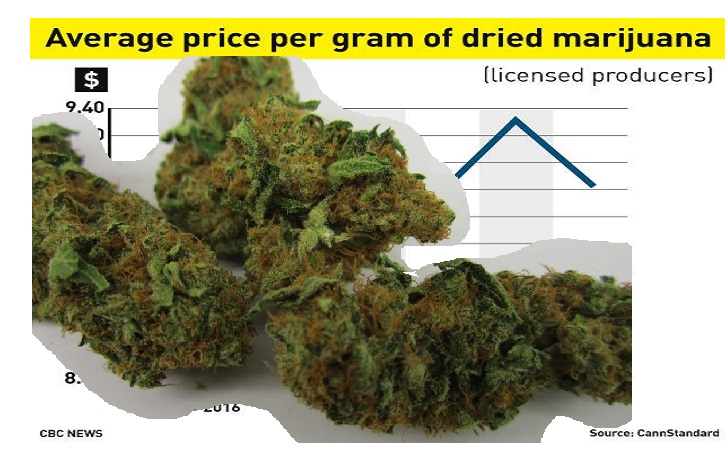
The average price per ounce of marijuana differs in the U.S by state and it may vary greatly. For example, the District of Columbia has the highest price at $600.7 USD per ounce while Oregon’s price is $210.6 USD for the same quantity. Also, research shows that the cannabis market is projected to grow at a rate of 21% per year.

Employment

With the escalating demand, there is a corresponding rise in the need for greater production, and the industry provides jobs and opportunities for investments. People with degrees in pharmacology, botany, and chemistry can be very beneficial in the industry. As for the salaries, the starting pay is $40,000 for growers and pharmacologists.
The three factors above paint a clear picture of the state of the marijuana market. It is very lucrative and expected to keep thriving.

Cost Of Marijuana In 120 Cities And How Much Tax Revenue If Legalized

First a few quick facts….

‏Tokyo, Japan has the most expensive cannabis‏ ‏, at 32.66 USD per gram. ‏

‏Quito, Ecuador has the least expensive marijuana‏ ‏, at 1.34 USD per gram.‏

‏Based on the average US marijuana tax rates currently implemented, ‏ ‏New York City could generate the highest potential tax revenue by legalizing weed‏ ‏, with 156.40 million USD per year. New York City also has the highest consumption rate of cannabis, at 77.44 metric tons per year.‏

‏Cannabis costs ‏ ‏$7.82 per gram in Toronto, Canada‏ ‏. ‏

‏Berlin, Germany – ‏ ‏Automatic cultivator device, ‏ ‏Seedo‏ ‏, after much research and data gathering, previously released the 2018 Cannabis Price Index, detailing the cost of marijuana in 120 global cities. Seedo is one of the many new ventures embracing the newly legalized cannabis industry. Their main goal is to allow both medicinal and recreational consumers to grow their own supply, avoiding extra taxes and bypassing harmful pesticides. The aim of this study is to illustrate the continuous need for legislative reform on cannabis use around the world, and to determine if there are any lessons to be learned from those cities at the forefront of marijuana legalisation.

‏Although Seedo’s technology enables smokers to get off the grid, this study considers one of the biggest byproducts of legalising cannabis—the potential tax revenue for the local government body. For this reason, Seedo decided not only to research the cost of cannabis around the world, but also to calculate how much potential tax a city could generate if they were to legalise marijuana. ‏

‏The study began first by selecting 120 cities across the world, including locations where cannabis is currently legal, illegal and partially legal, and where marijuana consumption data is available. Then, they looked into the price of weed per gram in each city. To calculate how much potential tax a city could make by legalising weed, Seedo investigated how much tax is paid on the most popular brand of cigarettes, as this offers the closest comparison. They then looked at what percentage marijuana is currently taxed in cities where it’s already legalised in the US. ‏

‏“This study has revealed some incredible insights into the kind of tax revenue that legalising weed could generate.” says Uri Zeevi, CMO at Seedo. “Take New York City for instance, which has the highest consumption level in the study at 77.44 metric tons of cannabis per year. If they taxed marijuana at the average US cannabis tax level, the city could make $‏ ‏156.4‏ ‏ million in potential tax revenue per year. This is equivalent to providing nearly 3 months worth of free school meals to every single public school kid in New York City.” ‏

‏The table below reveals a sample of the results for ‏ ‏Toronto, Canada‏ ‏:‏

‏City‏

‏Legality‏

‏Price per gram, US$‏

‏Total possible tax collection, if taxed at cigarette level, mil US$‏

‏Total possible tax collection, if taxed at average US marijuana taxes, mil US$‏

‏Total consumption in metric tons‏

‏Toronto‏

‏Partial‏

‏7.82‏

‏124.15‏

‏33.38‏

‏22.75‏

‏The table below shows the ‏ ‏top 10 most and least expensive cities for cannabis‏ ‏:‏

‏Top 10 Most Expensive Cities‏

‏Top 10 Least Expensive Cities‏

‏#‏

‏City‏

‏Country‏

‏Legality‏

‏Price per gram, US$‏

‏#‏

‏City‏

‏Country‏

‏Legality‏

‏Price per gram, US$‏

‏1‏

‏Tokyo‏

‏Japan‏

‏Illegal‏

‏32.66‏

‏1‏

‏Quito‏

‏Ecuador‏

‏Partial‏

‏1.34‏

‏2‏

‏Seoul‏

‏South Korea‏

‏Illegal‏

‏32.44‏

‏2‏

‏Bogota‏

‏Colombia‏

‏Partial‏

‏2.20‏

‏3‏

‏Kyoto‏

‏Japan‏

‏Illegal‏

‏29.65‏

‏3‏

‏Asuncion‏

‏Paraguay‏

‏Partial‏

‏2.22‏

‏4‏

‏Hong Kong‏

‏China‏

‏Illegal‏

‏27.48‏

‏4‏

‏Jakarta‏

‏Indonesia‏

‏Illegal‏

‏3.79‏

‏5‏

‏Bangkok‏

‏Thailand‏

‏Partial‏

‏24.81‏

‏5‏

‏Panama City‏

‏Panama‏

‏Illegal‏

‏3.85‏

‏6‏

‏Dublin‏

‏Ireland‏

‏Illegal‏

‏21.63‏

‏6‏

‏Johannesburg‏

‏South Africa‏

‏Illegal‏

‏4.01‏

‏7‏

‏Tallinn‏

‏Estonia‏

‏Partial‏

‏20.98‏

‏7‏

‏Montevideo‏

‏Uruguay‏

‏Legal‏

‏4.15‏

‏8‏

‏Shanghai‏

‏China‏

‏Illegal‏

‏20.82‏

‏8‏

‏Astana‏

‏Kazakhstan‏

‏Illegal‏

‏4.22‏

‏9‏

‏Beijing‏

‏China‏

‏Illegal‏

‏20.52‏

‏9‏

‏Antwerp‏

‏Belgium‏

‏Partial‏

‏4.29‏

‏10‏

‏Oslo‏

‏Norway‏

‏Partial‏

‏19.14‏

‏10‏

‏New Delhi‏

‏India‏

‏Partial‏

‏4.38‏

‏N.B. These tables are a sample of the full results. To find the complete results for all 120 cities, please see the bottom of the press release. ‏

‏The table below shows the ‏ ‏top 10 cities who could generate the most potential tax ‏ ‏by legalising cannabis, if taxed at the same rate as the most popular cigarette brand:‏

‏#‏

‏City‏

‏Country‏

‏Legality‏

‏Price per gram, US$‏

‏% of cigarette tax‏

‏Possible tax revenue, mil US$ ‏

‏1‏

‏Cairo‏

‏Egypt‏

‏Illegal‏

‏16.15‏

‏73.13‏

‏384.87‏

‏2‏

‏New York‏

‏USA‏

‏Partial‏

‏10.76‏

‏42.54‏

‏354.48‏

‏3‏

‏London‏

‏UK‏

‏Illegal‏

‏9.20‏

‏82.16‏

‏237.35‏

‏4‏

‏Sydney‏

‏Australia‏

‏Partial‏

‏10.79‏

‏56.76‏

‏138.36‏

‏5‏

‏Karachi‏

‏Pakistan‏

‏Illegal‏

‏5.32‏

‏60.7‏

‏135.48‏

‏6‏

‏Melbourne‏

‏Australia‏

‏Partial‏

‏10.84‏

‏56.76‏

‏132.75‏

‏7‏

‏Moscow‏

‏Russia‏

‏Partial‏

‏11.84‏

‏47.63‏

‏128.97‏

‏8‏

‏Toronto‏

‏Canada‏

‏Partial‏

‏7.82‏

‏69.8‏

‏124.15‏

‏9‏

‏Chicago‏

‏USA‏

‏Partial‏

‏11.46‏

‏42.54‏

‏119.61‏

‏10‏

‏Berlin‏

‏Germany‏

‏Partial‏

‏13.53‏

‏72.9‏

‏114.77‏

‏N.B. % of cigarette tax refers to the tax percentage on the most popular brand. Possible tax revenue refers to the total possible tax collection per year, if taxed at cigarette level. For a full explanation of how the study was conducted, please see the methodology at the bottom of the press release. ‏

‏The table below shows the ‏ ‏top 10 cities who could generate the most potential tax‏ ‏ by legalising cannabis, if taxed at the average US marijuana tax rate:‏

‏#‏

‏City‏

‏Country‏

‏Legality‏

‏Price per gram, US$‏

‏Possible tax revenue, mil US$‏

‏1‏

‏New York‏

‏USA‏

‏Partial‏

‏10.76‏

‏156.4‏

‏2‏

‏Cairo‏

‏Egypt‏

‏Illegal‏

‏16.15‏

‏98.78‏

‏3‏

‏London‏

‏UK‏

‏Illegal‏

‏9.20‏

‏54.22‏

‏4‏

‏Chicago‏

‏USA‏

‏Partial‏

‏11.46‏

‏52.77‏

‏5‏

‏Moscow‏

‏Russia‏

‏Partial‏

‏11.84‏

‏50.82‏

‏6‏

‏Sydney‏

‏Australia‏

‏Partial‏

‏10.79‏

‏45.75‏

‏7‏

‏Melbourne‏

‏Australia‏

‏Partial‏

‏10.84‏

‏43.9‏

‏8‏

‏Karachi‏

‏Pakistan‏

‏Illegal‏

‏5.32‏

‏41.89‏

‏9‏

‏Houston‏

‏USA‏

‏Partial‏

‏10.03‏

‏39.32‏

‏10‏

‏Toronto‏

‏Canada‏

‏Partial‏

‏7.82‏

‏33.38‏

‏N.B. Possible tax revenue refers to the total possible tax collection per year, if taxed at average US marijuana tax rate.‏

‏The table below shows the‏ ‏ top 10 cities with the highest and lowest consumption of cannabis, ‏ ‏per year:‏

‏Highest Consumers of Cannabis‏

‏ Lowest Consumers of Cannabis‏

‏#‏

‏City‏

‏Country‏

‏Legality‏

‏Price per gram, US$‏

‏Total consumption, metric tons‏

‏#‏

‏City‏

‏Country‏

‏Legality‏

‏Price per gram, US$‏

‏Total consumption, metric tons‏

‏1‏

‏New York‏

‏USA‏

‏Partial‏

‏10.76‏

‏77.44‏

‏1‏

‏Singapore‏

‏Singapore‏

‏Illegal‏

‏14.01‏

‏0.02‏

‏2‏

‏Karachi‏

‏Pakistan‏

‏Illegal‏

‏5.32‏

‏41.95‏

‏2‏

‏Santo Domingo‏

‏Dominican Rep.‏

‏Illegal‏

‏6.93‏

‏0.16‏

‏3‏

‏New Delhi‏

‏India‏

‏Partial‏

‏4.38‏

‏38.26‏

‏3‏

‏Kyoto‏

‏Japan‏

‏Illegal‏

‏29.65‏

‏0.24‏

‏4‏

‏Los Angeles‏

‏USA‏

‏Legal‏

‏8.14‏

‏36.06‏

‏4‏

‏Thessaloniki‏

‏Greece‏

‏Partial‏

‏13.49‏

‏0.29‏

‏5‏

‏Cairo‏

‏Egypt‏

‏Illegal‏

‏16.15‏

‏32.59‏

‏5‏

‏Luxembourg City‏

‏Luxembourg‏

‏Partial‏

‏7.26‏

‏0.32‏

‏6‏

‏Mumbai‏

‏India‏

‏Partial‏

‏4.57‏

‏32.38‏

‏6‏

‏Panama City‏

‏Panama‏

‏Illegal‏

‏3.85‏

‏0.37‏

‏7‏

‏London‏

‏UK‏

‏Illegal‏

‏9.20‏

‏31.4‏

‏7‏

‏Reykjavik‏

‏Iceland‏

‏Illegal‏

‏15.92‏

‏0.44‏

‏8‏

‏Chicago‏

‏USA‏

‏Partial‏

‏11.46‏

‏24.54‏

‏8‏

‏Asuncion‏

‏Paraguay‏

‏Partial‏

‏2.22‏

‏0.46‏

‏9‏

‏Moscow‏

‏Russia‏

‏Partial‏

‏11.84‏

‏22.87‏

‏9‏

‏Colombo‏

‏Sri Lanka‏

‏Illegal‏

‏9.12‏

‏0.59‏

‏10‏

‏Toronto‏

‏Canada‏

‏Partial‏

‏7.82‏

‏22.75‏

‏10‏

‏Manila‏

‏Philippines‏

‏Illegal‏

‏5.24‏

‏0.6‏

‏N.B. Total consumption is calculated per annum. ‏

‏Additional quotes:‏

‏“The way that the legalised cannabis industry is rapidly evolving alongside new technologies shows how innovative emerging tech companies are today.” says Uri Zeevi, CMO at Seedo. “Take the way that cannabis and cryptocurrency have joined forces, with ‏ ‏examples such as HempCoin or nezly, which manage processes and payments in the new marijuana industry.‏ ‏ When you consider too the potential that these new technologies have to disrupt the cannabis industry, there’s no denying that these are very exciting times.” ‏

‏“At Seedo, we’ve built technology that helps regular smokers to grow cannabis plants of the utmost quality from the comfort of their own home, avoiding pesticides and taking ownership of their personal supply.” says Uri Zeevi, CMO at Seedo. “We believe that by understanding the cost of weed around the world, we can help to educate smokers about the potential financial benefits of hydroponic growing technology.” ‏

‏“That illegal cannabis use is so high in countries that still carry the death penalty, such as Pakistan and Egypt, those in power ought to see how desperately new legislation is needed.” comments Uri Zeevi, CMO at Seedo. “By removing the criminal element from marijuana, governments will then able to more safely regulate production, take away power from underground gangs, and as we’ve shown in this study, generate huge tax revenues.”‏

‏Further findings:‏

‏New York City, USA has the highest consumption rate of cannabis‏ ‏, at 77.44 metric tons per year.‏

‏Boston, USA has the most expensive cannabis of all the cities where it’s legal‏ ‏, at 11.01 USD, while Montevideo, Uruguay has the least expensive at 4.15 USD. ‏

‏While Tokyo, Japan has the most expensive cannabis of all cities where it’s illegal, at 32.66 USD, ‏ ‏Jakarta, Indonesia has the least expensive at 3.79 USD, despite being classed as a Group 1 drug with harsh sentences such as life imprisonment and the death penalty.‏ ‏ ‏

‏For cities where cannabis is partially legal, Bangkok, Thailand has the most expensive at 24.81 USD, while Quito, Ecuador has the least expensive at 1.34 USD. ‏

‏Bulgaria has the highest tax rates for the most popular brand of cigarettes, at 82.65%, while Paraguay has the lowest, with rates of 16%. ‏

‏Cairo, Egypt would gain the most revenue in tax if they were to legalise cannabis‏ ‏ and tax it as the same rate as cigarettes, at 384.87 million USD. Singapore, Singapore would gain the least, at 0.14 million USD, due in part to the city’s low consumption of marijuana at 0.02 metric tons per annum.‏

‏Based on the average US marijuana tax rates currently implemented,‏ ‏ New York City could generate the highest potential tax revenue by legalising weed, with 156.4 million USD per year‏ ‏. Singapore, Singapore would gain the least, at 0.04 million USD

‏About “Seedo”‏ ‏: Seedo is a fully automated hydroponic growing device which lets you grow your own medicinal herbs and vegetables from the comfort of your own home. Seedo controls and monitors the growing process, from seed to plant, while providing optimal lab conditions to assure premium quality produce year-round. Seedo’s goal is to simplify the growing process, making it accessible for everyone, without compromising on quality. ‏

‏The full results of the 2018 Cannabis Price Index:‏

‏#‏

‏City‏

‏Country‏

‏Legality‏

‏Price per gram, US$‏

‏Taxes of cigarettes, % of the most sold brand‏

‏Total possible tax collection, if taxed at cigarette level, mil US$‏

‏Total possible tax collection, if taxed at average US marijuana taxes, mil US$‏

‏Total Consumption in metric tons‏

‏1‏

‏Tokyo‏

‏Japan‏

‏Illegal‏

‏32.66‏

‏64.36‏

‏32.14‏

‏9.37‏

‏1.53‏

‏2‏

‏Seoul‏

‏South Korea‏

‏Illegal‏

‏32.44‏

‏61.99‏

‏31.61‏

‏9.57‏

‏1.57‏

‏3‏

‏Kyoto‏

‏Japan‏

‏Illegal‏

‏29.65‏

‏64.36‏

‏4.64‏

‏1.35‏

‏0.24‏

‏4‏

‏Hong Kong‏

‏China‏

‏Illegal‏

‏27.48‏

‏44.43‏

‏19.72‏

‏8.33‏

‏1.62‏

‏5‏

‏Bangkok‏

‏Thailand‏

‏Partial‏

‏24.81‏

‏73.13‏

‏99.11‏

‏25.44‏

‏5.46‏

‏6‏

‏Dublin‏

‏Ireland‏

‏Illegal‏

‏21.63‏

‏77.80‏

‏29.31‏

‏7.07‏

‏1.74‏

‏7‏

‏Tallinn‏

‏Estonia‏

‏Partial‏

‏20.98‏

‏77.24‏

‏22.13‏

‏5.38‏

‏1.37‏

‏8‏

‏Shanghai‏

‏China‏

‏Illegal‏

‏20.82‏

‏44.43‏

‏49.12‏

‏20.75‏

‏5.31‏

‏9‏

‏Beijing‏

‏China‏

‏Illegal‏

‏20.52‏

‏44.43‏

‏43.10‏

‏18.21‏

‏4.73‏

‏10‏

‏Oslo‏

‏Norway‏

‏Partial‏

‏19.14‏

‏68.83‏

‏19.28‏

‏5.26‏

‏1.46‏

‏11‏

‏Washington, DC‏

‏USA‏

‏Partial‏

‏18.08‏

‏42.54‏

‏47.51‏

‏20.96‏

‏6.18‏

‏12‏

‏Cairo‏

‏Egypt‏

‏Illegal‏

‏16.15‏

‏73.13‏

‏384.87‏

‏98.78‏

‏32.59‏

‏13‏

‏Reykjavik‏

‏Iceland‏

‏Illegal‏

‏15.92‏

‏56.40‏

‏3.97‏

‏1.32‏

‏0.44‏

‏14‏

‏Belfast‏

‏Ireland‏

‏Illegal‏

‏15.81‏

‏77.80‏

‏13.55‏

‏3.27‏

‏1.10‏

‏15‏

‏Minsk‏

‏Belarus‏

‏Illegal‏

‏15.80‏

‏51.15‏

‏9.08‏

‏3.33‏

‏1.12‏

‏16‏

‏Athens‏

‏Greece‏

‏Partial‏

‏14.95‏

‏79.95‏

‏7.42‏

‏1.74‏

‏0.62‏

‏17‏

‏Auckland‏

‏New Zealand‏

‏Partial‏

‏14.77‏

‏77.34‏

‏106.03‏

‏25.73‏

‏9.28‏

‏18‏

‏Munich‏

‏Germany‏

‏Partial‏

‏14.56‏

‏72.90‏

‏50.90‏

‏13.10‏

‏4.80‏

‏19‏

‏Helsinki‏

‏Finland‏

‏Partial‏

‏14.42‏

‏81.53‏

‏27.12‏

‏6.24‏

‏2.31‏

‏20‏

‏Singapore‏

‏Singapore‏

‏Illegal‏

‏14.01‏

‏66.23‏

‏0.14‏

‏0.04‏

‏0.02‏

‏21‏

‏Berlin‏

‏Germany‏

‏Partial‏

‏13.53‏

‏72.90‏

‏114.77‏

‏29.55‏

‏11.64‏

‏22‏

‏Stuttgart‏

‏Germany‏

‏Partial‏

‏13.50‏

‏72.90‏

‏20.20‏

‏5.20‏

‏2.05‏

‏23‏

‏Thessaloniki‏

‏Greece‏

‏Partial‏

‏13.49‏

‏79.95‏

‏3.17‏

‏0.75‏

‏0.29‏

‏24‏

‏Stockholm‏

‏Sweden‏

‏Illegal‏

‏13.20‏

‏68.84‏

‏15.06‏

‏4.11‏

‏1.66‏

‏25‏

‏Vienna‏

‏Austria‏

‏Partial‏

‏12.87‏

‏74.00‏

‏59.21‏

‏15.02‏

‏6.22‏

‏26‏

‏Copenhagen‏

‏Denmark‏

‏Partial‏

‏12.47‏

‏74.75‏

‏20.65‏

‏5.18‏

‏2.22‏

‏27‏

‏Moscow‏

‏Russia‏

‏Partial‏

‏11.84‏

‏47.63‏

‏128.97‏

‏50.82‏

‏22.87‏

‏28‏

‏Hamburg‏

‏Germany‏

‏Partial‏

‏11.64‏

‏72.90‏

‏50.16‏

‏12.92‏

‏5.91‏

‏29‏

‏Chicago‏

‏USA‏

‏Partial‏

‏11.46‏

‏42.54‏

‏119.61‏

‏52.77‏

‏24.54‏

‏30‏

‏Philadelphia‏

‏USA‏

‏Partial‏

‏11.30‏

‏42.54‏

‏68.37‏

‏30.16‏

‏14.22‏

‏31‏

‏Bucharest‏

‏Romania‏

‏Partial‏

‏11.18‏

‏75.41‏

‏17.23‏

‏4.29‏

‏2.04‏

‏32‏

‏Cologne‏

‏Germany‏

‏Partial‏

‏11.14‏

‏72.90‏

‏28.51‏

‏7.34‏

‏3.51‏

‏33‏

‏Geneva‏

‏Switzerland‏

‏Partial‏

‏11.12‏

‏61.20‏

‏5.90‏

‏1.81‏

‏0.87‏

‏34‏

‏Boston‏

‏USA‏

‏Legal‏

‏11.01‏

‏42.54‏

‏28.59‏

‏12.61‏

‏6.10‏

‏35‏

‏Adelaide‏

‏Australia‏

‏Partial‏

‏10.91‏

‏56.76‏

‏41.60‏

‏13.75‏

‏6.72‏

‏36‏

‏Istanbul‏

‏Turkey‏

‏Partial‏

‏10.87‏

‏82.13‏

‏21.79‏

‏4.98‏

‏2.44‏

‏37‏

‏Melbourne‏

‏Australia‏

‏Partial‏

‏10.84‏

‏56.76‏

‏132.75‏

‏43.90‏

‏21.58‏

‏38‏

‏Sydney‏

‏Australia‏

‏Partial‏

‏10.79‏

‏56.76‏

‏138.36‏

‏45.75‏

‏22.59‏

‏39‏

‏New York‏

‏USA‏

‏Partial‏

‏10.76‏

‏42.54‏

‏354.48‏

‏156.40‏

‏77.44‏

‏40‏

‏Düsseldorf‏

‏Germany‏

‏Partial‏

‏10.70‏

‏72.90‏

‏15.82‏

‏4.07‏

‏2.03‏

‏41‏

‏Brisbane‏

‏Australia‏

‏Partial‏

‏10.63‏

‏56.76‏

‏66.88‏

‏22.12‏

‏11.09‏

‏42‏

‏Hanover‏

‏Germany‏

‏Partial‏

‏10.51‏

‏72.90‏

‏13.46‏

‏3.47‏

‏1.76‏

‏43‏

‏Prague‏

‏Czech Rep.‏

‏Partial‏

‏10.47‏

‏77.42‏

‏63.95‏

‏15.50‏

‏7.89‏

‏44‏

‏Frankfurt‏

‏Germany‏

‏Partial‏

‏10.29‏

‏72.90‏

‏18.06‏

‏4.65‏

‏2.41‏

‏45‏

‏Wellington‏

‏New Zealand‏

‏Partial‏

‏10.11‏

‏77.34‏

‏19.53‏

‏4.74‏

‏2.50‏

‏46‏

‏Dallas‏

‏USA‏

‏Partial‏

‏10.03‏

‏42.54‏

‏51.01‏

‏22.50‏

‏11.95‏

‏47‏

‏Houston‏

‏USA‏

‏Partial‏

‏10.03‏

‏42.54‏

‏89.13‏

‏39.32‏

‏20.89‏

‏48‏

‏Vilnius‏

‏Lithuania‏

‏Illegal‏

‏10.00‏

‏75.76‏

‏5.20‏

‏1.29‏

‏0.69‏

‏49‏

‏Zurich‏

‏Switzerland‏

‏Partial‏

‏9.71‏

‏61.20‏

‏10.33‏

‏3.17‏

‏1.74‏

‏50‏

‏Montpellier‏

‏France‏

‏Illegal‏

‏9.70‏

‏80.30‏

‏12.21‏

‏2.85‏

‏1.57‏

‏51‏

‏Canberra‏

‏Australia‏

‏Partial‏

‏9.65‏

‏56.76‏

‏10.96‏

‏3.63‏

‏2.00‏

‏52‏

‏Zagreb‏

‏Croatia‏

‏Partial‏

‏9.43‏

‏75.26‏

‏24.35‏

‏6.07‏

‏3.43‏

‏53‏

‏Nice‏

‏France‏

‏Illegal‏

‏9.40‏

‏80.30‏

‏15.80‏

‏3.69‏

‏2.09‏

‏54‏

‏Phoenix‏

‏USA‏

‏Partial‏

‏9.35‏

‏42.54‏

‏58.26‏

‏25.71‏

‏14.65‏

‏55‏

‏Paris‏

‏France‏

‏Illegal‏

‏9.30‏

‏80.30‏

‏102.25‏

‏23.90‏

‏13.69‏

‏56‏

‏Miami‏

‏USA‏

‏Partial‏

‏9.27‏

‏42.54‏

‏16.24‏

‏7.16‏

‏4.12‏

‏57‏

‏San Francisco‏

‏USA‏

‏Legal‏

‏9.27‏

‏42.54‏

‏30.94‏

‏13.65‏

‏7.85‏

‏58‏

‏London‏

‏UK‏

‏Illegal‏

‏9.20‏

‏82.16‏

‏237.35‏

‏54.22‏

‏31.40‏

‏59‏

‏Colombo‏

‏Sri Lanka‏

‏Illegal‏

‏9.12‏

‏73.78‏

‏3.98‏

‏1.01‏

‏0.59‏

‏60‏

‏Riga‏

‏Latvia‏

‏Illegal‏

‏9.00‏

‏76.89‏

‏10.23‏

‏2.50‏

‏1.48‏

‏61‏

‏Bratislava‏

‏Slovakia‏

‏Illegal‏

‏8.92‏

‏81.54‏

‏7.24‏

‏1.67‏

‏1.00‏

‏62‏

‏Milan‏

‏Italy‏

‏Partial‏

‏8.85‏

‏75.68‏

‏46.06‏

‏11.42‏

‏6.88‏

‏63‏

‏Varna‏

‏Bulgaria‏

‏Illegal‏

‏8.83‏

‏82.65‏

‏4.84‏

‏1.10‏

‏0.66‏

‏64‏

‏Marseille‏

‏France‏

‏Illegal‏

‏8.69‏

‏80.30‏

‏36.23‏

‏8.47‏

‏5.19‏

‏65‏

‏Glasgow‏

‏UK‏

‏Illegal‏

‏8.65‏

‏82.16‏

‏15.21‏

‏3.47‏

‏2.14‏

‏66‏

‏Toulouse‏

‏France‏

‏Illegal‏

‏8.62‏

‏80.30‏

‏18.67‏

‏4.36‏

‏2.70‏

‏67‏

‏Birmingham‏

‏UK‏

‏Illegal‏

‏8.58‏

‏82.16‏

‏27.73‏

‏6.34‏

‏3.93‏

‏68‏

‏Kuala Lumpur‏

‏Malaysia‏

‏Illegal‏

‏8.54‏

‏55.36‏

‏6.61‏

‏2.24‏

‏1.40‏

‏69‏

‏Monterrey‏

‏Mexico‏

‏Partial‏

‏8.45‏

‏65.87‏

‏4.17‏

‏1.19‏

‏0.75‏

‏70‏

‏Edinburgh‏

‏UK‏

‏Illegal‏

‏8.41‏

‏82.16‏

‏12.22‏

‏2.79‏

‏1.77‏

‏71‏

‏Lisbon‏

‏Portugal‏

‏Partial‏

‏8.36‏

‏74.51‏

‏4.69‏

‏1.18‏

‏0.75‏

‏72‏

‏Strasbourg‏

‏France‏

‏Illegal‏

‏8.35‏

‏80.30‏

‏11.13‏

‏2.60‏

‏1.66‏

‏73‏

‏Warsaw‏

‏Poland‏

‏Partial‏

‏8.31‏

‏80.29‏

‏29.27‏

‏6.84‏

‏4.39‏

‏74‏

‏Lyon‏

‏France‏

‏Illegal‏

‏8.20‏

‏80.30‏

‏19.45‏

‏4.55‏

‏2.95‏

‏75‏

‏Los Angeles‏

‏USA‏

‏Legal‏

‏8.14‏

‏42.54‏

‏124.88‏

‏55.10‏

‏36.06‏

‏76‏

‏Liverpool‏

‏UK‏

‏Illegal‏

‏7.94‏

‏82.16‏

‏10.86‏

‏2.48‏

‏1.67‏

‏77‏

‏Amsterdam‏

‏Netherlands‏

‏Partial‏

‏7.89‏

‏73.40‏

‏20.94‏

‏5.35‏

‏3.61‏

‏78‏

‏Manchester‏

‏UK‏

‏Illegal‏

‏7.88‏

‏82.16‏

‏58.99‏

‏13.48‏

‏9.11‏

‏79‏

‏Rome‏

‏Italy‏

‏Partial‏

‏7.86‏

‏75.68‏

‏88.16‏

‏21.86‏

‏14.82‏

‏80‏

‏Toronto‏

‏Canada‏

‏Partial‏

‏7.82‏

‏69.80‏

‏124.15‏

‏33.38‏

‏22.75‏

‏81‏

‏Denver‏

‏USA‏

‏Legal‏

‏7.79‏

‏42.54‏

‏20.53‏

‏9.06‏

‏6.20‏

‏82‏

‏Naples‏

‏Italy‏

‏Partial‏

‏7.75‏

‏75.68‏

‏29.82‏

‏7.40‏

‏5.08‏

‏83‏

‏Leeds‏

‏UK‏

‏Illegal‏

‏7.67‏

‏82.16‏

‏16.93‏

‏3.87‏

‏2.69‏

‏84‏

‏Seattle‏

‏USA‏

‏Legal‏

‏7.58‏

‏42.54‏

‏20.59‏

‏9.08‏

‏6.39‏

‏85‏

‏Madrid‏

‏Spain‏

‏Partial‏

‏7.47‏

‏78.09‏

‏93.40‏

‏22.45‏

‏16.01‏

‏86‏

‏Calgary‏

‏Canada‏

‏Partial‏

‏7.30‏

‏69.80‏

‏52.23‏

‏14.05‏

‏10.25‏

‏87‏

‏Luxembourg City‏

‏Luxembourg‏

‏Partial‏

‏7.26‏

‏70.24‏

‏1.62‏

‏0.43‏

‏0.32‏

‏88‏

‏San Jose‏

‏Costa Rica‏

‏Partial‏

‏7.23‏

‏69.76‏

‏7.84‏

‏2.11‏

‏1.56‏

‏89‏

‏Buenos Aires‏

‏Argentina‏

‏Partial‏

‏7.13‏

‏69.84‏

‏25.32‏

‏6.81‏

‏5.09‏

‏90‏

‏Brussels‏

‏Belgium‏

‏Partial‏

‏7.09‏

‏75.92‏

‏15.50‏

‏3.83‏

‏2.88‏

‏91‏

‏Santo Domingo‏

‏Dominican Rep.‏

‏Illegal‏

‏6.93‏

‏58.87‏

‏0.67‏

‏0.21‏

‏0.16‏

‏92‏

‏Graz‏

‏Austria‏

‏Partial‏

‏6.84‏

‏74.00‏

‏4.81‏

‏1.22‏

‏0.95‏

‏93‏

‏Budapest‏

‏Hungary‏

‏Illegal‏

‏6.74‏

‏77.26‏

‏7.70‏

‏1.87‏

‏1.48‏

‏94‏

‏Sofia‏

‏Bulgaria‏

‏Illegal‏

‏6.66‏

‏82.65‏

‏12.83‏

‏2.91‏

‏2.33‏

‏95‏

‏Ottawa‏

‏Canada‏

‏Partial‏

‏6.62‏

‏69.80‏

‏35.43‏

‏9.53‏

‏7.67‏

‏96‏

‏Vancouver‏

‏Canada‏

‏Partial‏

‏6.40‏

‏69.80‏

‏23.44‏

‏6.30‏

‏5.25‏

‏97‏

‏Sao Paulo‏

‏Brazil‏

‏Partial‏

‏6.38‏

‏64.94‏

‏68.55‏

‏19.81‏

‏16.55‏

‏98‏

‏Rotterdam‏

‏Netherlands‏

‏Partial‏

‏6.33‏

‏73.40‏

‏12.75‏

‏3.26‏

‏2.74‏

‏99‏

‏Ljubljana‏

‏Slovenia‏

‏Partial‏

‏6.32‏

‏80.41‏

‏3.43‏

‏0.80‏

‏0.67‏

‏100‏

‏Barcelona‏

‏Spain‏

‏Partial‏

‏6.23‏

‏78.09‏

‏39.59‏

‏9.51‏

‏8.14‏

‏101‏

‏Montreal‏

‏Canada‏

‏Partial‏

‏6.15‏

‏69.80‏

‏60.52‏

‏16.27‏

‏14.10‏

‏102‏

‏Kiev‏

‏Ukraine‏

‏Partial‏

‏6.00‏

‏74.78‏

‏14.73‏

‏3.70‏

‏3.28‏

‏103‏

‏Abuja‏

‏Nigeria‏

‏Illegal‏

‏5.88‏

‏20.63‏

‏7.40‏

‏6.73‏

‏6.10‏

‏104‏

‏Lima‏

‏Peru‏

‏Partial‏

‏5.88‏

‏37.83‏

‏12.28‏

‏6.09‏

‏5.52‏

‏105‏

‏Mexico City‏

‏Mexico‏

‏Partial‏

‏5.87‏

‏65.87‏

‏22.58‏

‏6.43‏

‏5.84‏

‏106‏

‏Cape Town‏

‏South Africa‏

‏Illegal‏

‏5.82‏

‏48.80‏

‏2.47‏

‏0.95‏

‏0.87‏

‏107‏

‏Karachi‏

‏Pakistan‏

‏Illegal‏

‏5.32‏

‏60.70‏

‏135.48‏

‏41.89‏

‏41.95‏

‏108‏

‏Manila‏

‏Philippines‏

‏Illegal‏

‏5.24‏

‏74.27‏

‏2.32‏

‏0.59‏

‏0.60‏

‏109‏

‏Rio de Janeiro‏

‏Brazil‏

‏Partial‏

‏5.11‏

‏64.94‏

‏28.82‏

‏8.33‏

‏8.69‏

‏110‏

‏Mumbai‏

‏India‏

‏Partial‏

‏4.57‏

‏60.39‏

‏89.38‏

‏27.78‏

‏32.38‏

‏111‏

‏New Delhi‏

‏India‏

‏Partial‏

‏4.38‏

‏60.39‏

‏101.20‏

‏31.45‏

‏38.26‏

‏112‏

‏Antwerp‏

‏Belgium‏

‏Partial‏

‏4.29‏

‏75.92‏

‏4.10‏

‏1.01‏

‏1.26‏

‏113‏

‏Astana‏

‏Kazakhstan‏

‏Illegal‏

‏4.22‏

‏39.29‏

‏1.78‏

‏0.85‏

‏1.07‏

‏114‏

‏Montevideo‏

‏Uruguay‏

‏Legal‏

‏4.15‏

‏66.75‏

‏19.54‏

‏5.50‏

‏7.06‏

‏115‏

‏Johannesburg‏

‏South Africa‏

‏Illegal‏

‏4.01‏

‏48.80‏

‏3.76‏

‏1.45‏

‏1.92‏

‏116‏

‏Panama City‏

‏Panama‏

‏Illegal‏

‏3.85‏

‏56.52‏

‏0.81‏

‏0.27‏

‏0.37‏

‏117‏

‏Jakarta‏

‏Indonesia‏

‏Illegal‏

‏3.79‏

‏53.40‏

‏1.92‏

‏0.68‏

‏0.95‏

‏118‏

‏Asuncion‏

‏Paraguay‏

‏Partial‏

‏2.22‏

‏16.00‏

‏0.16‏

‏0.19‏

‏0.46‏

‏119‏

‏Bogota‏

‏Colombia‏

‏Partial‏

‏2.20‏

‏49.44‏

‏15.80‏

‏6.00‏

‏14.53‏

‏120‏

‏Quito‏

‏Ecuador‏

‏Partial‏

‏1.34‏

‏70.39‏

‏0.56‏

‏0.15‏

‏0.60‏

‏Methodology‏

‏Selection of the cities:‏

‏To select the cities for the study, Seedo first looked at the top and bottom cannabis consuming countries around the world. Then they analysed nations where marijuana is partially or completely legal, as well as illegal, and selected the final list of 120 cities in order to best offer a representative comparison of the global cannabis price. ‏

‏Data:‏

‏Price per gram, US$ ‏ ‏- Crowdsourced city-level surveys adjusted to World Drug Report 2017 of the United Nations Office on Drugs and Crime.‏

‏Taxes on Cigarettes, % of the most sold brand‏ ‏ – Taxes as a percentage of the retail price of the most sold brand (total tax). ‏ ‏Source‏ ‏: Appendix 2 of the WHO report on the global tobacco epidemic, 2015.‏

‏Annual possible tax collection is calculated in the following way: ‏

‏Total_Possible_Tax=Population_City*Prevalence*Avg_Consumption_year_gr*price*tax_level, where:‏

‏Population: latest available local population data sources.‏

‏Annual Prevalence (percentage of population, having used weed in the year). Source: World Drug Report 2017 of the United Nations Office on Drugs and Crime‏

‏Average Consumption of weed per year in grams (people who consumed weed at least once in the previous year). ‏

‏Estimation, with the assumption, that one use of weed on average means one joint. ‏

‏One joint is assumed to have 0.66 grams of weed as in the paper of Mariani, Brooks, Haney and Levin (2010). ‏

‏The distribution of use during the year is assumed to be the same as in Zhao and Harris (2004), where the yearly usage varies from once or twice a year to everyday.‏

‏Total Consumption in Tons‏

‏Consumption=Population*Prevalence*Consumption_year_gr‏

‏Population: latest available local population data sources.‏

‏Annual Prevalence (percentage of population, having used weed in the year). ‏ ‏Source‏ ‏: World Drug Report 2017 of the United Nations Office on Drugs and Crime‏

‏Average Consumption of weed per year in grams (people who consumed weed at least once in the previous year).‏

‏Estimation, with the assumption, that one use of weed on average means one joint. ‏

‏One joint is assumed to have 0.66 grams of weed as in the paper of Mariani, Brooks, Haney and Levin (2010). ‏

‏The distribution of use during the year is assumed to be the same as in Zhao and Harris (2004), where the yearly usage varies from once or twice a year to everyday. ‏

‏US tax level ‏ ‏- Average tax level in the states of US where weed is legal: Alaska, California, Colorado, Maine, Massachusetts, Nevada, Oregon and Washington. Includes retail sales taxes, state taxes, local taxes and excise taxes.‏

‏Legality‏

‏Legal, if possession and selling for recreational and medical use is legal.‏

‏Illegal, if possession and selling for recreational and medical use is illegal.‏

‏Partial, if ‏

‏Possession of small amounts is decriminalised (criminal penalties lessened, fines and regulated permits may still apply)‏

‏OR medicinal use legal‏

‏OR possession is legal, selling illegal‏

‏OR scientific use legal‏

‏OR usage allowed in restricted areas (e.g. homes or coffee shops)‏

‏OR local laws may apply to legality (e.g. illegal at federal level, legal at state level)‏

‏First quote: Based on New York City Council’s free lunch initiative which began in September 2017, with 1.1 million public school children, at a cost of $1.75 per child per day.‏

The Benefits Of CBD Oil On Anxiety And Depression

Life certainly has its challenges. Stress can arise from work, friends, and relationships — daily life can feel overwhelming at times. When you suffer from anxiety or depression (or both), living a happy, stress-free life can sometimes feel nearly impossible.

Perhaps you’re looking for a natural way to take the edge off. There are pharmaceutical anti-anxiety and anti-depression medications out there, but long-term use can be negative on the body and many benzodiazepines contain addictive qualities that you might want to avoid.

Instead of pills, consider using an alternative and natural method. Recreational cannabidioil, better known as CBD oil, is one of over 100 chemical compounds known cannabinoids found in the cannabis or marijuana plant.

CBD does not contain Tetrahydrocannabinol (THC), which is the psychoactive component found in the plant (so it doesn’t make you high), and research has found that it can be calming and alleviate symptoms of stress and anxiety.

The socially conscious cannabis brand Blissed is a company that believes in offering the authentic cannabis experience to individuals who need a break. It’s based entirely on the power of wellness and community, and they’re committed to giving 10% of all profits to organizations and causes that make a positive impact on society.

The company products using cannabis, including those made from CBD oil, as well as 1:1 oils for those looking to ease into using THC.

Take a look at how using CBD oil recreationally can help reduce your anxiety symptoms.

What Exactly Is CBD Oil?

CBD is the second most prevalent of the active ingredients in the cannabis plant. It’s an essential component of medical marijuana, however, it’s derived directly from the hemp plant, which is a cousin of the actual marijuana plant. While CBD is a component of marijuana, it doesn’t produce a “high” feeling on its own.

According to a recent study conducted by the World Health Organization, humans don’t show signs of negative effects or dependence when using CBD oil. To date, there has been no evidence of public health-related issues associated with the use of pure CBD.

Relief from Anxiety and Depression

Anxiety and depression are common mental health disorders that can feel debilitating. We all have various stressors in our lives, and we all handle things differently. Sometimes we just want a little reprieve — a pause where we can sit down at the end of a long day, chill out, and show ourselves some love and compassion.

Of course, there are pharmaceutical drugs to take but these are often not a sustainable long-term method. There can be harmful side effects such as drowsiness, insomnia, sexual dysfunction, addiction, and more.

CBD oil has shown strong promise as a treatment for both depression and anxiety, leading many who live with these afflictions to become interested in this natural approach to coping with anxiety and depression.

It amps up dopamine and serotonin levels naturally, so you can enjoy feeling good without having to worry about the comedown as you would from other types of chemical drugs or alcohol.

A study from 2010 concluded that CBD oil could reduce the symptoms of social anxiety disorders (SADs). Brain scans of participants revealed changes in blood flow to the area of the brain that are linked to feelings of anxiety.

In this particular study, CBD oil made participants feel significantly better and it also changed the way their brands responded to anxiety.

At the end of a long day, what could be better than putting your feet up, opening up Netflix, and unwinding with a little CBD oil?

Treat yourself to a blissful, relaxing evening and look into how CBD oil could benefit your life today.

Study Reveals Cost Of Cannabis And Industry Growth Worldwide

2018 Weed Index Study reveals the cost of marijuana and highlights the number of grow and head shops in 120 cities around the world:

  • With a total of 156, Los Angeles, USA has the most headshops.
  • Madrid, Spain has the largest amount of growshops, with a total of 68.
  • Tokyo, Japan has the most expensive cannabis, at 32.66 USD per gram, while Quito, Ecuador has the least expensive marijuana, at 1.34 USD per gram.
  • Based on the average US marijuana tax rates currently implemented, New York City could generate the highest potential tax revenue by legalising weed, with 156.40 million USD per year. New York City also has the highest consumption rate of cannabis, at 77.44 metric tons per year.


Berlin, Germany, 20/04/2018 – ABCD, a data-driven media campaign outlet, has released new data which reveals the number of marijuana head and growshops in 120 cities around the world. This research, which builds on the 2018 Cannabis Price Index released earlier this year, reveals which locations around the world are ready to embrace cannabis legalisation. The aim of the study is to illustrate the continuous need for legislative reform on cannabis use around the world, and to determine if there are any lessons to be learned from those cities at the forefront of marijuana legalization. By including extra data on the number of head and growshops in each city, this new research can be utilized to indicate which cities are prepared for an imminent cannabis reform, while also highlighting which cities are in opposition of marijuana legalisation.


The initial study began by selecting 120 cities across the world, including locations where cannabis is currently legal, illegal and partially legal, and where marijuana consumption data is available. Then, they looked into the price of weed per gram in each city. To calculate how much potential tax a city could make by legalising weed, ABCD investigated how much tax is paid on the most popular brand of cigarettes, as this offers the closest comparison. They then looked at what percentage marijuana is currently taxed in cities where it’s already legalised in the US.

ABCD decided to conduct the extra research in order to to further the discussion around the medical and recreational use of cannabis, and the potential industry and business opportunities that would follow legalisation. By identifying the number of headshops as well as growshops, this study serves as an indicator to a city’s existing cannabis infrastructure and willingness to accept such reform on a larger scale. As an indicating factor, the more head shops and grow shops a city has, the more positive their state’s and general public’s attitude towards the cannabis-related industry is likely to be.

The table below reveals a sample of the results for the 13 US cities featured in the study:


# City Legality Price per gram, US$ Total possible tax collection, if taxed at cigarette level, mil US$ Total possible tax collection, if taxed at average US marijuana taxes, mil US$ Total consumption in metric tons Headshops Growshops
1 Washington, DC Partial 18.08 47.51 20.96 6.18 20 8
2 Chicago Partial 11.46 119.61 52.77 24.54 91 10
3 Philadelphia Partial 11.30 68.37 30.16 14.22 41 3
4 Boston Legal 11.01 28.59 12.61 6.10 49 4
5 New York Partial 10.76 354.48 156.40 77.44 59 7
6 Dallas Partial 10.03 51.01 22.5 11.95 80 6
7 Houston Partial 10.03 89.13 39.32 20.89 125 14
8 Phoenix Partial 9.35 58.26 25.71 14.65 72 9
9 Miami Partial 9.27 16.24 7.16 4.12 67 25
10 San Francisco Legal 9.27 30.94 13.65 7.85 61 3
11 Los Angeles Legal 8.14 124.88 55.10 36.06 153 46
12 Denver Legal 7.79 20.53 9.06 6.20 61 21
13 Seattle Legal 7.58 20.59 9.08 6.39 46 10


The table below shows the top 10 most and least expensive cities for cannabis:


Top 10 Most Expensive Cities Top 10 Least Expensive Cities
# City Country Legality Price per gram, US$ # City Country Legality Price per gram, US$
1 Tokyo Japan Illegal 32.66 1 Quito Ecuador Partial 1.34
2 Seoul South Korea Illegal 32.44 2 Bogota Colombia Partial 2.20
3 Kyoto Japan Illegal 29.65 3 Asuncion Paraguay Partial 2.22
4 Hong Kong China Illegal 27.48 4 Jakarta Indonesia Illegal 3.79
5 Bangkok Thailand Partial 24.81 5 Panama City Panama Illegal 3.85
6 Dublin Ireland Illegal 21.63 6 Johannesburg South Africa Illegal 4.01
7 Tallinn Estonia Partial 20.98 7 Montevideo Uruguay Legal 4.15
8 Shanghai China Illegal 20.82 8 Astana Kazakhstan Illegal 4.22
9 Beijing China Illegal 20.52 9 Antwerp Belgium Partial 4.29
10 Oslo Norway Partial 19.14 10 New Delhi India Partial 4.38


The table Below shows the top 10 cities with the most growshops:


# City Country Legality Growshops
1 Madrid Spain Partial 68
2 Buenos Aires Argentina Partial 48
3 Los Angeles USA Legal 46
4 Toronto Canada Partial 37
5 Melbourne Australia Partial 31
6 Miami USA Partial 25
7 London UK Illegal 23
8 Barcelona Spain Partial 23
9 Denver USA Legal 21
10 Berlin Germany Partial 20


The table Below shows the top 10 cities with the most headshops:


# City Country Legality Headshops
1 Los Angeles USA Legal 156
2 Houston USA Partial 125
3 Chicago USA Partial 91
4 Dallas USA Partial 80
5 Phoenix USA Partial 72
6 Miami USA Partial 67
7 San Francisco USA Legal 61
8 Denver USA Legal 61
9 New York USA Partial 59
10 Boston USA Legal 49


The table below shows the top 10 cities who could generate the most potential tax by legalising cannabis, if taxed at the same rate as the most popular cigarette brand:


# City Country Legality Price per gram, US$ % of cigarette tax Possible tax revenue, mil US$
1 Cairo Egypt Illegal 16.15 73.13 384.87
2 New York USA Partial 10.76 42.54 354.48
3 London UK Illegal 9.20 82.16 237.35
4 Sydney Australia Partial 10.79 56.76 138.36
5 Karachi Pakistan Illegal 5.32 60.7 135.48
6 Melbourne Australia Partial 10.84 56.76 132.75
7 Moscow Russia Partial 11.84 47.63 128.97
8 Toronto Canada Partial 7.82 69.8 124.15
9 Chicago USA Partial 11.46 42.54 119.61
10 Berlin Germany Partial 13.53 72.9 114.77

N.B. % of cigarette tax refers to the tax percentage on the most popular brand. Possible tax revenue refers to the total possible tax collection per year, if taxed at cigarette level. For a full explanation of how the study was conducted, please see the methodology at the bottom of the press release.


The table below shows the top 10 cities who could generate the most potential tax by legalising cannabis, if taxed at the average US marijuana tax rate:


# City Country Legality Price per gram, US$ Possible tax revenue, mil US$
1 New York USA Partial 10.76 156.4
2 Cairo Egypt Illegal 16.15 98.78
3 London UK Illegal 9.20 54.22
4 Chicago USA Partial 11.46 52.77
5 Moscow Russia Partial 11.84 50.82
6 Sydney Australia Partial 10.79 45.75
7 Melbourne Australia Partial 10.84 43.9
8 Karachi Pakistan Illegal 5.32 41.89
9 Houston USA Partial 10.03 39.32
10 Toronto Canada Partial 7.82 33.38

N.B. Possible tax revenue refers to the total possible tax collection per year, if taxed at average US marijuana tax rate.


The table below shows the top 10 cities with the highest and lowest consumption of cannabis, per year:


Highest Consumers of Cannabis Lowest Consumers of Cannabis
# City Country Legality Price per gram, US$ Total consumption, metric tons # City Country Legality Price per gram, US$ Total consumption, metric tons
1 New York USA Partial 10.76 77.44 1 Singapore Singapore Illegal 14.01 0.02
2 Karachi Pakistan Illegal 5.32 41.95 2 Santo Domingo Dominican Rep. Illegal 6.93 0.16
3 New Delhi India Partial 4.38 38.26 3 Kyoto Japan Illegal 29.65 0.24
4 Los Angeles USA Legal 8.14 36.06 4 Thessaloniki Greece Partial 13.49 0.29
5 Cairo Egypt Illegal 16.15 32.59 5 Luxembourg City Luxembourg Partial 7.26 0.32
6 Mumbai India Partial 4.57 32.38 6 Panama City Panama Illegal 3.85 0.37
7 London UK Illegal 9.20 31.4 7 Reykjavik Iceland Illegal 15.92 0.44
8 Chicago USA Partial 11.46 24.54 8 Asuncion Paraguay Partial 2.22 0.46
9 Moscow Russia Partial 11.84 22.87 9 Colombo Sri Lanka Illegal 9.12 0.59
10 Toronto Canada Partial 7.82 22.75 10 Manila Philippines Illegal 5.24 0.6

N.B. Total consumption is calculated per annum.


Further findings:


  • Shanghai, China has a large population of 24.15 million, has however no headshops or growshops in the city, underlining a resistance against cannabis reform.
  • On average, the status of legality (e.g. Legal, Partial or Illegal) coincides with the amount of headshops and growshops found in each city. The favourable the laws, the better the cannabis infrastructure
  • New York City, USA has the highest consumption rate of cannabis, at 77.44 metric tons per year.
  • Boston, USA has the most expensive cannabis of all the cities where it’s legal, at 11.01 USD, while Montevideo, Uruguay has the least expensive at 4.15 USD.
  • While Tokyo, Japan has the most expensive cannabis of all cities where it’s illegal, at 32.66 USD, Jakarta, Indonesia has the least expensive at 3.79 USD, despite being classed as a Group 1 drug with harsh sentences such as life imprisonment and the death penalty.
  • For cities where cannabis is partially legal, Bangkok, Thailand has the most expensive at 24.81 USD, while Quito, Ecuador has the least expensive at 1.34 USD.
  • Bulgaria has the highest tax rates for the most popular brand of cigarettes, at 82.65%, while Paraguay has the lowest, with rates of 16%.
  • Cairo, Egypt would gain the most revenue in tax if they were to legalise cannabis and tax it as the same rate as cigarettes, at 384.87 million USD. Singapore, Singapore would gain the least, at 0.14 million USD, due in part to the city’s low consumption of marijuana at 0.02 metric tons per annum.
  • Based on the average US marijuana tax rates currently implemented, New York City could generate the highest potential tax revenue by legalising weed, with 156.4 million USD per year. Singapore, Singapore would gain the least, at 0.04 million USD.


Source for data and graphics- http://weedindex.io 


The full results of the 2018 Cannabis Price Index:


# City Country Legality Price per gram, US$ Taxes of cigarettes, % of the most sold brand Total possible tax collection, if taxed at cigarette level, mil US$ Total possible tax collection, if taxed at average US marijuana taxes, mil US$ Total Consumption in metric tons
1 Tokyo Japan Illegal 32.66 64.36 32.14 9.37 1.53
2 Seoul South Korea Illegal 32.44 61.99 31.61 9.57 1.57
3 Kyoto Japan Illegal 29.65 64.36 4.64 1.35 0.24
4 Hong Kong China Illegal 27.48 44.43 19.72 8.33 1.62
5 Bangkok Thailand Partial 24.81 73.13 99.11 25.44 5.46
6 Dublin Ireland Illegal 21.63 77.80 29.31 7.07 1.74
7 Tallinn Estonia Partial 20.98 77.24 22.13 5.38 1.37
8 Shanghai China Illegal 20.82 44.43 49.12 20.75 5.31
9 Beijing China Illegal 20.52 44.43 43.10 18.21 4.73
10 Oslo Norway Partial 19.14 68.83 19.28 5.26 1.46
11 Washington, DC USA Partial 18.08 42.54 47.51 20.96 6.18
12 Cairo Egypt Illegal 16.15 73.13 384.87 98.78 32.59
13 Reykjavik Iceland Illegal 15.92 56.40 3.97 1.32 0.44
14 Belfast Ireland Illegal 15.81 77.80 13.55 3.27 1.10
15 Minsk Belarus Illegal 15.80 51.15 9.08 3.33 1.12
16 Athens Greece Partial 14.95 79.95 7.42 1.74 0.62
17 Auckland New Zealand Partial 14.77 77.34 106.03 25.73 9.28
18 Munich Germany Partial 14.56 72.90 50.90 13.10 4.80
19 Helsinki Finland Partial 14.42 81.53 27.12 6.24 2.31
20 Singapore Singapore Illegal 14.01 66.23 0.14 0.04 0.02
21 Berlin Germany Partial 13.53 72.90 114.77 29.55 11.64
22 Stuttgart Germany Partial 13.50 72.90 20.20 5.20 2.05
23 Thessaloniki Greece Partial 13.49 79.95 3.17 0.75 0.29
24 Stockholm Sweden Illegal 13.20 68.84 15.06 4.11 1.66
25 Vienna Austria Partial 12.87 74.00 59.21 15.02 6.22
26 Copenhagen Denmark Partial 12.47 74.75 20.65 5.18 2.22
27 Moscow Russia Partial 11.84 47.63 128.97 50.82 22.87
28 Hamburg Germany Partial 11.64 72.90 50.16 12.92 5.91
29 Chicago USA Partial 11.46 42.54 119.61 52.77 24.54
30 Philadelphia USA Partial 11.30 42.54 68.37 30.16 14.22
31 Bucharest Romania Partial 11.18 75.41 17.23 4.29 2.04
32 Cologne Germany Partial 11.14 72.90 28.51 7.34 3.51
33 Geneva Switzerland Partial 11.12 61.20 5.90 1.81 0.87
34 Boston USA Legal 11.01 42.54 28.59 12.61 6.10
35 Adelaide Australia Partial 10.91 56.76 41.60 13.75 6.72
36 Istanbul Turkey Partial 10.87 82.13 21.79 4.98 2.44
37 Melbourne Australia Partial 10.84 56.76 132.75 43.90 21.58
38 Sydney Australia Partial 10.79 56.76 138.36 45.75 22.59
39 New York USA Partial 10.76 42.54 354.48 156.40 77.44
40 Düsseldorf Germany Partial 10.70 72.90 15.82 4.07 2.03
41 Brisbane Australia Partial 10.63 56.76 66.88 22.12 11.09
42 Hanover Germany Partial 10.51 72.90 13.46 3.47 1.76
43 Prague Czech Rep. Partial 10.47 77.42 63.95 15.50 7.89
44 Frankfurt Germany Partial 10.29 72.90 18.06 4.65 2.41
45 Wellington New Zealand Partial 10.11 77.34 19.53 4.74 2.50
46 Dallas USA Partial 10.03 42.54 51.01 22.50 11.95
47 Houston USA Partial 10.03 42.54 89.13 39.32 20.89
48 Vilnius Lithuania Illegal 10.00 75.76 5.20 1.29 0.69
49 Zurich Switzerland Partial 9.71 61.20 10.33 3.17 1.74
50 Montpellier France Illegal 9.70 80.30 12.21 2.85 1.57
51 Canberra Australia Partial 9.65 56.76 10.96 3.63 2.00
52 Zagreb Croatia Partial 9.43 75.26 24.35 6.07 3.43
53 Nice France Illegal 9.40 80.30 15.80 3.69 2.09
54 Phoenix USA Partial 9.35 42.54 58.26 25.71 14.65
55 Paris France Illegal 9.30 80.30 102.25 23.90 13.69
56 Miami USA Partial 9.27 42.54 16.24 7.16 4.12
57 San Francisco USA Legal 9.27 42.54 30.94 13.65 7.85
58 London UK Illegal 9.20 82.16 237.35 54.22 31.40
59 Colombo Sri Lanka Illegal 9.12 73.78 3.98 1.01 0.59
60 Riga Latvia Illegal 9.00 76.89 10.23 2.50 1.48
61 Bratislava Slovakia Illegal 8.92 81.54 7.24 1.67 1.00
62 Milan Italy Partial 8.85 75.68 46.06 11.42 6.88
63 Varna Bulgaria Illegal 8.83 82.65 4.84 1.10 0.66
64 Marseille France Illegal 8.69 80.30 36.23 8.47 5.19
65 Glasgow UK Illegal 8.65 82.16 15.21 3.47 2.14
66 Toulouse France Illegal 8.62 80.30 18.67 4.36 2.70
67 Birmingham UK Illegal 8.58 82.16 27.73 6.34 3.93
68 Kuala Lumpur Malaysia Illegal 8.54 55.36 6.61 2.24 1.40
69 Monterrey Mexico Partial 8.45 65.87 4.17 1.19 0.75
70 Edinburgh UK Illegal 8.41 82.16 12.22 2.79 1.77
71 Lisbon Portugal Partial 8.36 74.51 4.69 1.18 0.75
72 Strasbourg France Illegal 8.35 80.30 11.13 2.60 1.66
73 Warsaw Poland Partial 8.31 80.29 29.27 6.84 4.39
74 Lyon France Illegal 8.20 80.30 19.45 4.55 2.95
75 Los Angeles USA Legal 8.14 42.54 124.88 55.10 36.06
76 Liverpool UK Illegal 7.94 82.16 10.86 2.48 1.67
77 Amsterdam Netherlands Partial 7.89 73.40 20.94 5.35 3.61
78 Manchester UK Illegal 7.88 82.16 58.99 13.48 9.11
79 Rome Italy Partial 7.86 75.68 88.16 21.86 14.82
80 Toronto Canada Partial 7.82 69.80 124.15 33.38 22.75
81 Denver USA Legal 7.79 42.54 20.53 9.06 6.20
82 Naples Italy Partial 7.75 75.68 29.82 7.40 5.08
83 Leeds UK Illegal 7.67 82.16 16.93 3.87 2.69
84 Seattle USA Legal 7.58 42.54 20.59 9.08 6.39
85 Madrid Spain Partial 7.47 78.09 93.40 22.45 16.01
86 Calgary Canada Partial 7.30 69.80 52.23 14.05 10.25
87 Luxembourg City Luxembourg Partial 7.26 70.24 1.62 0.43 0.32
88 San Jose Costa Rica Partial 7.23 69.76 7.84 2.11 1.56
89 Buenos Aires Argentina Partial 7.13 69.84 25.32 6.81 5.09
90 Brussels Belgium Partial 7.09 75.92 15.50 3.83 2.88
91 Santo Domingo Dominican Rep. Illegal 6.93 58.87 0.67 0.21 0.16
92 Graz Austria Partial 6.84 74.00 4.81 1.22 0.95
93 Budapest Hungary Illegal 6.74 77.26 7.70 1.87 1.48
94 Sofia Bulgaria Illegal 6.66 82.65 12.83 2.91 2.33
95 Ottawa Canada Partial 6.62 69.80 35.43 9.53 7.67
96 Vancouver Canada Partial 6.40 69.80 23.44 6.30 5.25
97 Sao Paulo Brazil Partial 6.38 64.94 68.55 19.81 16.55
98 Rotterdam Netherlands Partial 6.33 73.40 12.75 3.26 2.74
99 Ljubljana Slovenia Partial 6.32 80.41 3.43 0.80 0.67
100 Barcelona Spain Partial 6.23 78.09 39.59 9.51 8.14
101 Montreal Canada Partial 6.15 69.80 60.52 16.27 14.10
102 Kiev Ukraine Partial 6.00 74.78 14.73 3.70 3.28
103 Abuja Nigeria Illegal 5.88 20.63 7.40 6.73 6.10
104 Lima Peru Partial 5.88 37.83 12.28 6.09 5.52
105 Mexico City Mexico Partial 5.87 65.87 22.58 6.43 5.84
106 Cape Town South Africa Illegal 5.82 48.80 2.47 0.95 0.87
107 Karachi Pakistan Illegal 5.32 60.70 135.48 41.89 41.95
108 Manila Philippines Illegal 5.24 74.27 2.32 0.59 0.60
109 Rio de Janeiro Brazil Partial 5.11 64.94 28.82 8.33 8.69
110 Mumbai India Partial 4.57 60.39 89.38 27.78 32.38
111 New Delhi India Partial 4.38 60.39 101.20 31.45 38.26
112 Antwerp Belgium Partial 4.29 75.92 4.10 1.01 1.26
113 Astana Kazakhstan Illegal 4.22 39.29 1.78 0.85 1.07
114 Montevideo Uruguay Legal 4.15 66.75 19.54 5.50 7.06
115 Johannesburg South Africa Illegal 4.01 48.80 3.76 1.45 1.92
116 Panama City Panama Illegal 3.85 56.52 0.81 0.27 0.37
117 Jakarta Indonesia Illegal 3.79 53.40 1.92 0.68 0.95
118 Asuncion Paraguay Partial 2.22 16.00 0.16 0.19 0.46
119 Bogota Colombia Partial 2.20 49.44 15.80 6.00 14.53
120 Quito Ecuador Partial 1.34 70.39 0.56 0.15 0.60


Methodology


Selection of the cities:

To select the cities for the study, Seedo first looked at the top and bottom cannabis consuming countries around the world. Then they analysed nations where marijuana is partially or completely legal, as well as illegal, and selected the final list of 120 cities in order to best offer a representative comparison of the global cannabis price.


Data:


  • Price per gram, US$ – Crowdsourced city-level surveys adjusted to World Drug Report 2017 of the United Nations Office on Drugs and Crime.


  • Taxes on Cigarettes, % of the most sold brand – Taxes as a percentage of the retail price of the most sold brand (total tax). Source: Appendix 2 of the WHO report on the global tobacco epidemic, 2015.


  • Annual possible tax collection is calculated in the following way:


  • Total_Possible_Tax=Population_City*Prevalence*Avg_Consumption_year_gr*price*tax_level, where:
  • Population: latest available local population data sources.
  • Annual Prevalence (percentage of population, having used weed in the year). Source: World Drug Report 2017 of the United Nations Office on Drugs and Crime
  • Average Consumption of weed per year in grams (people who consumed weed at least once in the previous year).
  • Estimation, with the assumption, that one use of weed on average means one joint.
  • One joint is assumed to have 0.66 grams of weed as in the paper of Mariani, Brooks, Haney and Levin (2010).
  • The distribution of use during the year is assumed to be the same as in Zhao and Harris (2004), where the yearly usage varies from once or twice a year to everyday.


  • Total Consumption in Tons


  • Consumption=Population*Prevalence*Consumption_year_gr
  • Population: latest available local population data sources.
  • Annual Prevalence (percentage of population, having used weed in the year). Source: World Drug Report 2017 of the United Nations Office on Drugs and Crime
  • Average Consumption of weed per year in grams (people who consumed weed at least once in the previous year).
  • Estimation, with the assumption, that one use of weed on average means one joint.
  • One joint is assumed to have 0.66 grams of weed as in the paper of Mariani, Brooks, Haney and Levin (2010).
  • The distribution of use during the year is assumed to be the same as in Zhao and Harris (2004), where the yearly usage varies from once or twice a year to everyday.


  • US tax level – Average tax level in the states of US where weed is legal: Alaska, California, Colorado, Maine, Massachusetts, Nevada, Oregon and Washington. Includes retail sales taxes, state taxes, local taxes and excise taxes.
  • Growshops – Sourced via Google Maps Listings 2018
  • Headshops – Sourced via Google Maps Data Listings 2018
  • Legality
    • Legal, if possession and selling for recreational and medical use is legal.
    • Illegal, if possession and selling for recreational and medical use is illegal.
    • Partial, if
      • Possession of small amounts is decriminalised (criminal penalties lessened, fines and regulated permits may still apply)
      • OR medicinal use legal
      • OR possession is legal, selling illegal
      • OR scientific use legal
      • OR usage allowed in restricted areas (e.g. homes or coffee shops)
      • OR local laws may apply to legality (e.g. illegal at federal level, legal at state level)


First quote: Based on New York City Council’s free lunch initiative which began in September 2017, with 1.1 million public school children, at a cost of $1.75 per child per day.


North American Society A Madhouse Says Former US State Hospital Doctor

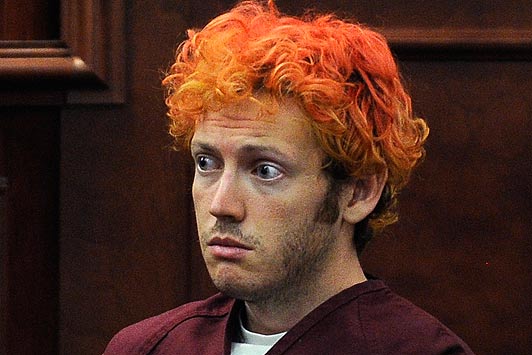
deranged "Joker" killer James Holmes
According to reports, deranged “Joker” killer James Holmes (in this July 2012 courtroom photo courtesy of thesun.co.uk) still believed that he was the fictional comic book and film character The Joker.

“Insane” has a clear meaning when we can look at it next to “sane” in the real world. Unfortunately, that has become more and more difficult to do, says Mike Bartos, former chief of staff at an American state psychiatric hospital for the criminally insane.

“It’s not just because the media rely so much now on bizarre behavior to entertain their audiences,” says Bartos, author of “BASH” – Bay Area  State Hospital – (www.mikebartos.com), a fast-paced tongue-in-cheek novel that stems from his decades of experience as a mentalhealth-care professional.

“Take a look at what have become the ‘normal’ problems in modern America – some of them could be textbook examples of psychological dysfunction.”

Case – or rather, cases – in point:

Obesity epidemic: Denial, compulsion, addiction and sublimation are just a few mechanisms at work in the psychology of a largely obese population. Sublimation is the mature defense activity perpetrated when socially unacceptable impulses, such as sexuality, are redirected, in this case to the consumption of salty, fatty and sugary food. With more than two thirds of the U.S. population and almost two thirds of the Canadian population [http://tinyurl.com/78o9z66 CP] either overweight or obese, there is nothing sane about this health crisis.

Banking: The financial crisis that changed the world in 2008 can be largely owed to a cluster of “too big to fail” U.S. banks and their employees who thought they could continuously repackage terrible debt loans. Meanwhile, unqualified customers snatched up properties they couldn’t afford. This was an undiagnosed mega-scale gambling addiction. Many in the financial world knew it simply could not be sustained but the players continued to ante up.

Climate change: Denial, denial, denial. The raw data from objective scientists overwhelmingly tells us man is largely responsible for warming global temperatures, yet we continue to use fossil fuels and to fill landfills with methane-producing waste. It’s a classic case; we completely ignore symptoms and evidence to maintain the status quo.

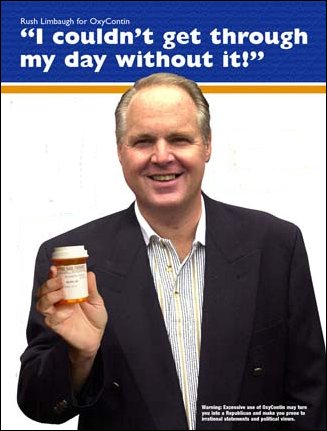
What the Bradley Report had to say about Rush Limbaugh's much-publicized addiction to oxycontin
What the Bradley Report had to say about Rush Limbaugh’s much-publicized addiction to oxycontin

A drugged nation: Marijuana, a natural relaxant, is outlawed in most states while tobacco and alcohol – responsible for incalculable violence and sickness, as well as tens of thousands of accidents and deaths each year – are lucrative and legal vice industries.  Meanwhile, some pharmaceutical companies and physicians encourage substance abuse and chemical dependency by promoting pills to ease the inevitable emotional and physical pains that come with life.

“Many of my psychiatric patients suffered from addiction to both legal and illegal drugs. Sometimes it was hard to tell which came first, the addiction or the other mental health issues,” Bartos says.

“The legal or illegal status of certain drugs seems to be completely arbitrary — much like the behavior of a patient suffering psychosis,” he says.


photo: usrecallnews.com


Spoiled-brat adults: Narcissistic Personality Disorder isn’t only now accepted in society, it’s widely encouraged and celebrated, Bartos says. Reckless driving and road-rage are just two examples in which individuals are so self-absorbed, they believe their time and sense of entitlement are more important than the lives and safety of others. Throw on top of that our obsession with plastic surgery, need for constant attention on social media, and pre-occupation with consumer brands and we have pandemic megalomania.

War: America [with on again -off again support from allies such as Canada,England and NATO allies CP] has been at war for 10 years now, and leaders cannot say with any precision what the US is doing with its current campaign in Afghanistan, nor what was accomplished with the last one in Iraq. It’s as if government leaders have a masochistic, sociopathic relationship with one percent of the U.S. population – the military, and their families. Young men are shipped off in the prime of their health, and often return physically or mentally damaged, if they come back at all.

“Is this sane?” Bartos asks.

Mike Bartos is currently in private psychiatric practice in the San Francisco Bay Area where he lives with his wife Jody.  He has several decades of experience in the mental health field, including serving as chief of staff at a state hospital for mentally ill patients convicted of violent crimes, where he focused on forensic psychiatry. Bartos is a former radio show host and newspaper columnist. For the Silo, Ginny Grimsley.

Supplemental- Oxycontin and the opium epidemic of the 21st century