- In 2024, Canada’s labour market showed modest growth, with job creation continuing but lagging rapid population growth. This led to an increase in the unemployment rate, reflecting a mismatch between labour force expansion and job creation rather than a decline in sector-specific labour shortages.
- Ongoing challenges persist, such as declining labour productivity, sector-specific labour shortages, underemployment, demographic shifts and disparities, and regional imbalances.
- Our international comparisons show that Canada typically ranks at or below the Organisation for Economic Co-operation and Development (OECD) average in terms of labour force participation and employment rates for certain population segments. This is largely due to weaker performance in specific regions, such as the Atlantic provinces, and pension policies that incentivize early retirement.
- This labour market review emphasizes the need for tailored policies to improve labour market outcomes for seniors and immigrants. Recommendations include gradually increasing the retirement age, offering high-quality training support, and easing labour mobility barriers.
Introduction
The labour market is where economic changes most directly affect working-age Canadians, influencing their job opportunities and income. The supply of labour also determines the availability of Canadians’ skills and knowledge to employers who combine them with capital to produce goods and services that drive our national income and its distribution among income classes. Therefore, the labour market is one of the most important components of Canada’s – or any – economy.
In 2024, Canada’s labour market saw moderate growth, with employment rising to 20.7 million jobs. However, the employment rate declined to 61.3 percent, down from 62.2 percent in 2023, and remains below the pre-pandemic level of 62.3 percent in 2019. While over 1.7 million employed persons have been added since 2019, employment growth has lagged behind population growth, partly due to an aging population, despite high levels of immigration.1 The unemployment rate also increased, reflecting a gap between job creation and labour force expansion, partly due to limited absorptive capacity to keep pace with population growth.
Job vacancies have decreased since mid-2022, but over half a million positions remained unfilled during the third quarter of 2024 (12 percent higher than the pre-pandemic level). Of these vacancies, the majority were full-time (432,810 positions), with more than 31 percent remaining vacant for the long term – persisting for over 90 days. Despite high full-time vacancies, more than half a million workers were underemployed in 2024, seeking full-time work while employed part-time, indicating mismatches between the skills needed by employers and the skills offered by job seekers. Among sectors facing labour shortages, factors such as better relative wages and working conditions appear to be helping, particularly in industries like construction. Healthcare, on the other hand, may benefit from raising wages and reducing training costs to better attract and retain workers.
Further, Canada faces declining labour productivity, which can be attributed to factors such as stagnant capital investment and automation, high reliance on temporary foreign workers to fill low-paying positions, underemployment (including immigrants’ overqualification), a growing public sector with lower productivity, and shifts in industry composition.
This inaugural C.D. Howe Institute labour market review highlights major differences in the labour market across provinces and sectors and among socio-economic groups. It shows that labour force participation and employment of older workers and recent immigrants still have room for improvement.
Canada needs targeted workforce development policies to improve labour market participation and outcomes for diverse population groups and encourage a longer working life (Holland 2018 and 2019). Our recommendations are to:
- Gradually raise the normal retirement age from 65 to 67 and delay pension access.
- Support older workers with flexible work, part-time options, and self-employment, especially in the Atlantic provinces.
- Invest in high-quality training programs for underrepresented groups, focusing on digital skills and job search strategies.
- Streamline credential recognition and licensure for skilled immigrants and ease labour mobility in regulated occupations while maintaining the quality of professional services.
- Enhance settlement strategies for immigrants, including workplace-focused language training.
Businesses should integrate automation and artificial intelligence (AI) to boost productivity while improving retention and encouraging later retirement by offering training2 and flexible scheduling (Mahboubi and Zhang 2023).Finally, better informing Canadians about learning and training opportunities and addressing financial and non-financial barriers would improve their training participation rates and empower them to acquire the skills needed in a changing labour market.
Overview of Canada’s Labour Market
Canada’s labour market has undergone major changes over time, influenced by factors such as the COVID-19 pandemic, globalization, technological progress, and demographic shifts. These forces have affected the functioning of the labour market, with demographic changes playing a particularly important role. This section reviews key indicators (i.e., labour-force participation, employment and unemployment) and highlights the major trends and disparities in provincial and national labour markets.
The labour force has grown steadily since 1976 but experienced a decline in 2020 due to the pandemic. The lockdowns and public health measures significantly reduced worker participation, especially among women, in the labour market. However, once the restrictions were lifted, workers returned, and the labour force fully recovered. By 2024, Canada had 22.1 million people in the labour force, an increase of about 1.9 million from 2019, mainly driven by the expansionary immigration policy that the country has followed until recently.3 Immigrants accounted for 56 percent of this increase in the labour force, while non-permanent residents made up 32 percent.4
Although the labour force has grown over time, the labour force participation rate (LFPR) has trended downward over the last two decades. This trend is largely driven by an aging population, as participation rates drop sharply after age 54 and continue to decline with age. While the LFPR among prime-aged workers (25-54) reached a record high in 2023, the overall rate remained below pre-pandemic levels and declined further in 2024, reaching 65.5 percent despite high levels of immigration.5 Three factors contributed to this decline compared to pre-pandemic levels: a lower participation rate among youth, a substantial increase in the older population (aged 55 and over) and a decline in the latter group’s participation rate. This decline in older workers’ participation is primarily due to aging, as the proportion of seniors aged 65 and over within the 55-and-over age group increased from 54.8 percent in 2019 to 60 percent in 2024.
The employment rate is more sensitive to economic conditions and fluctuates with cyclical changes in the unemployment rate. It is also influenced by factors such as government policies on education, training, and income support, as well as employers’ investments in skill development and their effectiveness in matching people to jobs. Despite some volatility during economic booms and recessions, the employment rate trended upward until 2008 but has declined since then, mirroring the impact of an aging population on the participation rate (Figure 1). The pandemic caused a sharp decline in the employment rate, followed by a modest recovery. In 2024, the rate, however, declined again by approximately one percentage point to 61.3 percent, as employment growth (1.9 percent) failed to keep pace with the population growth (3 percent).
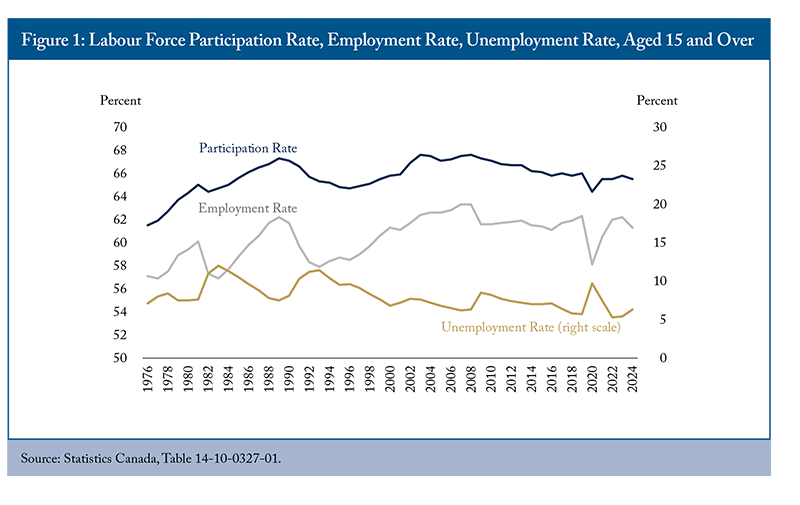
Regional disparities in employment persist across Canada. Alberta consistently maintains the highest employment rate, while Newfoundland and Labrador lags. Despite significant improvements since 1976, the Atlantic provinces continue to face challenges with employment. For its part, Ontario’s employment rate – historically the second highest in the country – has been below the national average since 2008. Regional differences in economic development, sectoral specialization patterns, educational attainment, family policy, and demographic characteristics are factors behind these employment disparities. For example, Newfoundland and Labrador and New Brunswick had the highest old-age dependency ratios (OADs) in 2024 at 39 and 37 percent, respectively, while Alberta remains the youngest province with an OAD ratio of less than 23 percent.6
The unemployment rate, a key short-term indicator, tends to rise during economic downturns and fall back during recovery, affecting employment outcomes in the opposite direction (Figure 1). The onset of the pandemic in 2020 led to a temporary surge in the unemployment rate to 9.7 percent – a four-percentage point hike from the previous year. As the economy recovered, the unemployment rate plummeted to a record low of 5.3 percent in 2022. However, by 2024, it had risen to 6.3 percent, a figure that remains relatively low by historical standards but higher than the pre-pandemic rate in 2019.
While employment grew by 1.7 million people between 2019 and 2024, the labour force expanded even faster, increasing by 1.9 million people. This imbalance – where the labour force grew more quickly than employment – pushed the unemployment rate higher, reflecting a loosening labour market and making it more challenging for job seekers to secure employment.
Overall, the labour force and employment in Canada have been expanding due to a surge in immigration. Despite unemployment rates remaining higher than the pre-pandemic level, this primarily reflects the exceptional growth in the labour force rather than a lack of job creation. The labour market continues to adjust to the increase in labour supply through strong job creation.
Looking ahead, several uncertainties and factors could influence unemployment rates. For example, the imposition of trade tariffs by the United States poses a direct risk to export-related jobs. In 2024, 8.8 percent of workers – equivalent to 1.8 million people – were employed in industries dependent on US demand for Canadian exports.7 Sectors most vulnerable to these risks include oil and gas extraction, pipeline transportation, and primary metal manufacturing.
On the other hand, stricter immigration policies that limit the inflow of permanent and non-permanent residents may reduce the growth of the labour force, which could, in turn, place downward pressure on the unemployment rate. However, the ongoing arrival of refugees, which contributes to the growing population of non-permanent residents, could lead to higher unemployment rates, particularly if newcomers face significant challenges integrating into the labour market.
To mitigate the negative impacts of aging on the labour market and address labour needs, it is important to encourage greater participation of underrepresented groups and seniors, ensure new entrants and young workers are equipped with the relevant skills to meet the labour market needs and enhance the productivity of the existing workforce. However, declining labour productivity poses an additional challenge that requires urgent attention.
Trends in Labour Productivity
Labour productivity8 in Canada has generally trended upward until the pandemic, but with a general downward trend in its growth rate. In 2020, average productivity surged to $68.5 per hour worked (in 2017 dollars), mainly driven by compositional changes in employment towards more productive jobs, particularly in the business sector, since most job losses were among low-wage workers. However, this gain proved short-lived; by 2023, productivity fell to $63.6, returning to nearly the same level as in 2019 (Figure 2).

Declining productivity has contributed to a reduction in real GDP per capita, which is a key indicator of Canadians’ living standards. Although Canada’s GDP rose by 6.9 percent (in 2017 dollars) between Q4 2019 and Q4 2023, GDP per capita decreased by 0.2 percent over that period. Since 2020, Canada’s GDP per capita growth has averaged an annual decline of 1.3 percent, compared to a growth rate of 1 percent per year between 2010 and 2019 (Wang 2022). Labour productivity continued to decline in 2024 as real GDP growth fell short of the growth of hours worked. This stands in stark contrast to the robust growth of labour productivity seen in the US during the same period.
Several factors, including human capital stock, skills utilization, overqualification, the concentration of immigrants in low-skilled jobs, limited capital investment, and slow adoption of technology, have likely contributed to recent poor labour productivity trends (Wang 2022; Robson and Bafale 2023, 2024). Notably, the combined influx of immigrants and non-permanent residents has driven the majority of employment growth between 2019 and 2024, accounting for 89 percent of the total increase in employment. Although immigrants and non-permanent residents are more likely than Canadian-born workers to have a university education, many are overqualified and work in jobs that require only a high-school diploma (Mahboubi and Zhang 2024). According to the 2021 census, the overqualification rate among immigrants9 and non-permanent residents was 21 percent and 32.4 percent, respectively, while only 8.8 percent of Canadian-born individuals with a bachelor’s degree or higher were overqualified (Schimmele and Hou 2024). With rising immigration, Canada’s productivity will increasingly depend on how effectively it leverages and develops the skills of new immigrants (Rogers 2024).
The recent influx of newcomers can help mitigate the impact of an aging population as they tend to be younger, typically being at their prime working age (Maestas, Mullen and Powell 2023). However, the concentration of immigrants and non-permanent residents in lower-skilled, low-paying sectors and occupations reduces productivity and, consequently, their contribution to GDP per capita. According to Lu and Hou (2023), between 2010 and 2019, non-permanent residents (work permit holders) were increasingly concentrated in several low-paying industries: accommodation and food services, retail trade, and administrative and support, waste management and remediation services.10 Collectively, these industries accounted for 45 percent of all temporary foreign workers in 2019. With the surge of non-permanent residents, one would expect the situation to have worsened in 2023 since the cap for hiring low-wage temporary foreign workers in 2022 increased from 10 percent to 30 percent in seven sectors, including accommodation and food services and to 20 percent for other industries.11 Similarly, Picot and Mehdi (2024) found that immigrants contribute approximately equal amounts of lower-skilled and higher-skilled labour, with 35 percent of those who landed in 2018 or 2019 working in lower-skilled jobs by 2021.
Relying on temporary foreign workers and immigrants to fill lower-skilled, low-paying jobs means that labour becomes a cheaper option than capital, which naturally disincentivizes businesses from investing in productivity-enhancing technology.12 Increases in the supply of labour also discourage business investment in skills upgrading for the existing workforce (Acemoglu and Pischke 1999).
Increases in labour supply without corresponding higher capital investment will also depress productivity. According to Robson and Bafale (2023), a larger labour force resulting from high immigration will not lead to higher living standards if workers are not equipped with better tools to produce and compete. Young and Lalonde (2024) also found that two-thirds of productivity declines since 2021 stem from this population shock.
Technological advancements, particularly digitalization and AI, offer opportunities to boost productivity. Mischke et al. (2024) find that digitalization and other technological advances could add up to 1.5 percentage points to annual productivity growth in advanced economies. Nevertheless, Canada has been slow in capital investment, automation and AI adoption.
The expansion of the public sector also poses challenges. Compared to 2019, public-sector employment increased by 19.6 percent in 2024, while private sector employment only saw an 8.5 percent increase. Consequently, public-sector jobs in 2024 accounted for 21.5 percent of all employment in Canada, up from 19.6 percent in 2019. However, public-sector productivity has lagged the business sector since 2019. In 2023, it was $58.20 per hour worked, 1.5 percent lower than its 2019 level and 1.5 percent below that of the business sector. With a higher share of public employment in the economy, this lower productivity in the public sector reduces overall labour productivity.
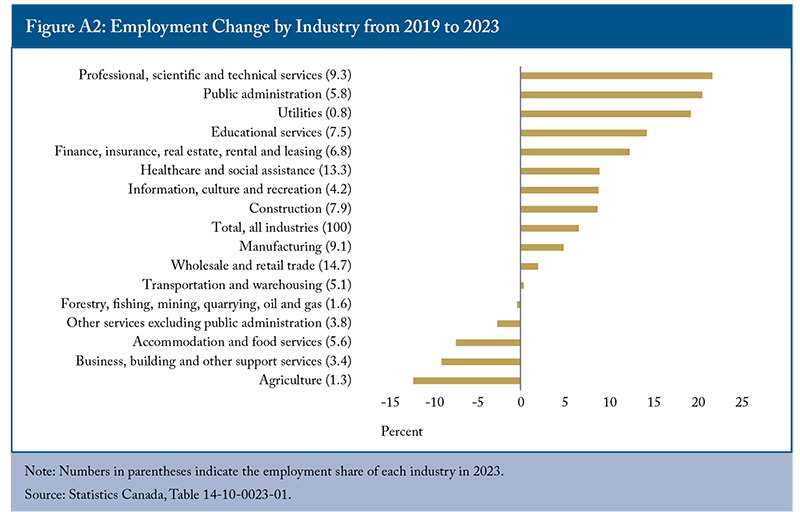
Lastly, significant variations in productivity across industries within the business sector shape Canada’s overall performance (Appendix Figure A1). Some industries, such as educational services, experienced notable productivity gains of 25 percent between 2019 and 2023. In contrast, some low-productivity industries faced substantial declines, with that of holding companies decreasing by 60 percent and construction and transportation dropping by 10 percent.13 Labour productivity in industries with the largest employment gains remained unchanged (professional, scientific, and technical services) or declined (public administration) during the same period (Appendix Figure A2). In contrast, agriculture and accommodation and food services witnessed productivity increases, likely due to investments in machinery and automation accompanying employment declines.
Therefore, the industrial distribution of jobs, shifts in industry composition, and demographic changes within industries can greatly affect Canada’s overall productivity. Tackling Canada’s productivity challenges will require substantial capital investment, targeted initiatives in skills development, technological advancements, and industry-specific strategies to promote sustainable economic growth.
Employment by Skill Level
Skill-biased technological changes – innovations that primarily benefit highly skilled workers, such as those proficient in technology, complex problem-solving, and critical thinking – have increased the demand for high-skilled labour in today’s job market. Despite the limitations of that approach, education has generally been used as a proxy for skills. In response to labour market needs, there has been a significant surge in higher education attainment among Canadians over time. The proportion of the population aged 25 and over having a postsecondary certificate, diploma or university degree rose from 37 percent in 1990 to 69 percent in 2024. According to OECD (2024), Canada has the highest postsecondary education attainment rate among core working-age individuals (25-64).
Despite these educational advancements, Canada faces productivity challenges and lags in technological adoption, particularly relative to the United States. One explanation is that although higher levels of education should translate into greater skills – leading to enhanced productivity, employability and adaptability to labour market changes – other factors such as education quality, experience, on-the-job training, capital investment, technological advancement, skill utilization, and age can substantially influence individuals’ skills levels (Mahboubi 2017b and 2019; Robson and Bafale 2023).
Skills and education levels heavily influence labour-market outcomes. For example, labour force participation, including among seniors, increases with educational attainment and those with higher education tend to remain in the labour market longer. This can mitigate some of the negative effects of an aging labour force, as significantly more seniors today possess a formal education above high school compared to decades ago and can take advantage of the ongoing shift from physical work to knowledge-based work.
In parallel with increases in the supply of highly educated labour, there has been a shift in skills requirements among employers.14 Figure 3 shows employment in high-skill-level occupations has seen remarkable growth over the past three decades, increasing by 299 percent from 1987 to 2024. Notably, during the pandemic, employment in high-skill-level roles continued to grow, even as jobs in other skill categories declined. By 2024, high-skill-level occupations accounted for 23 percent of total employment. Despite this growth, medium- and low-skill-level occupations remain predominant, employing approximately 8.1 million and 5.8 million workers, respectively, compared to 4.8 million in high-skill roles. In the last two decades, immigrants and non-permanent residents have increasingly taken both high-skilled and low-skilled jobs. Between 2001 and 2021, they accounted for half of the employment growth in professional and technical skill occupations (Picot and Hou 2024). Over the same period, employment in lower-skilled occupations decreased by half a million. However, more immigrants and non-permanent residents increasingly occupied low-skilled positions, while Canadian-born workers significantly transitioned away from these roles (Picot and Hou 2024). By 2021, immigrants were more concentrated in professional and lower-skilled occupations compared to their Canadian-born counterparts.
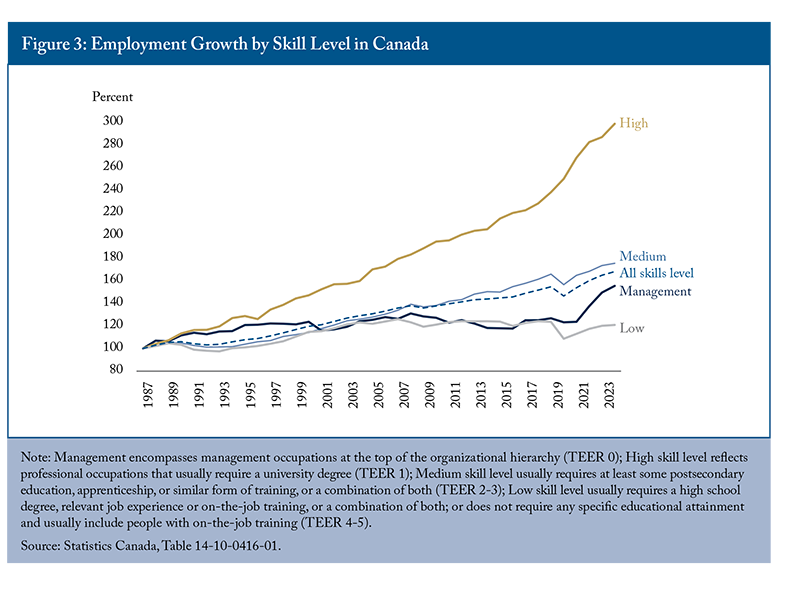
In general, the Canadian labour market has performed well since the pandemic, with particularly strong employment growth for high-skill level occupations. As demand for high-skilled labour continues to grow, improving education quality, promoting on-the-job training, and better utilizing the skills of the workforce are essential for maintaining this balance, maximizing the benefits of educational advancements, enhancing productivity and meeting the evolving demands of the labour market.
Imbalances of Labour Supply and Demand
Studying the relationship between unemployment and job vacancies provides insight into labour supply and demand imbalances. It allows us to examine two problems that hinder business growth and slow the economy down: the lack of sufficient employment opportunities for job seekers and the absence of people with the right skills to fill existing jobs.
This relationship is often described by the Beveridge curve, which illustrates how job vacancy rates and unemployment typically move in opposite directions. However, as noted by Blanchard, Domash, and Summers (2022), shifts in this relationship can occur due to factors such as increased labour demand or structural changes in the economy, leading to both higher vacancy rates and higher unemployment simultaneously.
From 2021 to mid-2022, Canada experienced a tight labour market, with an increase in job vacancies alongside declining unemployment. In response, the federal government relaxed several immigration policies to help address these shortages. However, Fortin (2024, 2025) found that a surge in immigration, particularly driven by temporary immigrants, may aggravate job vacancy rates in the overall economy, as observed in Canada between 2019 and 2023. While immigration can initially alleviate skilled labour shortages, it can also intensify shortages in the broader economy due to increased demand from newcomers for goods and services.
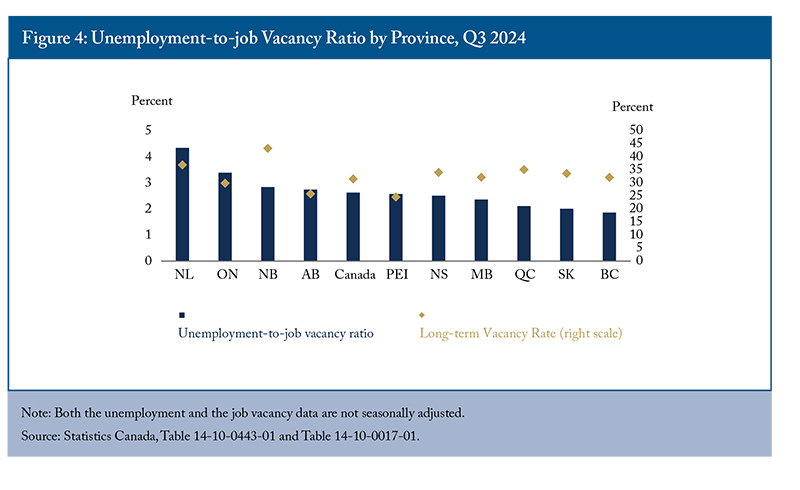
In 2024, the labour market transitioned from a state of tightness to a slackening one. In the third quarter of 2024, job vacancies in Canada totalled more than 572,000,15 marking a 12 percent increase compared to the pre-pandemic level in Q4 2019. With 1.5 million unemployed people in the labour market, there were more than two job seekers for every vacant position during that quarter. However, the provincial situations varied (Figure 4). For example, while British Columbia experienced a relatively tighter labour market, with fewer than two unemployed persons for each vacant position, there were more than four unemployed persons available per vacant position in Newfoundland and Labrador. However, the long-term vacancy rate – the share of openings that remained vacant for 90 days or more in total vacancies – in that province was 36.9 percent, which was four percentage points higher than the British Columbia rate in the third quarter of 2024. This indicates both limited employment opportunities for those unemployed and a mismatch between existing skills and those demanded by employers.
Imbalances between labour supply and demand in Canada also exist at the industry level (Figure 5). For example, while the healthcare sector faces severe labour shortages, the information, culture and recreation industry has the highest unemployment-to-vacancy ratio, indicating an excess labour supply. One interesting observation is that while both the construction and manufacturing sectors had similar levels of excess labour supply, the vacancy rate in construction was significantly higher at 3.6 percent, compared to 2.2 percent in manufacturing. This suggests that employers in the construction sector face more challenges in finding workers with the right skills.
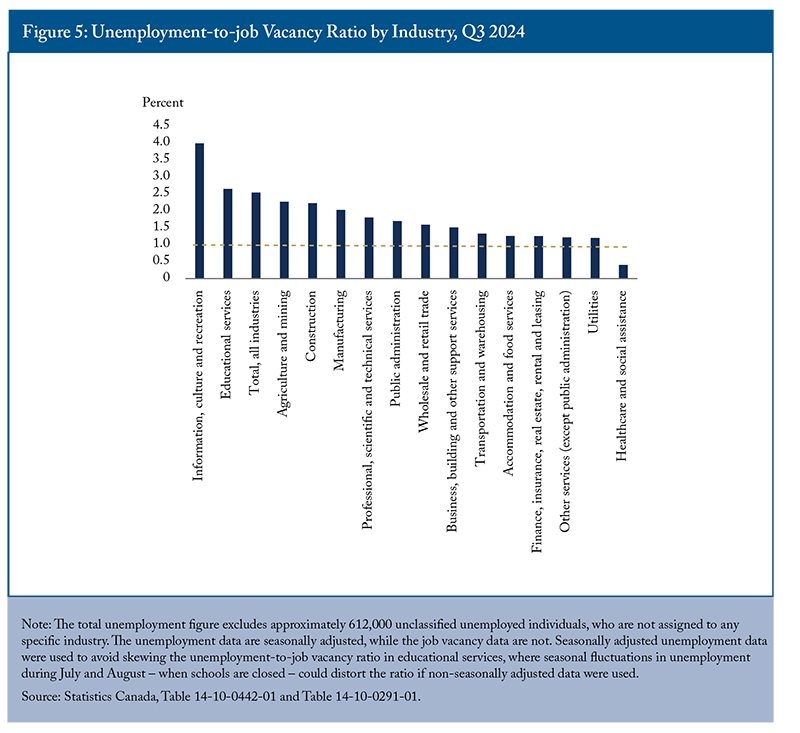
The unemployment-to-job vacancy ratios across industries excluded some 612,000 unclassified unemployed persons: those who had never worked before or were employed more than a year earlier. According to Statistics Canada, about 43 percent of job vacancies in the third quarter of 2024 were for entry-level positions, which is helpful for those unclassified unemployed persons as these roles typically do not require prior experience. However, the specific skills and education requirements of these entry-level positions remain unclear.
An analysis of educational requirements for vacancies in the same quarter shows that 48 percent of all job vacancies required post-secondary training or education. Positions requiring post-secondary education below a bachelor’s degree had an unemployment-to-job vacancy ratio of 2.6, while those requiring a bachelor’s degree or higher faced a higher ratio of 4.1. In contrast, vacancies requiring only a high-school diploma or less had a lower unemployment-to-job vacancy ratio of 1.8. However, employers find it more challenging to secure suitable candidates for positions requiring higher educational levels and specialized skills, particularly at wage levels that candidates are willing to accept.
Wages play an important role in reducing labour market imbalances, as they affect both the supply and demand for labour and encourage labour mobility and reallocation. Between Q4 2019 and Q3 2024, the average offered hourly wage saw the largest increases in industries such as arts and entertainment, agriculture, and information and cultural industries (over 30 percent). These sectors also experienced the most significant reductions in job vacancies, suggesting that offering higher wages can help alleviate labour shortages. To address shortages more broadly, there may also need to be a restructuring of relative wages and working conditions between occupations with labour shortages and those with surplus labour.
Offered wage, or stated salary, rates for vacant positions should largely depend on the growth of job vacancies and the difficulties in finding candidates to fill them. However, Figure 6 shows that industries experiencing a surge in vacancies post-pandemic did not respond consistently. In fact, the average hourly offered wage in these industries fell short of the national average, which was 27 percent between Q4 2019 and Q3 2024. For example, despite substantial growth in vacancies and a shortage of candidates in healthcare, the average offered wage growth in this industry only increased by 23 percent. This is largely due to government control over wages, making them less responsive to market forces. Policies like Ontario’s Bill 124, which capped annual wage increases at one percent for civil servants from 2019 to 2022, have contributed to this restraint. Additionally, multi-year labour contracts and provincial efforts to reduce deficits and debt post-COVID have further limited wage growth in the sector.
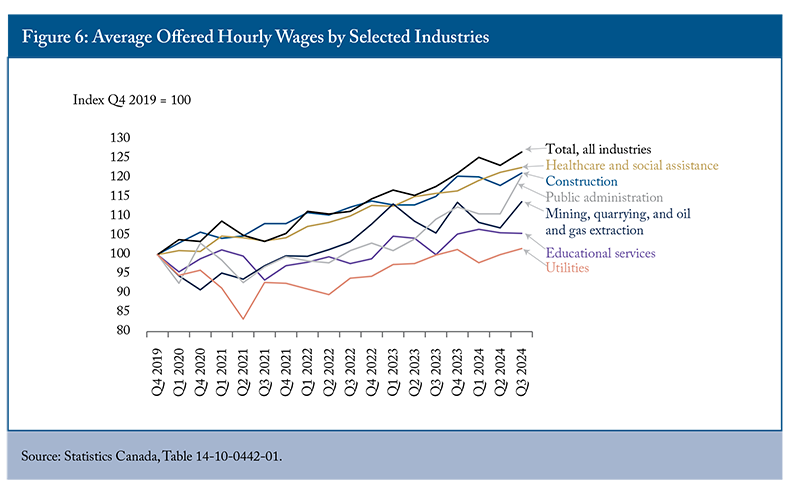
In Q3 2024, the average hourly offered wage in the utilities sector only increased by 2 percent compared to the pre-pandemic level, despite a 48 percent increase in job vacancies. Employers in this sector need to raise wages to attract and retain workers with the necessary skills. Otherwise, they will rely on their current workforce to work longer hours to maintain operations, which can lead to lower productivity per additional hour of work and retention challenges.
The average offered wage rate by occupation follows a similar trend (Appendix Figure A3). For example, despite a 59 percent increase in job vacancies, the wage rate for occupations in education, law and social, community and government services only rose by 16 percent, which is below the national average. This further highlights the need for employers to raise wages and improve working conditions to attract and retain workers.
Outcomes by Demographic Characteristics
While labour market indicators point to a strong post-pandemic recovery characterized by high employment, not all working-age Canadians have equally participated in and benefited from this resurgence, highlighting untapped potential across different population groups. Notably, recent demographic trends highlight that the older population and immigrants experience distinct labour market outcomes. Seniors (aged 65 and over) have substantially lower labour force participation rates compared to other demographics, raising concerns about both their economic security and potential contributions to the workforce. Additionally, immigrants frequently face employment barriers that limit their ability to fully integrate into the labour market and contribute to addressing the challenges posed by an aging population. Understanding the labour market outcomes for these groups is important for identifying the obstacles they face and formulating targeted policy recommendations to enhance their participation and success in the workforce.16
Age
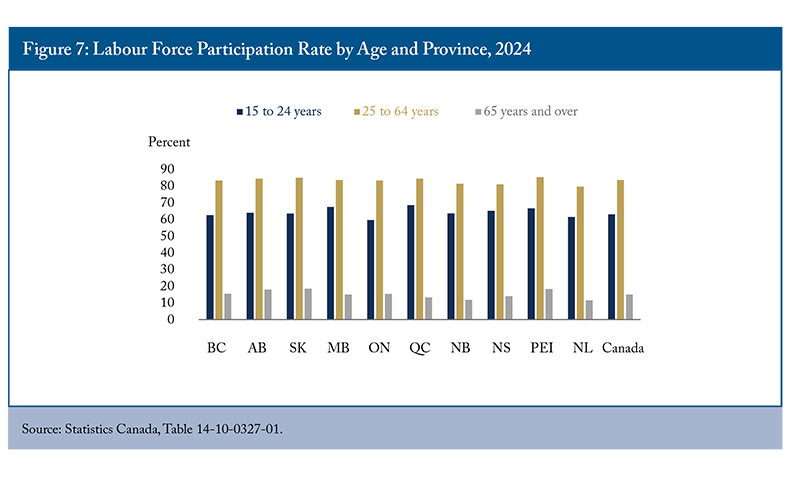
There are significant variations in labour force participation across age groups. As expected, seniors exhibit the lowest participation rates, with their engagement in the labour market declining substantially after age 65 (Figure 7). Seniors’ participation rate is low across all provinces, albeit with varying degrees. For instance, Saskatchewan has the highest participation rate for seniors at 18.5 percent, while Newfoundland and Labrador records a notably lower rate of 11.5 percent. The four provinces in the Atlantic region, where the aging problem is more severe, have the lowest participation rate. A lack of employment opportunities for seniors in this region seems to be a major driver, with their unemployment rate significantly higher than both the national average and their counterparts aged 25 to 64 (except for Nova Scotia) (Figure 8).

While seniors participate far less than other Canadians in the labour market, Figure 9 shows significant shifts in their average retirement age over time and notable differences across employment types. Self-employed workers consistently retire later than other workers, with their average retirement age exceeding 68 in recent years, while public sector workers tend to retire earlier. These trends likely reflect variations in pension structures, job security, and financial incentives across employment types. Between 1976 and 1998, the average retirement age of all workers declined by four years to 60.9, likely influenced by the introduction of early retirement pension schemes in order to free up jobs for younger workers (OECD 2017). However, this shift had no obvious impact on younger workers’ employment. Many economists also warned that these measures were shortsighted, as the aging of the baby boomer generation would eventually create new challenges. Meanwhile, concerns about the financial sustainability of pension systems grew due to the increasing life expectancy and subsequent rising costs of providing retirement income (Banks et al. 2010; Herbertsson and Orszag 2003; Jousten et al. 2008; Kalwij et al. 2010; OECD 2017).

In response, the federal government in 2012 increased financial penalties for early retirement to encourage longer working lives.17 Consequently, the average retirement age of all workers began to rise and reached 65.3 in 2024, slightly surpassing its 1976 level. However, the persistent gap between the public sector and self-employed workers suggests that policy adjustments – such as pension reform or incentives for longer careers in the public sector – could be considered to encourage more uniform retirement patterns across employment types. The recent influx of immigrants may also help to alleviate the impact of the retirement wave, as immigrants are more likely to keep working and retire later. According to Fan (2024), the average retirement age among immigrant workers is around 66 over the last decade, two years older than that for Canadian-born workers.
Accordingly, the LFPR of seniors has increased substantially from a historical low of 6 percent in 2001 to 15 percent in 2024. Termination of mandatory retirement, lack of sufficient savings, higher educational attainments, and better health conditions among seniors have contributed to these LFPR increases.18 Hicks (2012) predicts that social and economic pressures will lead to further delay in retirement in the future. For example, of all seniors aged 65 to 74, including both Canadian-born and immigrants, one in ten were employed in 2022 (Morissette and Hou 2024). Nine percent reported working by necessity, while immigrant seniors were more likely to do so than their Canadian-born counterparts.
In the long run, labour productivity growth is the primary driver of Canada’s GDP per capita growth, though the participation rate of seniors can also have a significant impact. Wang (2022) found that during the pandemic, declines in employment and participation rates driven by young people and seniors were major contributors to the sharp drop in GDP per capita. He estimated that if work intensity, the employment rate, and the participation rate had maintained their pre-pandemic momentum from 2010 onward, Canada’s GDP per capita could have been 4 percent higher in 2021 than it was.
As babyboomers are gradually retiring, their lower LFPR will continue to influence the overall participation rate. Vézina et al. (2024) found that the overall participation rate is expected to continue declining in the short term, regardless of the number of immigrants selected. Across various scenarios, the overall participation rate appears to be more sensitive to changes in the participation of seniors than to increases in immigration.19 As a result, keeping older workers, particularly those aged 55 and over, in the labour market could significantly impact the future overall participation rate. As more older workers remain employed, improvements in employment assistance, labour market flexibility, and skills upgrading will be essential (Vézina et al. 2024).
International Comparisons of Pension and Retirement Policies
An international comparison reveals that differences in pension and retirement policies play a crucial role in explaining disparities in employment and retirement decisions across countries (Figure 10). Factors such as the flexibility to choose between continuing to work or claiming a pension, legal provisions regarding age-based termination of employment, and employers’ retention strategies – such as offering on-the-job training and flexible work schedules – greatly influence retirement timing.

One of the most significant factors contributing to the variation in employment decisions across OECD countries is the normal age at which individuals can claim full pension benefits. For instance, in 2022, over 32 percent of Iceland’s population aged 65 and over was employed, although the normal retirement age is 67, with the earliest pension access at age 65. In contrast, only about 14 percent of Canada’s population in the same age group remained employed despite having a higher life expectancy. This discrepancy can be explained by Canada’s normal retirement age of 65, with pension benefits available as early as age 60.
Cross-country analyses show that policy reforms reducing financial incentives for early retirement were key drivers behind the increase in old-age employment (Coile et al. 2024). To address challenges related to aging populations, many countries such as Australia, Denmark, the UK, Japan and Italy have raised, or plan to gradually increase, the retirement age to encourage longer working lives. Denmark and Sweden have even indexed their mandatory retirement ages to life expectancy. Canada should consider similar approaches by raising the normal retirement age and delaying the earliest access age.
Immigrants
International immigration has significantly contributed to Canada’s population and labour force growth. Between 2019 and 2024, immigrants and non-permanent residents accounted for 68 percent of the population growth and over 88 percent of the increase in the labour force. However, immigrants often encounter various obstacles such as language barriers, a lack of Canadian work experience and varying recognition for foreign education and experience (Mahboubi and Zhang 2024). These challenges can limit their employment opportunities and earnings. Furthermore, as Canada faces an aging population, the challenge of integrating immigrants into the workforce becomes even more critical. While aging workers often possess valuable experience, they may struggle with the physical demands of certain jobs or require retraining. Newcomers, on the other hand, may not be immediately equipped to fill these gaps in employment. The productivity levels of immigrants can also be affected by their integration into the labour market, as they may require additional training and support to navigate workplace expectations and cultural nuances.
In 2024, immigrants aged 25 to 54 had a lower employment rate (by 4.3 percentage points) compared to non-immigrants (Figure 11). This gap has narrowed since 2006 and continued to decline even through the pandemic despite the latter’s greater impact on immigrants.20 The remaining gap is mainly due to the lower employment rate of female immigrants.
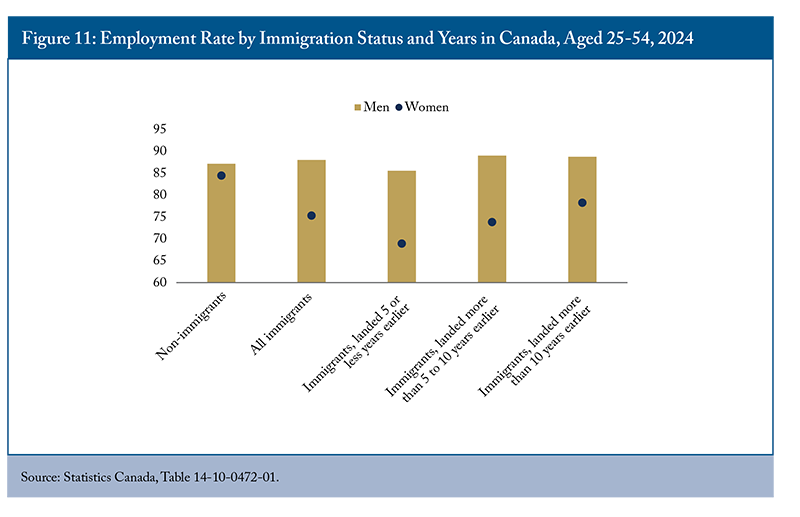
Employment outcomes of immigrants, particularly among women, depend predominantly on the number of years spent in Canada. For women aged 25-54, the employment gap between female non-immigrants and more recent immigrants (who landed less than 5 years) was 15.5 percentage points. This gap narrowed to 10.6 percentage points for immigrants who landed between 6 and 10 years and further to 6.2 percentage points for those who have been in Canada for more than 10 years.
Over the last decade, the improvements in immigrant employment rates are likely attributed to several factors. These include an increased selection of economic immigrants from non-permanent residents with Canadian work experience, the implementation of the Express Entry21 system for immigration selection, and favourable economic conditions where the demand and supply of immigrant labour are broadly aligned (Hou 2024). In addition, the growth in managerial, professional, and technical occupations accelerated in the late 2010s (Frenette 2023), which would benefit recent immigrants with a university education. Recent immigrants in the prime age group of 25 to 54 have seen faster employment rate growth since the early 2010s, with a notable increase of 13.1 percentage points from 2010 to 2024, compared to a 3.5 percentage point increase among non-immigrants.
However, it’s important to note that some of these conditions may change in the short term. For example, the employment rate for recent immigrants stalled from 2022 to 2023, a period when labour shortages eased, and levels of both permanent and non-permanent immigration rose rapidly (Hou 2024). As such, the dynamics of labour supply and demand have changed, particularly with the increases in the labour supply of new immigrants and non-permanent residents coupled with a cooling labour market and rising unemployment. This could negatively affect the employment outcomes of foreign-born residents in Canada more than those of Canadian-born individuals, as immigrants are often disproportionately affected during economic downturns. In 2024, there was a large increase in the unemployment rate of recent permanent immigrants, rising from 8 percent in 2023 to 9.9 percent. This is more than double the unemployment rate of non-immigrants, indicating the difficulties recent immigrants face in securing employment.
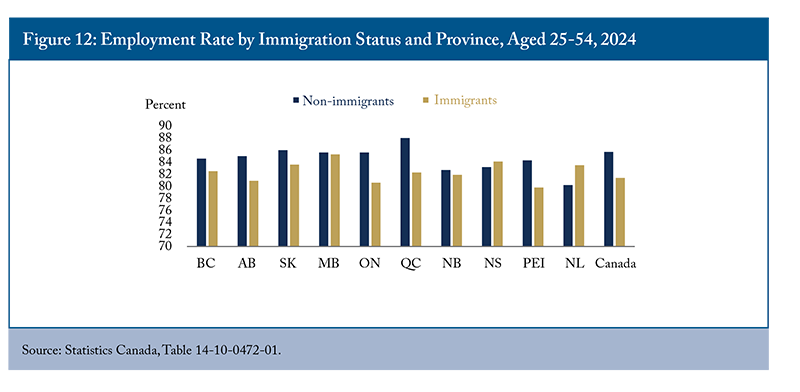
The employment rate of immigrants residing in some provinces is lower than the national rate, such as Ontario and PEI (Figure 12). The relatively poor employment outcomes among immigrants in these provinces may stem from specific employment barriers unique to immigrants, as the unemployment rate of non-immigrants in these provinces remains below the national rate. However, immigrants in Newfoundland and Labrador have a higher employment rate than non-immigrants. In contrast, the employment gap between immigrants and non-immigrants is most pronounced in Quebec, a province with the highest employment rate for non-immigrants in Canada. This gap can, to some extent, be due to a large gap in the unemployment rates of these two population groups. The unemployment rate of immigrants in Quebec is twice that of non-immigrants (or a gap of 3.5 percentage points). Grenier and Nadeau (2011) show that the lack of knowledge of French largely explains why the employment rate gap between immigrants and non-immigrants is larger in Montreal than in Toronto. Greater emphasis on official language training could enhance their ability to fully participate in the local labour market.
Policy Discussion
While the Canadian labour market has shown resilience post-pandemic and continued to perform relatively well in 2024, significant disparities across regions, industries, and demographic groups highlight opportunities to improve participation and employment outcomes. Further, Canada’s declining productivity poses a challenge to the labour market’s ability to drive sustained economic growth and competitiveness.
Demographic shifts, particularly an aging population, continue to affect participation rates and contribute to some shortages. Notably, the expansion of the health industry and the associated labour shortages are closely tied to Canada’s aging population. However, in some industries, average offered wages have not risen enough to attract a larger labour supply, and employers have not sufficiently adopted alternative strategies, such as capital investment and automation, to address their workforce needs.
Addressing these challenges requires a holistic approach. Beyond automation and higher wages, investing in existing workers and removing barriers to labour-market participation by underrepresented groups – such as women, youth, Indigenous Peoples, and seniors – can significantly improve labour market outcomes.
Regional differences in economic conditions contribute to provincial variations in the participation of seniors, while differences in pension and retirement policies play an important role in driving discrepancies in retirement timing across countries. Gradually increasing the normal retirement age is a strategy adopted by some countries to encourage later retirement among seniors. In Canada, the federal government in Budget 2019 offered a way to make later retirement financially more attractive by increasing the Guaranteed Income Supplement (GIS) earnings exemption, allowing seniors to retain more of their increased income if they choose to work. However, provincial measures aimed at boosting older workers’ labour force participation have had mixed results. For instance, Lacroix and Michaud (2024) found that a tax credit in Quebec designed to boost employment among older workers had no significant impact on transitions in or out of the labour force, with only modest effects on earnings for those aged 60 to 64. The study concluded that this measure was not a cost-effective way to increase public revenue or employment rates for older workers.
While the Conservative government in 2012 announced a plan to gradually raise the eligibility age for Canada’s Old Age Security benefits from 65 to 67 starting in 2023, the newly elected Liberal government cancelled the plan in 2016. However, with an aging population and increasing longevity, Canada should reconsider gradual adjustments to the normal retirement age and the earliest access age to help sustain public pension systems and ease demographic pressures. This approach aligns with successful international models, though it requires careful implementation to account for differences in job types and income levels.
Seniors today are healthier and living longer, and delaying retirement can offer both personal and economic benefits and ease demographic transitions (Robson and Mahboubi 2018). Longer working lives allow individuals to accumulate greater retirement savings, reducing the risk of financial insecurity in old age. Working longer has also been linked to better cognitive function, mental well-being, and social engagement.
That said, raising the retirement age would affect workers differently depending on their occupations and financial situations. While high-income, knowledge-based workers may benefit from extended careers through flexible work arrangements or hybrid options, many low-income workers in physically demanding jobs – such as those in construction, manufacturing, or caregiving – may find it challenging to work longer. Policies promoting flexible work options, lifelong learning initiatives, and encouraging and monitoring training program uptake22 can help older workers stay in the workforce longer and maintain their skills (Mahboubi and Mokaya 2021).23 Targeted support, such as enhanced workplace accommodations, phased retirement options, and retraining programs for workers in physically demanding jobs, could ensure that a later retirement age does not disproportionately burden lower-income individuals.
In response to population aging and existing labour shortages, Canada has increasingly relied on higher levels of immigration. However, the overqualification of immigrants’ skills and credentials, particularly among those from non-Western countries, remains a persistent issue. The successful integration of newcomers into the workforce is important to mitigate the short-term impact of an aging population on the labour market and enhance productivity. For example, recognizing the credentials of foreign-trained professionals in fields like healthcare could increase their productivity and earnings, helping to address the chronic shortage of healthcare workers. However, many skilled immigrants hold qualifications in regulated fields overseen by provincial regulatory bodies, which creates considerable barriers to entering the labour market. While these regulations aim to uphold public safety, they differ among provinces. Over the past few years, several provincial governments have taken steps to reduce barriers for foreign-trained immigrants. For instance, British Columbia and Nova Scotia have expedited credential assessments for foreign-trained healthcare professionals, which helped expand their healthcare workforce. Other provinces should consider adopting similar initiatives.
Licensed workers, either immigrants or non-immigrants, in these occupations also face barriers if they wish to change their province of residence. Easing provincial labour mobility in regulated professions could help reduce regional labour shortages in these sectors. Ensuring immigrants’ skills and qualifications are recognized and accepted by employers is also important.
Canada also needs to adopt more effective settlement strategies, with a strong emphasis on improving language proficiency for immigrants who struggle with communication skills. Language training tailored to workplace culture can also bridge language gaps and help newcomers obtain licences to integrate into the labour market. A notable example is the Health English Language Pro (HELP) program, which was launched by ACCES Employment to support internationally educated physicians. The program pairs Canadian physician volunteers with internationally trained medical graduates to help them acquire the necessary medical English skills. Furthermore, in recent years, the expansion of language training facilities has not kept pace with the explosive increase in the number of permanent and temporary immigrants. Governments need to systematically evaluate settlement service agencies to assess the returns on investment and enhance the effectiveness of these services in the labour market.
In addition to reducing regional disparities and improving labour market fluidity – making it easier for workers to transition between jobs – Canada should also focus on increasing GDP per capita by encouraging greater capital investment (Robson, Kronick and Kim 2019; Gu 2024; Robson and Bafale 2023 and 2024) and promoting the adoption of new technologies (e.g., AI, robotics, and automation), with a focus on increasing productivity and complementing the skills of the existing workforce.
Canada’s labour productivity has declined recently – a worrisome trend. Enhancing labour productivity involves addressing skill shortages, overqualification and mismatches. Policies that encourage training and promote automation, as well as higher wages in high-demand sectors, are essential. The potential of AI should also be explored to support labour productivity and mitigate skills and labour shortages (Mahboubi and Zhang 2023). However, it is equally important to provide support for the displacement of low-skilled workers who may be impacted by automation. Governments and employers should focus on training programs that align with the evolving demands of the labour market, including reskilling and upskilling initiatives for those at risk of displacement.
Conclusion
Addressing the challenges of an aging population, a lower senior participation rate, the overqualification of immigrants’ skills, and declining labour productivity requires comprehensive and targeted policy interventions. Canada’s labour market will benefit from proactive measures that support both its existing workforce and newcomers while addressing the demographic pressures ahead.
To ensure sustainable economic growth and greater labour market participation, the following policy actions should be considered:
- The federal government should gradually raise the normal retirement age to 67 and assess the benefits of delaying the earliest access age for pension benefits, in line with successful international models.
- Provincial governments should adopt targeted policies to support older workers, such as promoting flexible work arrangements, part-time career opportunities, and self-employment options, particularly in regions like the Atlantic provinces, where senior participation is notably low.
- All levels of government should invest in high-quality training programs that equip individuals with the skills needed for the evolving labour market, such as digital skills and job search strategies, with a focus on underrepresented groups like seniors, Indigenous Peoples, and youth.
- Provinces and regulatory bodies should collaborate to streamline the licensing process for skilled immigrants, enabling foreign-trained professionals to meet local regulatory requirements more efficiently. They should also work together to ease labour mobility in regulated occupations, ensuring that qualifications are recognized across regions without compromising service quality.
- The federal government should invest in enhancing settlement strategies for immigrants, including providing language training tailored to workplace culture. It is also important to evaluate the effectiveness of existing programs to ensure they adequately support newcomers’ integration into the workforce.
- Employers, in collaboration with governments, should integrate automation and advanced technologies such as AI to boost productivity while ensuring that workers’ skills align with the evolving demands of the economy.
By implementing these policies, Canada can better navigate labour market imbalances, enhance its labour force participation, and position itself for sustainable economic growth in the face of demographic and technological change.
Appendix

For the Silo, Parisa Mahboubj / Tingting Zahn.
The authors extend gratitude to Pierre Fortin, Mikal Skuterud, Steven Tobin, William B.P. Robson, Rosalie Wyonch, and several anonymous referees for valuable comments and suggestions. The authors retain responsibility for any errors and the views expressed.
References
Acemoglu, Daron, and Pischke, Jörn-Steffen. 1999. “The structure of wages and investment in general training.” Journal of Political Economy 107(3): 539-572.
Banks, James, et al. 2010. “Releasing Jobs for the Young? Early Retirement and Youth Unemployment in the United Kingdom.” In Social Security Programs and Retirement around the World: The Relationship to Youth Employment. University of Chicago Press, pp. 319-344.
Busby, Colin, and Ramya Muthukumaran. 2016. Precarious Positions: Policy Options to Mitigate Risks in Non-standard Employment. Commentary. Toronto: C.D. Howe Institute. December.
Casey, Bernard. 1998. “Incentives and Disincentives to Early and Late Retirement.” Working Paper AWP3.3. Paris: OECD.
Coile, Courtney, David Wise, Axel Börsch-Supan, Jonathan Gruber, Kevin Milligan, Richard Woodbury, Michael Baker, James Banks, Luc Behaghel, Melika Ben Salem, Paul Bingley, Didier Blanchet, Richard Blundell, Michele Boldrín, Antoine Bozio, Agar Brugiavini, Tabea Bucher-Koenen, Raluca Elena Buia, Eve Caroli, Naohiro Yashiro. 2025. “Social Security and Retirement around the World: Lessons from a Long-term Collaboration.” Journal of Pension Economics and Finance 24: 8-30.
Coile, Courtney, Kevin S. Milligan, and David A. Wise. 2018. “Social Security Programs and Retirement Around the World: Working Longer – Introduction and Summary.” National Bureau of Economic Research. Working Paper 24584. May.
Employment and Social Development Canada. 2023. “Canadian Occupational Projection System (COPS)-Information Documents.” Available at: https://occupations.esdc.gc.ca/sppc-cops/libdetails.jsp?lang=en&fbc=Y
Fan, Claire. 2024. “Immigrants participation in the labour force surpasses those born in Canada.” RBC Thought Leadership. Available at: https://thoughtleadership.rbc.com/proof-point-immigrants-participation-in-the-labour-force-surpasses-those-born-in-canada/?utm_medium=johnsocial&utm_source=linkedin.com&utm_campaign=Econ
Fortin, Pierre, 2024. “Does immigration help alleviate economy-wide labour shortages?” CLEF Working Paper Series 70, Canadian Labour Economics Forum (CLEF), University of Waterloo.
Fortin, Pierre, 2025. The Immigration Paradox: How an Influx of Newcomers Has Led to Labour Shortages. Commentary 677. Toronto: C.D. Howe Institute. February.
Gagnon, Morgan, Sithandazile Kuzviwanza. 2023. “Mapping Employment Supports for Québec’s Racialized and Immigrant English-speaking Communities.” Provincial Employment Roundtable (PERT). July.
Grenier, Gilles, and Serge Nadeau. 2011. “Immigrant access to work in Montreal and Toronto.” Canadian Journal of Regional Science 34(1): 19-32.
Gu, Wulong. 2024. “Investment Slowdown in Canada After the Mid-2000s: The Role of Competition and Intangibles.” Statistics Canada. DOI: https://doi.org/10.25318/11f0019m2024001-eng
Guillemette, Yvan. 2006. “Misplaced Talent: The Rising Dispersion of Unemployment Rates in Canada.” E-Brief 33. Toronto: C.D. Howe Institute.
Haun, Chris. 2023. “A Detailed Analysis of Canada’s Post-2000 Productivity Performance and Pandemic-Era Productivity Slowdown.” Center for the Study of Living Standards. Available at https://www.csls.ca/reports/csls2023-11.pdf
Herbertsson, Tryggvi Thor, and Mike Orszag. 2003. “The Early Retirement Burden: Assessing the Costs of the Continued Prevalence of Early Retirement in OECD Countries.” IZA Discussion Paper, No. 816, July.
Holland, Brian. 2018. “Defining and Measuring Workforce Development in a Post-Bipartisan Era.” GLO Discussion Paper Series # 234, Global Labour Organization (GLO).
___________. 2019. “The Design and Uses of an Employability Index to Evaluate the Vertical Workforce Development Process.” New Horizons in Adult Education and Human Resource Development 31(2): 41-59.
Hou, Feng. 2024. “The improvement in the labour market outcomes of recent immigrants since the mid-2010s.” Statistics Canada. February. DOI: https://doi.org/10.25318/36280001202400200004-eng
Jousten, Alain, Mathieu Lefèbvre, Sergio Perelman,and Pierre Pestieau. 2010. “The Effects of Early Retirement on Youth Unemployment: The Case of Belgium.” In Social Security Programs and Retirement Around the World: The Relationship to Youth Employment. University of Chicago Press, pp. 47-76.
Kalwij, Adriaan, Arie Kapteyn and Klass de Vos. 2010. “Retirement of Older Workers and Employment of the Young.” De Economist 158 (4): 341-359.
Lacroix, Guy, and Pierre-Carl Michaud. 2024. “Tax Incentives and Older Workers: Evidence from Canada.” HEC Montreal. Working Paper. September.
Lefebvre, Pierre, and Philip Merrigan. 2008. “Child-Care Policy and the Labour Supply of Mothers with Young Children: A Natural Experiment from Canada.” Journal of Labour Economics 26 (3): 519-48.
Lu, Yuqian, and Feng Hou. 2023. “Foreign workers in Canada: Distribution of paid employment by industry.” Statistics Canada. DOI: https://doi.org/10.25318/36280001202301200005-eng
Mahboubi, Parisa. 2017a. The Power of Words: Improving Immigrants’ Literacy Skills. Commentary 486. Toronto: C.D. Howe Institute. May.
___________. 2017b. “Talkin’ ‘Bout My Generation: More Educated, But Less Skilled Canadians.” E-Brief. Toronto: C.D. Howe Institute.
___________. 2024. Quality Over Quantity: How Canada’s Immigration System Can Catch Up With Its Competitors. Commentary 654. Toronto: C.D. Howe Institute. February.
Mahboubi, Parisa, and Amira Higazy. 2022. Lives Put on Hold: The Impact of the COVID-19 Pandemic on Canada’s Youth. Commentary 624. Toronto: C.D. Howe Institute. July
Mahboubi, Parisa, and Momanyi Mokaya. 2021. The Skills Imperative: Workforce Development Strategies Post-COVID. Commentary 609. Toronto: C.D. Howe Institute.
Mahboubi, Parisa, and Tingting Zhang. 2023. Empty Seats: Why Labour Shortages Plague Small and Medium-Sized Businesses and What to Do About It. Commentary 648. Toronto: C.D. Howe Institute. November.
___________. 2024. Harnessing Immigrant Talent: Reducing Overqualification and Strengthening the Immigration System. Commentary 672. Toronto: C.D. Howe Institute.
Mischke, Jan, Chris Bradley, Marc Canal, Olivia White, Sven Smit, and Denitsa Georgieva. 2024. “Investing in productivity growth.” McKinsey Global Institute. Available at: https://www.mckinsey.com/mgi/our-research/investing-in-productivity-growth?stcr=7A4A10A6D14341799125FD0D945DE5F4&cid=other-eml-alt-mip-mck&hlkid=72faf5b1056a4da5913de34ab992272c&hctky=13711536&hdpid=0f032b80-145b-4cc4-995d-dc2ef7d9468d
Morissette, René, and Feng Hou. 2024. “Employment by choice and necessity among Canadian born and immigrant seniors.” Statistics Canada. DOI:
https://doi.org/10.25318/36280001202400400002-eng
Organisation for Economic Co-operation and Development (OECD). 2017. Pensions at a Glance 2017: OECD and G20 Indicators. Paris: OECD Publishing. Retrieved from: https://www.oecd.org/en/publications/pensions-at-a-glance-2017_pension_glance-2017-en.html
OECD. 2024. Education at a Glance 2024: OECD Indicators. OECD Publishing. Paris. https://doi.org/10.1787/c00cad36-en
______. 2022. What has been the impact of the COVID-19 pandemic on immigrants? An update on recent evidence. OECD Publishing. Paris. https://doi.org/10.1787/65cfc31c-en
______. “Online OECD Family database.” OECD Publishing. Paris. Retrieved from: https://www.oecd.org/els/family/database.htm
Pastore, Francesco. 2018. “Why is youth unemployment so high and different across countries?” IZA World of Labour. Available at: https://wol.iza.org/articles/why-is-youth-unemployment-so-high-and-different-across-countries
Picot, Garnett, and Feng Hou. 2024. “Immigration and the shifting occupational distribution in Canada, 2001 to 2021.” Statistics Canada. DOI: https://doi.org/10.25318/36280001202400300006-eng
Picot, Garnett, and Tahsin Mehdi. 2024. “The Provision of Higher- and Lower-skilled Immigrant Labour to the Canadian Economy.” Statistics Canada. DOI: https://doi.org/10.25318/36280001202400900005-eng
Robson, William B.P. 2019. Thin Capitalization: Weak Business Investment Undermines Canadian Workers. Commentary 550. Toronto: C.D. Howe Institute. August.
Robson, William B.P., and Mawakina Bafale. 2024. Underequipped: How Weak Capital Investment Hurts Canadian Prosperity and What to Do about It. Commentary 666. Toronto: C.D. Howe Institute. September.
Robson, William B.P, and Mawakina Bafale. 2023. Working Harder for Less: More People but Less Capital Is No Recipe for Prosperity. Commentary 647. Toronto: C.D. Howe Institute. June.
Robson, William B.P., and Parisa Mahboubi. 2018. “Inflated Expectations: More Immigrants Can’t Solve Canada’s Aging Problem on Their Own.” E-Brief. Toronto: C.D. Howe Institute. November.
Robson, William B.P., Jeremy Kronick and Jacob Kim. 2018. Tooling Up: Canada Needs More Robust Capital Investment. Commentary 520. Toronto: C.D. Howe Institute. September.
Rogers, Carolyn. 2024. “Time to break the glass: Fixing Canada’s productivity problem.” Bank of Canada. Available at: https://www.bankofcanada.ca/2024/03/time-to-break-the-glass-fixing-canadas-productivity-problem/
Schimmele, Christoph, and Feng Hou. 2024. “Trends in Education–Occupation Mismatch among Recent Immigrants with a Bachelor’s Degree or Higher, 2001 to 2021.” Statistics Canada. May 22. DOI: https://doi.org/10.25318/36280001202400500002-eng
Skuterud, Mikal. 2023. “Canada’s Missing Workers: Temporary Residents Working in Canada.” E-Brief 345. Toronto: C.D. Howe Institute. September.
Skuterud, Mikal. 2025. “The Growing Data Gap on Canada’s Temporary Resident Workforce.” E-Brief 367. Toronto: C.D. Howe Institute. February.
Statistics Canada. 2022. “The COVID-19 pandemic disrupted the economic integration of many immigrants.” The Daily. December 5. Available at https://www150.statcan.gc.ca/n1/en/daily-quotidien/221205/dq221205b-eng.pdf?st=V29agyBR
Vézina, Samuel, Jean-Dominique Morency, Laurent Martel and François Pelletier. 2024. “Canadian Labour Force: What Will Happen Once Baby Boomers Retire?” Statistics Canada. Available at https://www150.statcan.gc.ca/n1/pub/75-006-x/2024001/article/00005-eng.htm
Wang, Weimin. 2022. “The COVID-19 Pandemic and Gross Domestic Product Per Capita Growth in Canada.” Statistics Canada. DOI: https://doi.org/10.25318/36280001202200500002-eng
Yong, Rebekah, and René Lalonde. 2024. “Raising the Bar, Not Just Lowering the Number: Canada’s Immigration Policy Confronts Critical Choices.” Scotiabank. Available at https://www.scotiabank.com/ca/en/about/economics/economics-publications/post.other-publications.insights-views.canada-s-immigration-policy–march-21–2024-.html




 For the Silo,


 In his new book, Four Days to Change, Welp provides the solution to systemic inequality through a comprehensive approach including diversity consulting, experiential learning, and leadership development. He also adds that all efforts should lead to tangible action and measurable results.


