Newcomers increase consumption and spending, and are actually contributing to demand for labour in other sectors.
Study in Brief
- This study investigates the effects of Canada’s expansive immigration policy, implemented between 2016 and 2024, on labour shortages. It explores how the influx of permanent and temporary immigrants has affected the balance between labour supply and demand, with attention to whether the policy has met one of its key objectives – alleviating shortages in labour markets.
- It provides an analysis of labour market dynamics through the lens of the Beveridge curve, which tracks the joint path of unemployment and job vacancies over time. The study compares labour market tightness before, during, and after the pandemic and evaluates how rapidly rising immigration and the adoption of remote work have affected job vacancy rates in Canada.
- The arrival of immigrant workers has expanded the supply of labour to employers, but has also generated additional income and spending, and hence greater demand for labour throughout the economy. The macroeconomic evidence from this study indicates that, on balance, the increase in demand generated by immigration has more than likely outpaced the additional supply, potentially making economy-wide labour shortages more widespread rather than alleviating them.
Introduction
Canada’s immigration levels began to accelerate in 2016, following a period of relative stability. From 2001 to 2015, the annual inflow of immigrants, including both permanent and temporary admissions, was reasonably stable at around 0.85 percent of the overall population. In the following years, despite a temporary contraction during the pandemic, this rate rose fourfold, reaching up to 3.2 percent of the population in 2023.
This post-2015 expansion was consistent with recommendations from the Advisory Council on Economic Growth, established by Minister of Finance Bill Morneau in 2016. The Council’s 2016 report suggested that the annual number of permanent economic immigrants should be increased from 300,000 in 2016 to 450,000 in 2021, and to nearly double this number later. Its stated objectives were to increase population growth, reduce the old age dependency ratio, generate a bigger GDP, and accelerate the rise in real GDP per capita by easing shortages of high-skilled workers and other means. Policymakers, encouraged by the perceived success of Canada’s immigration program, embraced the idea that higher immigration levels could deliver even greater economic and demographic benefits.1 The Council also urged the government to facilitate admissions of temporary workers and attract more international students. The government responded by increasing permanent immigration levels from 270,000 in 2015 to 480,000 in 2024, allowing uncapped increases in temporary immigration, and trying to address shortages of low- as well as high-skilled labour.
The C.D. Howe Institute’s research has shown that the benefits of immigration in mitigating population aging, and supporting the growth of GDP per capita, have been more limited than expected (Mahboubi and Robson 2018; Doyle, Skuterud and Worswick 2024). The present study is an attempt to assess whether the policy has succeeded in meeting the goal of easing the challenges employers face in finding suitable candidates for their job openings. The answer to this question has clearly been a big “yes” at the level of the individual employer. Many employers are benefiting from the contribution of their new immigrant workers, which is the basis for the unrelenting support for more immigration by representative national business organizations.
It is less clear whether immigration has helped alleviate labour shortages in the overall economy. Immigration not only expands the supply of labour, but also adds to the demand for labour. Putting more immigrants to work generates an expansionary multiplier effect on gross domestic product (GDP) and national income. As the additional income is spent on various consumption and investment goods by households, businesses and governments, the demand for labour increases. The net effect of immigration on the difference between supply and demand in the aggregate economy is, therefore, a priori uncertain. It could be negative or positive.
My goal in this study is to uncover what simple economic logic, and the statistical evidence from Canadian macrodata, reveal about the direction and quantitative importance of the net effect of rising immigration on the economy-wide balance between the demand for, and the supply of, labour. I find that the demand has likely matched or exceeded the supply and has therefore increased the overall job vacancy rate at any given level of unemployment.
Labour Shortages and Job Vacancies
What do “labour shortages” mean, and how have they evolved since Canada’s immigration rate began to increase eight years ago? Employers feel they are short of labour when the number of unfilled job openings significantly exceeds the number of available employees with the necessary skills and qualifications to meet their operational needs. Each month, Statistics Canada reports the extent of labour shortages in various sectors and regions from its Job Vacancy and Wage Survey. It is called the “job vacancy rate” and is an estimate of the number of job vacancies as a percentage of total labour demand, including all occupied and vacant salaried jobs.
Data on the job vacancy rate have been available since 2015 (Figure 1). After the oil-induced economic slowdown of 2014-2015, job vacancies increased from 2.3 percent of labour demand in mid-2016 to 3.3 percent in early 2020. No vacancy data were available from April to September 2020 due to a six-month pandemic-related pause in Statistics Canada’s survey. Moving through the spring 2020 recession, but with the unemployment rate still very high, job vacancies then increased swiftly, reaching a peak of 5.7 percent of all occupied and vacant jobs in the second quarter of 2022. But with the economic slowdown and slackened labour markets subsequently accompanying high interest rates, vacancies fell back to 3.0 percent of labour demand in the third quarter of 2024.

Immigration and Labour Supply and Demand
Since 2015, Canada’s job vacancy rate has fluctuated in response to three key macroeconomic factors: rising immigration, the pandemic, and fluctuations in aggregate economic activity.
Immigration has risen steadily in recent years, with both permanent and temporary entries increasing in each non-pandemic year (Figure 2). Permanent admissions rose from 272,000 in 2015 to 472,000 in 2023. This upward trend was guided by the multi-year immigration-level targets set each year since 2017 by the government in its Annual Report to Parliament on Immigration. For example, the target for permanent admissions in 2023 was set at 465,000 in the 2022 Report.
Temporary immigration includes holders of study or temporary work permits, asylum seekers, and their family members. They are collectively referred to as “non-permanent residents” by Statistics Canada. Prior to 2024, temporary immigration was excluded from the government’s annual targets. It was uncapped and followed demand from businesses and educational establishments. The net annual addition to temporary permits (new entries less exits to permanent residence and to abroad) rose from basically zero in 2015 to 190,000 in 2019, and 821,000 in 2023 (Figure 2).

Overall, total immigration – the sum of permanent and temporary immigration – increased fivefold from 263,000 in 2015, to 1,293,000 in 2023. Was this fivefold surge in immigration over eight years able to lower the job vacancy rate and reduce labour shortages in the aggregate Canadian economy? How could it not? Prima facie, the arrival of new immigrant workers increases the supply of labour, allowing recipient employers to ameliorate their personnel gap, at least in part. The addition of immigrant labour might suggest the “common sense” inference that labour scarcity has been effectively eased up throughout the economy.
However, it is erroneous to assume that simply because immigration solves the personnel shortage of individual employers, it will necessarily solve the problem of labour scarcity in the aggregate economy.
The error comes from focusing narrowly on increasing the supply of labour, while neglecting the simultaneous increase in the demand for labour that is generated by immigration. With more immigrants in the workforce, employers can produce more goods and services and generate more income for themselves, their employees, and their suppliers – a good thing. However, to assess the overall effect of immigration on labour scarcity, it is crucial to consider that this additional income will be spent on various consumer and investment goods. Immigrants allocate their new income, along with any savings brought from abroad, to essentials such as food, clothing, housing, transportation, personal care, and leisure. In turn, employers and their chains of suppliers invest more in construction, machinery and intellectual property. Furthermore, immigrants, employers and suppliers all contribute to taxes, which governments allocate to meet the increased demand for social services, including public housing, education, and healthcare. The growing demand for private and public goods and services will expand aggregate labour demand.
In other words, the hiring of immigrants initially adds to the supply of labour, but it also ends up adding to the demand for labour once the new income generated is spent throughout the economy and a multiplier effect is generated on GDP. On net, it is a priori uncertain whether the supply increases more than the demand, in which case labour would be made less scarce overall, or whether it is the demand that increases more than the supply, in which case labour would be made scarcer.
As a first attempt to clarify the picture, let us see how the excess of labour supply over labour demand evolved from 2016 to 2024 (Figure 3). I take labour supply to be the entire labour force (all workers who are employed or are looking for work), and labour demand to be the sum of employment and job vacancies (all jobs that are occupied or ready to be filled). Expressed as a percentage of the labour force, the difference between the two – excess supply – boils down to the difference between unemployment and job vacancies. Excess supply goes up or down depending on whether unemployment increases more or less than job vacancies.
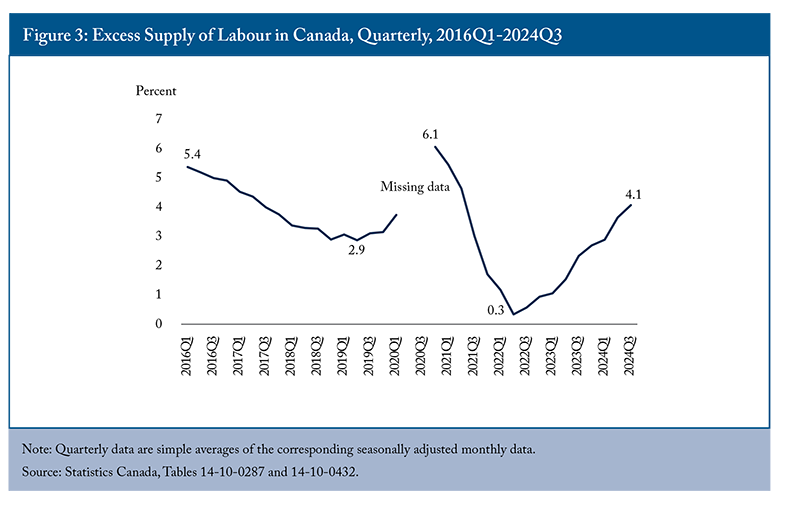
Figure 3 shows that the excess supply of labour has fluctuated widely since 2016. In the pre-pandemic period 2016-2019, it declined from 5.4 percent to 2.9 percent of the labour force. Labour became scarcer. During the pandemic year 2020, it shot up to 6.1 percent of the labour force. But in the aftermath, labour demand outpaced supply again so that by mid-2022 excess supply had dropped to a low of 0.3 percent of the labour force. Since then, it has risen back to 4.1 percent.
The time path of the excess supply of labour cannot alone determine whether the rise in immigration since 2016 has increased labour supply more or less than labour demand. Excess supply results from the interplay of three simultaneous determinants: rising permanent immigration and accelerating temporary immigration, the disruptions caused by the pandemic and its potential after-effects, and fluctuations in aggregate activity. For example, the declining excess supply in the pre-pandemic period 2016-2019 was the combined outcome of rising immigration and aggregate economic expansion. But the impact of rising immigration cannot be separated out from that of aggregate economic expansion by just looking at the trend in excess supply. Correctly identifying the net effect of each of the two factors requires a more comprehensive economic and statistical analysis of the data.
The Shifting Beveridge Curve
To identify the net effect of immigration on labour shortages, I will use a well-established tool called the Beveridge curve. The Beveridge curve offers valuable insights by highlighting the observed inverse relation between vacancies and unemployment.
William Beveridge (Beveridge 1960) used the unemployment rate as a main marker of fluctuations in aggregate activity, a practice business cycle analysts still follow to this day (Romer and Romer 2019; Hazell et al. 2022). He observed that vacancies and unemployment typically move in opposite directions through business cycles. He attributed the negative relationship to the pressure exerted by aggregate activity on economic potential. When aggregate economic activity was moving up to its full potential (as in Canada in 2016-2019), there were fewer unemployed workers and more job vacancies. Conversely, when activity was moving away from potential (as in Canada in 2023-2024), there were more unemployed workers and fewer job vacancies. Since 1960, this inverse relation between the job vacancy rate and the unemployment rate – now called the Beveridge curve – has played a key role in macroeconomic analysis of labour markets. It has been abundantly studied by researchers and has been identified in job vacancy and unemployment data in many countries (e.g., Blanchard and Diamond 1989; Pissarides 2000; Archambault and Fortin 2001; Elsby, Michaels and Ratner 2018; Michaillat and Saez 2021).
It is instructive to examine the trajectory of the Canadian unemployment – job vacancy relation in two-dimensional space from 2015 to 2024 (Figure 4). First, following the 2015 economic slowdown, the economic expansion of 2016-2019 brought a decrease in the unemployment rate and an increase in the job vacancy rate along a path that was consistent with a negatively sloped Beveridge curve. The sudden outbreak of the pandemic in early 2020 shattered this trajectory. The unemployment – job vacancy pair was sent far outward toward the northeast corner of the chart. From then until the end of 2021, it followed a new Beveridge curve to the northwest. During the recovery following the pandemic recession in the spring quarter of 2020, the unemployment rate decreased and the job vacancy rate increased along a path that was about parallel to that of 2015-2019, but at a much higher level. For instance, whereas the unemployment rate was the same in the summer quarter of 2021 as in the winter quarter of 2016 (7.25 percent), the job vacancy rate was twice as large in the former (4.2 percent) as it was in the latter (1.9 percent). Finally, as the pandemic faded, the unemployment – job vacancy pair did a loop to the west. A new post-pandemic Beveridge curve emerged along a southeasterly trend that looked parallel to, but somewhat higher than, the old pre-pandemic path of 2015-2019.2
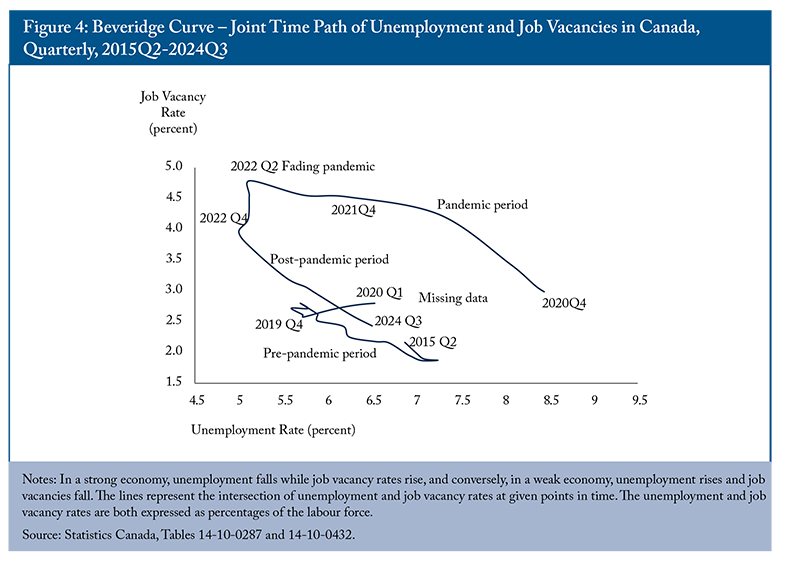
This visual check reveals that there have been three distinct periods in the inverse relationship between job vacancies and unemployment, known as the Beveridge curve: pre-pandemic, pandemic and post-pandemic. The start and end of the pandemic significantly affected the vertical position of the Beveridge curve in the unemployment – job vacancy space. Although the three branches are not perfectly aligned, they appear to be nearly parallel. According to the statistical results in Table 1 below, a one percent change in the unemployment rate corresponds to about a 1.5 percent change in the opposite direction in the vacancy rate – this is sometimes referred to as the Beveridge curve “elasticity.”
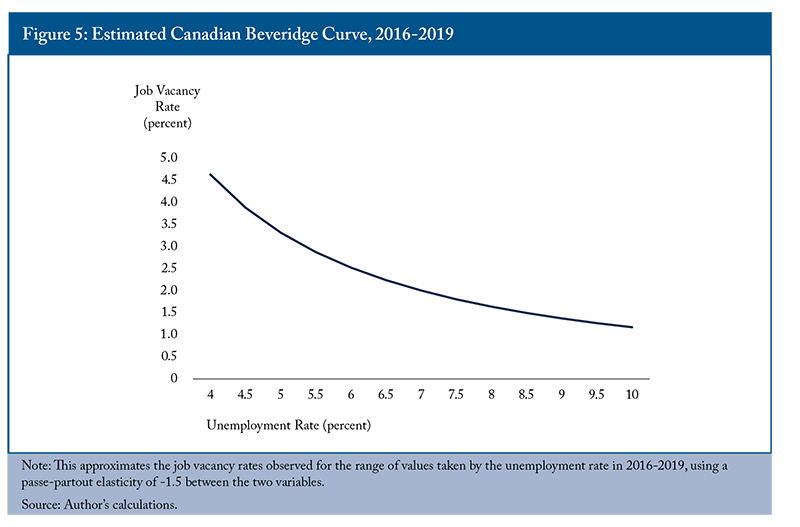
The shifts in the Canadian Beveridge curve during the pandemic are not an entirely unexpected development. Shifts have occurred from time to time in the past.3 As Figure 4 has shown, the Canadian Beveridge curve looked relatively stable before the pandemic in 2016-2019. Figure 5 is an idealized illustration of the position it occupied in the unemployment – job vacancy space in this period. However, starting in 2020, it shifted significantly. It first moved outward during the pandemic in 2020-2021 and then returned inward after the pandemic in 2022-2024.
As an initial assessment of the magnitude of these movements, I use the actual values of unemployment and job vacancies to calculate the implied monthly shifts in the Figure 5 Beveridge curve from January 2016 to October 2024. I then illustrate the implied vertical movements of the job vacancy rate corresponding to a given reference unemployment rate of 5.5 percent4 by averaging the results for each year from 2016 to 2024. The vertical height of the Beveridge curve calculated in this way increased from 2.8 percent in 2019 to nearly 6 percent in 2020-2021, and dropped back to 3.2 percent in 2024 (Figure 6).

The Beveridge curve’s elevation at around 3.2 or 3.3 percent in the post-pandemic period 2023-2024 is higher than its height of 2.8 or 2.9 percent in the pre-pandemic period 2018-2019. This can be attributed to shifts in the ratio of two background factors: the intensity of labour reallocation across occupations, industries and regions, and the efficiency of the matching process between job openings and job seekers (Blanchard, Domash and Summers 2022). At any given rate of unemployment, the job vacancy rate and the Beveridge curve will be higher in relation to the intensity of labour reallocation and the inefficiency of job matching.
The first factor, the intensity of labour reallocation, is captured by the monthly flow of hires as a percentage of the labour force. It is shown as an index with 2019 = 100 in Figure 7. It increased by some 10 percent during the pandemic of 2020-2021. Labour moved from transport industries and those requiring person-to-person contact toward electronic communications and home deliveries. There was a displacement from traditional businesses and occupations to those allowing work from home. However, in 2022-2024 labour reallocation calmed down and its intensity decreased by some 15 percent below its 2019 level. This pushed the Beveridge curve downward.

The second factor, the efficiency of job matching, reflects the capacity of labour markets to generate hires at the observed levels of unemployment and job vacancies. It is an index with 2019 = 100 in Figure 8. It experienced a sharp drop of nearly 20 percent during the pandemic (2020-2021). Factors contributing to this decline include the increasing physical distance between vacant positions and available candidates, as well as the widening gap between the demand for and supply of skills. Also, the rise in illnesses and the increased popularity of remote work during the pandemic likely may have contributed to a decline in job search intensity. As a result, employers found it more difficult to match job offers with suitable job seekers. Matching efficiency did not recover from 2022-2024. It remained some 20 percent below its pre-pandemic level of 2018-2019. This pushed the Beveridge curve upward.

Going from 2019 to 2024, movements in labour reallocation and matching efficiency had opposite effects on the height of the Beveridge curve. But the upward pressure on the curve from the 20 percent drop in matching efficiency was greater than the downward pressure from the 15 percent decline in labour reallocation. Therefore, as already pictured in Figures 4 and 6, the net outcome is that, going over the pandemic, the Beveridge curve wound up at a higher level in 2024 than in 2019, implying a higher job vacancy rate for any given unemployment rate.
So far, I have used the Beveridge relation between job vacancies and unemployment as a broad interpretive framework for macroeconomic developments in Canada over the 2015-2024 period. First, I have focused on the effect of fluctuations in aggregate economic activity (captured by changes in unemployment) on the job vacancy rate. Second, I have noted that the onset and ending of the pandemic have been big shifters of this unemployment – job vacancy trade off upward in 2020-2021 and downward in 2022-2024. Nevertheless, third, I have shown that, mainly due to a persistent 20 percent drop in job matching efficiency since 2019, the Canadian Beveridge curve was occupying a higher vertical position in 2023-2024 than before the pandemic.
In addition to the pandemic, Canada’s immigration policy, characterized by rising immigration levels, is another major development that has impacted labour markets in recent years. Like the pandemic, this policy may have affected the level of the unemployment rate along the Beveridge curve, as well as the vertical position of the curve, through its impacts on labour reallocation and matching efficiency. The following sections try to assess the existence and magnitude of these potential effects of immigration.
Economic Logic
The Beveridge framework can be used to explain how the expansion of immigration in Canada before and after the pandemic could have produced a lasting decrease or increase in labour shortages. Excluding the pandemic’s influence, rising immigration may affect aggregate labour shortages in two mechanical ways: by causing labour markets to slide up or down along the Beveridge curve, or by shifting the entire position of the Beveridge curve upward or downward, resulting in a larger or a smaller number of job vacancies for any given unemployment rate.
The first scenario involves a slide along the Beveridge curve. If rising immigration moves the economy up and to the northwest, unemployment decreases and vacancies increase; if the economy descends to the southeast, unemployment increases and vacancies decrease, as shown in Figure 5.
A permanent increase in unemployment along a given Beveridge curve is not what is generally hoped for by policymakers and the public. We want to achieve a permanent reduction in labour scarcity without being forced to suffer a permanent increase in unemployment. Nevertheless, it is important to understand how rising immigration could impact unemployment permanently, such that a higher or lower unemployment rate would be structurally needed to keep inflation low and stable over time.
A rough check on whether a higher immigration rate has raised or lowered the national unemployment rate consists of seeing if the excess of the national rate over the rate of the experienced group, formed by the Canadian-born plus the immigrants landed more than five years earlier, was higher or lower in 2023 than in 2015. Labour force data indicate that the excess of the national rate over the rate of this experienced group did increase in this period, but by just 0.1 percentage point, owing essentially to the rising labour force share of immigrants landed less than five years earlier. Seen in this light, rising immigration does not seem to have had a meaningful direct effect on structural unemployment. This result is consistent with research by Dion and Dodge (2023), who found no significant change in the national unemployment rate needed to keep inflation stable, known as the noninflationary rate of unemployment, that could be attributed to rising immigration.
It is a relief to see that rising immigration has not entailed a permanent reduction in the job vacancy rate by permanently pushing the national unemployment rate upward. There is evidence, though, that rising immigration has led to greater cyclical volatility of unemployment. First, the phenomenal expansion in the number of new residents since 2021 is known to have contributed to the strong demographic pressure on the demand for housing and, hence, to the significant increase in the cost of rented and owned accommodation. The Bank of Canada has acknowledged that the persistence of high shelter inflation consequently acts “as a material headwind against the return of inflation to the 2 percent target” (Bank of Canada 2024). In other words, through this channel, rising immigration is prolonging the current period of slower growth and higher unemployment. Second, the difference in cyclical sensitivity of the unemployment rate, between the above-defined experienced group and immigrants landed less than five years earlier, seems to have increased. In the economic slowdown during the spring quarter of 2024, the unemployment rate was 4.0 points higher than a year before for immigrants landed less than five years earlier, but only 0.7 point higher for the experienced group. The difference of 3.3 points between them was larger than in the 2009 and 2020 recessions. It could be due in part to the rising share of the low-skilled population of immigrant workers, which is more exposed to layoffs.
This study is primarily concerned with the permanent structural effects of rising immigration on unemployment, which look small, and not with the short-term economic and social costs associated with the greater cyclical volatility of unemployment around its steady state. Nevertheless, the possibility that these short-term costs are real should be kept in mind. Easing labour scarcity by tolerating more unemployment, whether of the short- or long-term variety, is an outcome our policies should try to avoid.
The other way rising immigration may have impacted aggregate labour shortages is by moving the vertical position of the entire Beveridge curve up or down in the unemployment-job vacancy space. Ultimately, we want to know whether rising immigration has increased the job vacancy rate and worsened labour shortages, or whether it has decreased the vacancy rate and alleviated the shortages, at every given level of unemployment.
The combined visual evidence presented by Figures 4 to 8 above implies that the Beveridge curve did shift upward somewhat from the pre-pandemic to the post-pandemic period, particularly due to a persistent 20 percent drop in job matching efficiency. Has rising immigration in Canada contributed to this evolution? Bowlus, Miyairi and Robinson (2016) conducted a longitudinal study of the job search behaviour of immigrants to Canada in 2002-2007. Results imply that heightened immigration may reduce matching efficiency in the short run, as new immigrants often face a lower rate of job offers than natives during their initial integration period. Based on US data, Barnichon and Figura (2015) focused on the two primary determinants of aggregate matching efficiency: worker heterogeneity and labour market segmentation. They pointed out that matching efficiency would decline if workers with a lower-than-average search efficiency became more represented among job seekers, or if the dispersion between tight labour submarkets and slack ones increased. These two conditions would seem to apply to the Canadian context with rising immigration. Lu and Hou (2023) have identified a major shift of immigration toward lower-skilled workers, and a significant relative tightening of labour markets such as construction, accommodation, food, business support services, education, healthcare, and social services. The statistical analysis below will provide a test of whether in recent years rising immigration has in fact shifted the Beveridge curve upward and intensified labour scarcity, or not.
Rising immigration is not the only macroeconomic development that may conceivably have affected aggregate labour shortages in the post-pandemic period. It is entirely conceivable that some of the changes triggered suddenly by the pandemic shock may have persisted into the post-pandemic era. Potentially, the most important of these is the widespread shift to work from home (Aksoy et al. 2023). The pandemic can be seen as a mass natural experiment that brought millions of workers in Canada, and other countries, to suddenly experience more work from home, to value its benefits, and to stick to it thereafter, often with a surprising upside in productivity.
The percentage of Canadian workers aged 15 to 69 who work most of their hours from home was 7 percent in early 2020. It sprang to 41 percent in the great confinement month of April 2020, and then declined as the pandemic evolved and faded out. But it was still holding up around 20 percent in the first half of 2024, which was three times as large as the 7 percent of early 2020.
The large increase in the percentage of Canadians working primarily from home has introduced an increase in worker heterogeneity compared to the pre-2020 period. With more workers satisfied with their work from home, fewer are incentivized to seek new jobs, particularly of the traditional variety. Following the Barnichon and Figura (2015) result, this could partly explain the reduction in job matching efficiency that has so far kept the Beveridge curve at a higher level than otherwise.
The economic logic developed in this section suggests that rising immigration and increased work from home may have contributed to the 20 percent loss of matching efficiency that has kept the post-pandemic height of the Canadian Beveridge curve at a level higher than before the pandemic. (However, fully confirming this hypothesis is beyond the scope of this study).
Statistical Analysis
This section summarizes an analysis of the factors influencing job vacancies in Canada, focusing on immigration and the rise of work-from-home arrangements. Introducing the rate of work from home as a factor is done to verify whether the shift to work from home that was initiated by the pandemic, but persisted in 2022-2024 (Schirle 2024), affected the position of the Beveridge curve.5
The analysis spans six Canadian regions – Atlantic Canada, Quebec, Ontario, the Prairies (Manitoba and Saskatchewan), Alberta, and British Columbia – across the periods from 2015 to 2019 (pre-pandemic) and 2022 to 2024 (post-pandemic).
Table 1 summarizes the key findings of the statistical results. Consistent with expectations, it shows that the Beveridge relationship between vacancies and unemployment is negative, with a precisely estimated elasticity of -1.42 in the two models. The results also show that immigration has been a significant contributor to the rise in job vacancies in Canada. Specifically, Model 1 estimates that a one percentage point increase in the immigration rate is associated with an 8.12 percent increase in the job vacancy rate after one year. It suggests that rising immigration has pushed the Beveridge curve upward, increasing the job vacancy rate at each unemployment rate over the period. However, when accounting for the rise in work-from-home arrangements in Model 2, the effect of immigration is smaller, at 3.21 percent,6 reflecting the additional impact of remote work.7 The positive effect of work-from-home arrangements is estimated at 0.85 percent.

These results suggest that both factors – immigration and remote work – have played a significant role in pushing the Beveridge curve upward, making it more difficult to match available workers with job openings.
While both factors contribute to the rise in job vacancies, their high correlation complicates the ability to isolate their individual effects. The correlation between immigration and remote work is particularly strong, which makes it challenging to assess their independent impacts.8 As a result, the evidence for immigration’s effect on job vacancies in Model 2 is less powerful than it would be if the data allowed sharper estimation.9 However, the findings from Model 2 indicate that the combined effects of both immigration and remote work have contributed to higher job vacancies, suggesting that increasing immigration alone is unlikely to solve labour shortages in the short term.
To be specific, statistical calculation of Model 2 indicates an 82 percent chance that rising immigration has left the job vacancy rate unchanged or raised it, and only an 18 percent chance that it has lowered it.10 In other words, increased immigration is more than four times as likely to have raised the aggregate demand for labour by as much as, or more than, the supply than to have increased it by less than the supply. In short, it is unlikely that rising immigration in Canada has helped the country solve its economy-wide problem of labour shortages by reducing the job vacancy rate at any given unemployment rate.
A natural question is whether the effect of immigration on job vacancies varies between permanent and temporary immigration. So far, an expanded version of Model 2, which distinguishes between these factors by analyzing the permanent and temporary immigration rates separately, has found no significant difference in their four-quarter total effects.11 Future analyses could benefit from disaggregating data by industry, as the impact of immigration and working from home may vary across sectors. For instance, remote work affects sectors like technology differently than it does retail or construction.
Discussion and Conclusion
This paper’s conclusion, drawn from statistical analysis of the macrodata runs, is contrary to the views of business organizations, which have campaigned relentlessly in favour of increases in permanent and temporary economic immigration in the past several years (e.g., Business Council of Canada 2022; Canadian Manufacturers & Exporters 2023; Canadian Federation of Independent Business 2021; Conseil du patronat du Québec 2022). Their position is understandable and grounded in a genuine concern to address labor shortages. By filling the vacancies, economic immigration enables firms to produce more and maintain or increase profitability.
The evidence presented here does not question the important role immigration can play for individual employers, whose need for additional employees is acute and urgent. However, in economics, everything depends on everything. The direction and importance of a phenomenon, confirmed at a microeconomic level with regard to a particular business, government organization, or sector, can be different or even reversed at the macroeconomic level, once all spillovers into the rest of the economy are accounted for. In his 1955 introductory textbook, the renowned American economist Paul Samuelson warned against the risk of the “fallacy of composition,” where it is assumed that what is true for individual parts is automatically true for the whole economy.
In the case of immigration, the fallacy of composition consists of believing that the advantages accruing to employers that hire immigrants can simply be added up and said to extend to the whole economy. What the present study has uncovered is that this belief is not corroborated by the macroeconomic evidence from the recent experience of Canadian regions. It is true that immigration eases up the dearth of personnel in firms that hire newcomers, which is clearly a good thing. But it is also true, conversely, that it worsens the shortage of labour in industries that must cater to the additional demand for goods and services generated by the addition to total GDP. The induced increase in the demand for labour in the aggregate economy can offset or even exceed the initial expansion of supply, so that it contributes to amplify economy-wide labour shortages on net. The insights I have extracted from Canadian regional data suggest that rising immigration has more likely redistributed or increased labour scarcity across the economy than reduced it overall. The political implication is that, if labour shortages persist or increase in the whole of the country despite fast-rising immigration, the insistent demand of business organizations for more immigration will not calm down; labour shortages will persist or intensify.
The vision of immigration as an economy-wide offset to labour scarcity is also reductionist. To take account solely of the hoped-for benefits accruing directly to employers of new immigrants overlooks the fact that immigration is a global and transformative phenomenon. The purpose of immigration is not only to serve the interests of a particular group. It is of concern to a whole society for reasons that are no doubt partly economic, but also demographic, cultural, social, and humanitarian. Society is morally obligated to welcome and integrate all immigrants in the most humane manner. This requires much time and money. Society must also make sure that the pace of immigration is not so fast that it leads ethnic groups to “hunker down” (as Putnam 2007 found) and provokes serious economic disequilibria in sectors that must absorb the induced increase in demand, such as construction, housing, health, education and social services. The overall pace and composition of immigration must balance individual interests against the challenges it brings to society.
Among these costs are the negative potential repercussions on productivity and wage growth stemming from the open-door immigration policy that Canada has followed until recently. Two key implications merit attention. First, investment in housing, business investment to equip newcomers with required physical and human capital, and government investment in public infrastructure to provide social services have not been able to keep pace with fast-rising immigration. Second, the open-door policy has made it easy for employers to rely on low-skilled foreign workers to meet high labour demand, which has been concentrated in low-wage industries (Lu and Hou 2023). While immigration alleviates immediate labour shortages, it may suppress wage increases that would otherwise occur as labour markets tighten and affect capital investments.
For example, in the 12 months leading to 2024Q3, overall wages increased by 4 percent, outpacing inflation at 2 percent, but sectoral differences were stark: wages grew by 3.2 percent in the business sector compared to 6.3 percent in the non-commercial sector. These dynamics suggest that wage growth patterns are influenced by a blend of short-term factors and structural shifts, including immigration trends.
Data also show that business sector labour productivity in Canada is on a slippery slope. From 2021Q3 to 2024Q3, output per hour went down cumulatively by 2.3 percent, whereas it would have gone up by 3.2 percent if it had increased at the same rate as in 1999-2019 (Statistics Canada, table 36-10-0206). While there are many factors behind this slowdown in productivity growth, the high immigration rate may have been a contributor.
In March 2024, the government suddenly announced a reversal of its immigration policy. Immigration Minister Marc Miller committed his department to cutting Canada’s non-permanent resident population from 6.5 percent of the overall population in early 2024 to 5 percent in early 2027. In November, details of the plan were set in the 2024 Annual Report to Parliament on Immigration (Government of Canada 2024, Annex 4). There would be 446,000 fewer entries of new non-permanent residents than exits in each of 2025 and 2026. Annual temporary immigration would be negative to this extent. The Annual Report also announced that the annual target for admissions to permanent immigration would be reduced from 485,000 in 2024 to 395,000 in 2025, 380,000 in 2026 and 365,000 in 2027.
If implemented as intended, scaling back the number of temporary and permanent immigrants will impact Canada’s aggregate labour supply significantly in 2025-2027. The working-age (15-64) population will stagnate instead of increasing by 800,000 or more, as it did in each of 2023 and 2024. An implication of the evidence reported above in Table 1 is that labour demand will likely decline alongside the reduction in labour supply because there will be 800,000 fewer consumers in the Canadian economy. While this policy reversal may not directly address the job vacancy rate, it could reduce vacancies by decreasing the overall demand for labour. As a result, while Canada’s aggregate GDP may contract, GDP per capita could increase, particularly if a smaller portion of national savings is directed toward demographic investments and the composition of immigration shifts toward fewer low-skilled immigrants.
The government’s policy reversal is a first step toward moderation. While it presents challenges, it also offers opportunities for improvement. When employers do not have the luxury of recruiting a rising stream of newcomers who are willing to accept low wages, it may push them to invest more in technology and work reorganization, and hence increase productivity. Furthermore, with a more moderate immigration level, the issue of the lack of absorptive capacity in the economy to provide enough skill-equivalent jobs to high-skilled immigrants will be less acute. Immigrants will see their skill utilization increase and their overqualification rate decrease. This shift could enhance Canada’s ability to attract global talent, aligning with the 2016 recommendation from the Advisory Council on Economic Growth that immigration should help address the shortage of high-skilled workers.
Appendix: Statistical Methodology and Data
This appendix provides a detailed description of the statistical analysis conducted to assess the factors influencing the job vacancy rate in Canada. The analysis spans 27 non-pandemic quarters, covering two periods: 2015Q2 to 2019Q4 (pre-pandemic) and 2022Q4 to 2024Q3 (post-pandemic). It includes data from six Canadian regions – Atlantic Canada, Quebec, Ontario, the Prairies (Manitoba and Saskatchewan), Alberta, and British Columbia. Each of these regions has a population of more than 2 million.
The dataset consists of 162 observations, representing the six regions across the 27 quarters. All labour market and population data are sourced from publicly available Statistics Canada tables. The job vacancy rate and unemployment rate are expressed as ratios of seasonally adjusted job vacancies and unemployment to the labour force. These variables are logarithmically transformed to account for the convexity of the Beveridge curve.
To estimate the relationship between job vacancies and its key determinants, two regression models are specified:
• Model 1 includes the unemployment rate, the immigration rate (measured as the total number of new permanent immigrants and net additional non-permanent residents relative to the population, annualized), and three unconstrained lagged values of the immigration rate.
• Model 2 builds upon Model 1 by including the rate of work from home as an additional explanatory variable. The work-from-home rate is the fraction of workers aged 15 to 69 who work most of their hours from home in their main jobs. This model tests whether the pandemic-induced shift to remote work, which persisted post-pandemic, has affected the Beveridge curve and the job vacancy rate.
Both models incorporate regional and seasonal fixed effects to account for regional disparities and seasonal fluctuations in the labour market.
For the Silo, Pierre Fortin.
The author is grateful to Mario Fortin, Gilles Grenier, Jeremy Kronick, Nicolas Marceau, Parisa Mahboubi, Pascal Michaillat, Mario Polèse, Statistics Canada data analysts, Mikal Skuterud, Daniel Schwanen, Christopher Worswick and several anonymous referees for valuable comments and suggestions. The author retains responsibility for any errors and the views expressed.
References
Advisory Council on Economic Growth. 2016. “The Path to Prosperity: Resetting Canada’s Growth Trajectory.” Report of the Advisory Council on Economic Growth to the Minister of Finance of Canada. October.
Ahn, Hie Joo, and Leland Crane. 2020. “Dynamic Beveridge curve accounting.” Finance and Economic Discussion Series 2020-27. Board of Governors of the Federal Reserve System, Washington. March.
Aksoy, Cevat Giray, Jose Maria Barrero, Nicholas Bloom, Steven Davis, Mathias Dolls and Pablo Zarate. 2023. “Working from home around the world.” Brookings Papers on Economic Activity, Fall 2022, 281-330.
Archambault, Richard, and Mario Fortin. 2001. “The Beveridge Curve and Unemployment Fluctuations in Canada.” Canadian Journal of Economics 34(1): 58-81.
Bank of Canada. 2024. Monetary Policy Report. Ottawa, January.
Barlevy, Gadi, Jason Faberman, Bart Hobijn and Ayşegül Şahin. 2024. “The Shifting Reasons for Beveridge Curve Shifts.” Journal of Economic Perspectives 38(2): 83-106.
Barnichon, Régis, and Andrew Figura. 2015. “Labor market Heterogeneity and the Aggregate Matching Function.” American Economic Journal: Macroeconomics 7(4): 222-249.
Beveridge, William. 1960. Full Employment in a Free Society. Second edition. London: Allen & Unwin.
Blanchard, Olivier, and Peter Diamond. 1989. “The Beveridge Curve.” Brookings Papers on Economic Activity (1)1-67.
Blanchard, Olivier, Alex Domash, and Lawrence Summers. 2022. “Bad news for the Fed from the Beveridge space.” Policy Brief. Peterson Institute for International Economics. July.
Bok, Brandyn, Nicolas Petrosky-Nadeau, Robert Valetta, and Mary Yilma. 2022. “Finding a soft landing along the Beveridge curve.” Economic Letter. Federal Reserve Bank of San Francisco. August.
Bowlus, Audra, Masashi Miyairi and Chris Robinson. 2016. “Immigrant job search assimilation in Canada.” Canadian Journal of Economics 49(1): 5-52.
Business Council of Canada. 2022. Report on Canada’s Immigration Advantage. Ottawa, June. At Canada’s immigration advantage | Business Council of Canada (thebusinesscouncil.ca)
Canadian Federation of Independent Business. 2021. “Using Immigration Programs to Overcome Labour Shortage Problems.” Ottawa. May. At Using immigration programs to overcome labour shortage problems | CFIB (cfib-fcei.ca)
Canadian Manufacturers & Exporters. 2023. Manufacturing Canada’s Future. Ottawa, November. At 2023-CME-Report-Manufacturing-Canadas-Future_Final-2_web.pdf (cme-mec.ca)
C.D. Howe Institute. 2024. “Graphic of the week: Canada’s plan to cut non-permanent residents by 30 percent by early 2027.” At Graph of the Week: Canada’s Plan to Cut Non-Permanent Residents by 30 Percent by Early 2027 | C.D. Howe Institute | Canada Economy News | Canadian Government Policy (cdhowe.org)
Century Initiative. 2024. “Canada’s Immigration Reality Check.” In National Scorecard on Canada’s Growth and Prosperity. Ottawa. November. At 665f8b1d9f801b398e1926db_Century Initiative Full Report 2024 – EN.pdf (website-files.com)
Conseil du patronat du Québec. 2022. Livre blanc sur l’immigration: Portait et solutions. Montréal, May. At Livre blanc sur l’immigration – Portrait et solutions | Conseil du patronat du Québec (cpq.qc.ca)
Dion, Richard, and David Dodge. 2023. “Labour force growth and labour market gap in Canada: 2011 to 2032.” Working Paper. Ottawa: Bennett Jones, May.
Doyle, Matthew, Mikal Skuterud and Christopher Worswick. 2024. Optimizing Immigration for Economic Growth. Commentary No. 662. Toronto: C.D. Howe Institute.
Elsby, Michael, Ryan Michaels and David Ratner. 2015. “The Beveridge Curve: A Survey.” Journal of Economic Literature 53(3): 571-630.
Fortin, Pierre.2024. “Does immigration help alleviate economy-wide labour shortages?” Working Paper #70, Canadian Labour Economics Forum, University of Waterloo. May.
Government of Canada. 2024. 2024 Annual Report to Parliament on Immigration. Immigration, Refugees and Citizenship Canada. October.
Hazell, Jonathon, Juan Herreño, Emi Nakamura, and Jón Steinsson. 2022. “The Slope of the Phillips Curve: Evidence from US states.” Quarterly Journal of Economics 137(3): 1299-1344.
Lam, Alexander. 2022. “Canada’s Beveridge curve and the outlook for the labour market.” Staff Analytical Note 2022-18, Bank of Canada, Ottawa. November.
Lu, Yuqian, and Feng Hou. 2023. “Foreign workers in Canada: distribution of paid employment by industry.” Economic and Social Reports. Catalogue No. 36-28-0001. Ottawa: Statistics Canada. December.
Mahboubi, Parisa, and William Robson. 2018. “Inflated Expectations: More Immigrants Can’t Solve Canada’s Aging Problem on Their Own.” E-Brief. Toronto: C.D. Howe Institute.
Michaillat, Pascal, and Emmanuel Saez. 2021. “Beveridgean unemployment gap.” Journal of Public Economics Plus 2. December.
Morissette, René, Vincent Hardy and Voltek Zolkiewski. 2023. “Working most hours from home: new estimates for January to April 2022.” Analytical Studies Branch Research Papers Series. Catalogue no. 11F0019M, No. 472. Ottawa: Statistics Canada. July.
Pissarides, Christopher. 2000. Equilibrium Unemployment Theory. Cambridge MA: MIT Press.
Putnam, Robert. 2007. “E Pluribus Unum: Diversity and community in the twenty-first century: The 2006 Johan Skytte Prize Lecture.” Scandinavian Political Studies 30(2): 137-174.
Romer, Christina, and David Romer. 2019. “NBER business cycle dating: Retrospect and prospect.” Paper prepared for the session “NBER and the Evolution of Economic Research, 1920–2020” at the ASSA Annual Meeting, San Diego, California, January 2020. Department of Economics, University of California, Berkeley.
Samuelson, Paul. 1955. Economics: An Introductory Analysis. New York: McGraw-Hill.
Schirle, Tammy. 2024. “Settling into a New Normal? Working from Home across Canada.” E-Brief. Toronto: C.D. Howe Institute.
Shimer, Robert. 2012. “Reassessing the Ins and Outs of Unemployment.” Review of Economic Dynamics 15(2): 127-148.
Statistics Canada. 2024. Job vacancies, third quarter 2023. January 18. https://www150.statcan.gc.ca/n1/en/daily-quotidien/240118/dq240118c-eng.pdf?st=36gTb__Z


