2018 Weed Index Study reveals the cost of marijuana and highlights the number of grow and head shops in 120 cities around the world:
- With a total of 156, Los Angeles, USA has the most headshops.
- Madrid, Spain has the largest amount of growshops, with a total of 68.
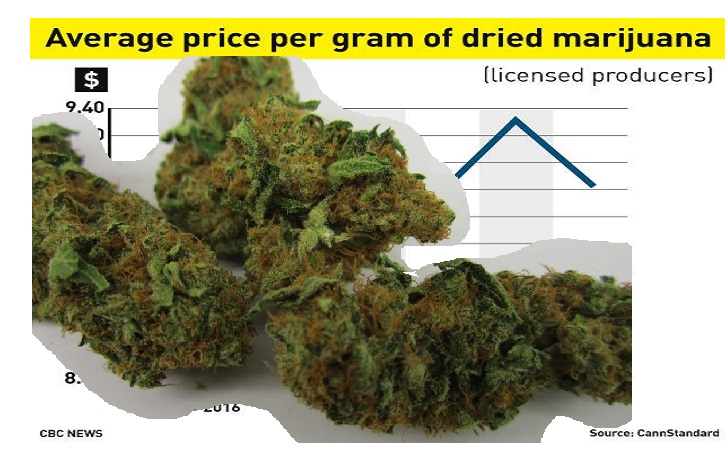
- Tokyo, Japan has the most expensive cannabis, at 32.66 USD per gram, while Quito, Ecuador has the least expensive marijuana, at 1.34 USD per gram.
- Based on the average US marijuana tax rates currently implemented, New York City could generate the highest potential tax revenue by legalising weed, with 156.40 million USD per year. New York City also has the highest consumption rate of cannabis, at 77.44 metric tons per year.
Berlin, Germany, 20/04/2018 – ABCD, a data-driven media campaign outlet, has released new data which reveals the number of marijuana head and growshops in 120 cities around the world. This research, which builds on the 2018 Cannabis Price Index released earlier this year, reveals which locations around the world are ready to embrace cannabis legalisation. The aim of the study is to illustrate the continuous need for legislative reform on cannabis use around the world, and to determine if there are any lessons to be learned from those cities at the forefront of marijuana legalization. By including extra data on the number of head and growshops in each city, this new research can be utilized to indicate which cities are prepared for an imminent cannabis reform, while also highlighting which cities are in opposition of marijuana legalisation.
The initial study began by selecting 120 cities across the world, including locations where cannabis is currently legal, illegal and partially legal, and where marijuana consumption data is available. Then, they looked into the price of weed per gram in each city. To calculate how much potential tax a city could make by legalising weed, ABCD investigated how much tax is paid on the most popular brand of cigarettes, as this offers the closest comparison. They then looked at what percentage marijuana is currently taxed in cities where it’s already legalised in the US.
ABCD decided to conduct the extra research in order to to further the discussion around the medical and recreational use of cannabis, and the potential industry and business opportunities that would follow legalisation. By identifying the number of headshops as well as growshops, this study serves as an indicator to a city’s existing cannabis infrastructure and willingness to accept such reform on a larger scale. As an indicating factor, the more head shops and grow shops a city has, the more positive their state’s and general public’s attitude towards the cannabis-related industry is likely to be.
The table below reveals a sample of the results for the 13 US cities featured in the study:
| # |
City |
Legality |
Price per gram, US$ |
Total possible tax collection, if taxed at cigarette level, mil US$ |
Total possible tax collection, if taxed at average US marijuana taxes, mil US$ |
Total consumption in metric tons |
Headshops |
Growshops |
| 1 |
Washington, DC |
Partial |
18.08 |
47.51 |
20.96 |
6.18 |
20 |
8 |
| 2 |
Chicago |
Partial |
11.46 |
119.61 |
52.77 |
24.54 |
91 |
10 |
| 3 |
Philadelphia |
Partial |
11.30 |
68.37 |
30.16 |
14.22 |
41 |
3 |
| 4 |
Boston |
Legal |
11.01 |
28.59 |
12.61 |
6.10 |
49 |
4 |
| 5 |
New York |
Partial |
10.76 |
354.48 |
156.40 |
77.44 |
59 |
7 |
| 6 |
Dallas |
Partial |
10.03 |
51.01 |
22.5 |
11.95 |
80 |
6 |
| 7 |
Houston |
Partial |
10.03 |
89.13 |
39.32 |
20.89 |
125 |
14 |
| 8 |
Phoenix |
Partial |
9.35 |
58.26 |
25.71 |
14.65 |
72 |
9 |
| 9 |
Miami |
Partial |
9.27 |
16.24 |
7.16 |
4.12 |
67 |
25 |
| 10 |
San Francisco |
Legal |
9.27 |
30.94 |
13.65 |
7.85 |
61 |
3 |
| 11 |
Los Angeles |
Legal |
8.14 |
124.88 |
55.10 |
36.06 |
153 |
46 |
| 12 |
Denver |
Legal |
7.79 |
20.53 |
9.06 |
6.20 |
61 |
21 |
| 13 |
Seattle |
Legal |
7.58 |
20.59 |
9.08 |
6.39 |
46 |
10 |
The table below shows the top 10 most and least expensive cities for cannabis:
| Top 10 Most Expensive Cities |
|
Top 10 Least Expensive Cities |
| # |
City |
Country |
Legality |
Price per gram, US$ |
|
# |
City |
Country |
Legality |
Price per gram, US$ |
| 1 |
Tokyo |
Japan |
Illegal |
32.66 |
|
1 |
Quito |
Ecuador |
Partial |
1.34 |
| 2 |
Seoul |
South Korea |
Illegal |
32.44 |
|
2 |
Bogota |
Colombia |
Partial |
2.20 |
| 3 |
Kyoto |
Japan |
Illegal |
29.65 |
|
3 |
Asuncion |
Paraguay |
Partial |
2.22 |
| 4 |
Hong Kong |
China |
Illegal |
27.48 |
|
4 |
Jakarta |
Indonesia |
Illegal |
3.79 |
| 5 |
Bangkok |
Thailand |
Partial |
24.81 |
|
5 |
Panama City |
Panama |
Illegal |
3.85 |
| 6 |
Dublin |
Ireland |
Illegal |
21.63 |
|
6 |
Johannesburg |
South Africa |
Illegal |
4.01 |
| 7 |
Tallinn |
Estonia |
Partial |
20.98 |
|
7 |
Montevideo |
Uruguay |
Legal |
4.15 |
| 8 |
Shanghai |
China |
Illegal |
20.82 |
|
8 |
Astana |
Kazakhstan |
Illegal |
4.22 |
| 9 |
Beijing |
China |
Illegal |
20.52 |
|
9 |
Antwerp |
Belgium |
Partial |
4.29 |
| 10 |
Oslo |
Norway |
Partial |
19.14 |
|
10 |
New Delhi |
India |
Partial |
4.38 |
The table Below shows the top 10 cities with the most growshops:
| # |
City |
Country |
Legality |
Growshops |
| 1 |
Madrid |
Spain |
Partial |
68 |
| 2 |
Buenos Aires |
Argentina |
Partial |
48 |
| 3 |
Los Angeles |
USA |
Legal |
46 |
| 4 |
Toronto |
Canada |
Partial |
37 |
| 5 |
Melbourne |
Australia |
Partial |
31 |
| 6 |
Miami |
USA |
Partial |
25 |
| 7 |
London |
UK |
Illegal |
23 |
| 8 |
Barcelona |
Spain |
Partial |
23 |
| 9 |
Denver |
USA |
Legal |
21 |
| 10 |
Berlin |
Germany |
Partial |
20 |
The table Below shows the top 10 cities with the most headshops:
| # |
City |
Country |
Legality |
Headshops |
| 1 |
Los Angeles |
USA |
Legal |
156 |
| 2 |
Houston |
USA |
Partial |
125 |
| 3 |
Chicago |
USA |
Partial |
91 |
| 4 |
Dallas |
USA |
Partial |
80 |
| 5 |
Phoenix |
USA |
Partial |
72 |
| 6 |
Miami |
USA |
Partial |
67 |
| 7 |
San Francisco |
USA |
Legal |
61 |
| 8 |
Denver |
USA |
Legal |
61 |
| 9 |
New York |
USA |
Partial |
59 |
| 10 |
Boston |
USA |
Legal |
49 |
The table below shows the top 10 cities who could generate the most potential tax by legalising cannabis, if taxed at the same rate as the most popular cigarette brand:
| # |
City |
Country |
Legality |
Price per gram, US$ |
% of cigarette tax |
Possible tax revenue, mil US$ |
| 1 |
Cairo |
Egypt |
Illegal |
16.15 |
73.13 |
384.87 |
| 2 |
New York |
USA |
Partial |
10.76 |
42.54 |
354.48 |
| 3 |
London |
UK |
Illegal |
9.20 |
82.16 |
237.35 |
| 4 |
Sydney |
Australia |
Partial |
10.79 |
56.76 |
138.36 |
| 5 |
Karachi |
Pakistan |
Illegal |
5.32 |
60.7 |
135.48 |
| 6 |
Melbourne |
Australia |
Partial |
10.84 |
56.76 |
132.75 |
| 7 |
Moscow |
Russia |
Partial |
11.84 |
47.63 |
128.97 |
| 8 |
Toronto |
Canada |
Partial |
7.82 |
69.8 |
124.15 |
| 9 |
Chicago |
USA |
Partial |
11.46 |
42.54 |
119.61 |
| 10 |
Berlin |
Germany |
Partial |
13.53 |
72.9 |
114.77 |
N.B. % of cigarette tax refers to the tax percentage on the most popular brand. Possible tax revenue refers to the total possible tax collection per year, if taxed at cigarette level. For a full explanation of how the study was conducted, please see the methodology at the bottom of the press release.
The table below shows the top 10 cities who could generate the most potential tax by legalising cannabis, if taxed at the average US marijuana tax rate:
| # |
City |
Country |
Legality |
Price per gram, US$ |
Possible tax revenue, mil US$ |
| 1 |
New York |
USA |
Partial |
10.76 |
156.4 |
| 2 |
Cairo |
Egypt |
Illegal |
16.15 |
98.78 |
| 3 |
London |
UK |
Illegal |
9.20 |
54.22 |
| 4 |
Chicago |
USA |
Partial |
11.46 |
52.77 |
| 5 |
Moscow |
Russia |
Partial |
11.84 |
50.82 |
| 6 |
Sydney |
Australia |
Partial |
10.79 |
45.75 |
| 7 |
Melbourne |
Australia |
Partial |
10.84 |
43.9 |
| 8 |
Karachi |
Pakistan |
Illegal |
5.32 |
41.89 |
| 9 |
Houston |
USA |
Partial |
10.03 |
39.32 |
| 10 |
Toronto |
Canada |
Partial |
7.82 |
33.38 |
N.B. Possible tax revenue refers to the total possible tax collection per year, if taxed at average US marijuana tax rate.
The table below shows the top 10 cities with the highest and lowest consumption of cannabis, per year:
| Highest Consumers of Cannabis |
|
Lowest Consumers of Cannabis |
| # |
City |
Country |
Legality |
Price per gram, US$ |
Total consumption, metric tons |
|
# |
City |
Country |
Legality |
Price per gram, US$ |
Total consumption, metric tons |
| 1 |
New York |
USA |
Partial |
10.76 |
77.44 |
|
1 |
Singapore |
Singapore |
Illegal |
14.01 |
0.02 |
| 2 |
Karachi |
Pakistan |
Illegal |
5.32 |
41.95 |
|
2 |
Santo Domingo |
Dominican Rep. |
Illegal |
6.93 |
0.16 |
| 3 |
New Delhi |
India |
Partial |
4.38 |
38.26 |
|
3 |
Kyoto |
Japan |
Illegal |
29.65 |
0.24 |
| 4 |
Los Angeles |
USA |
Legal |
8.14 |
36.06 |
|
4 |
Thessaloniki |
Greece |
Partial |
13.49 |
0.29 |
| 5 |
Cairo |
Egypt |
Illegal |
16.15 |
32.59 |
|
5 |
Luxembourg City |
Luxembourg |
Partial |
7.26 |
0.32 |
| 6 |
Mumbai |
India |
Partial |
4.57 |
32.38 |
|
6 |
Panama City |
Panama |
Illegal |
3.85 |
0.37 |
| 7 |
London |
UK |
Illegal |
9.20 |
31.4 |
|
7 |
Reykjavik |
Iceland |
Illegal |
15.92 |
0.44 |
| 8 |
Chicago |
USA |
Partial |
11.46 |
24.54 |
|
8 |
Asuncion |
Paraguay |
Partial |
2.22 |
0.46 |
| 9 |
Moscow |
Russia |
Partial |
11.84 |
22.87 |
|
9 |
Colombo |
Sri Lanka |
Illegal |
9.12 |
0.59 |
| 10 |
Toronto |
Canada |
Partial |
7.82 |
22.75 |
|
10 |
Manila |
Philippines |
Illegal |
5.24 |
0.6 |
N.B. Total consumption is calculated per annum.
Further findings:
- Shanghai, China has a large population of 24.15 million, has however no headshops or growshops in the city, underlining a resistance against cannabis reform.
- On average, the status of legality (e.g. Legal, Partial or Illegal) coincides with the amount of headshops and growshops found in each city. The favourable the laws, the better the cannabis infrastructure
- New York City, USA has the highest consumption rate of cannabis, at 77.44 metric tons per year.
- Boston, USA has the most expensive cannabis of all the cities where it’s legal, at 11.01 USD, while Montevideo, Uruguay has the least expensive at 4.15 USD.
- While Tokyo, Japan has the most expensive cannabis of all cities where it’s illegal, at 32.66 USD, Jakarta, Indonesia has the least expensive at 3.79 USD, despite being classed as a Group 1 drug with harsh sentences such as life imprisonment and the death penalty.
- For cities where cannabis is partially legal, Bangkok, Thailand has the most expensive at 24.81 USD, while Quito, Ecuador has the least expensive at 1.34 USD.
- Bulgaria has the highest tax rates for the most popular brand of cigarettes, at 82.65%, while Paraguay has the lowest, with rates of 16%.
- Cairo, Egypt would gain the most revenue in tax if they were to legalise cannabis and tax it as the same rate as cigarettes, at 384.87 million USD. Singapore, Singapore would gain the least, at 0.14 million USD, due in part to the city’s low consumption of marijuana at 0.02 metric tons per annum.
- Based on the average US marijuana tax rates currently implemented, New York City could generate the highest potential tax revenue by legalising weed, with 156.4 million USD per year. Singapore, Singapore would gain the least, at 0.04 million USD.
Source for data and graphics- http://weedindex.io
The full results of the 2018 Cannabis Price Index:
| # |
City |
Country |
Legality |
Price per gram, US$ |
Taxes of cigarettes, % of the most sold brand |
Total possible tax collection, if taxed at cigarette level, mil US$ |
Total possible tax collection, if taxed at average US marijuana taxes, mil US$ |
Total Consumption in metric tons |
| 1 |
Tokyo |
Japan |
Illegal |
32.66 |
64.36 |
32.14 |
9.37 |
1.53 |
| 2 |
Seoul |
South Korea |
Illegal |
32.44 |
61.99 |
31.61 |
9.57 |
1.57 |
| 3 |
Kyoto |
Japan |
Illegal |
29.65 |
64.36 |
4.64 |
1.35 |
0.24 |
| 4 |
Hong Kong |
China |
Illegal |
27.48 |
44.43 |
19.72 |
8.33 |
1.62 |
| 5 |
Bangkok |
Thailand |
Partial |
24.81 |
73.13 |
99.11 |
25.44 |
5.46 |
| 6 |
Dublin |
Ireland |
Illegal |
21.63 |
77.80 |
29.31 |
7.07 |
1.74 |
| 7 |
Tallinn |
Estonia |
Partial |
20.98 |
77.24 |
22.13 |
5.38 |
1.37 |
| 8 |
Shanghai |
China |
Illegal |
20.82 |
44.43 |
49.12 |
20.75 |
5.31 |
| 9 |
Beijing |
China |
Illegal |
20.52 |
44.43 |
43.10 |
18.21 |
4.73 |
| 10 |
Oslo |
Norway |
Partial |
19.14 |
68.83 |
19.28 |
5.26 |
1.46 |
| 11 |
Washington, DC |
USA |
Partial |
18.08 |
42.54 |
47.51 |
20.96 |
6.18 |
| 12 |
Cairo |
Egypt |
Illegal |
16.15 |
73.13 |
384.87 |
98.78 |
32.59 |
| 13 |
Reykjavik |
Iceland |
Illegal |
15.92 |
56.40 |
3.97 |
1.32 |
0.44 |
| 14 |
Belfast |
Ireland |
Illegal |
15.81 |
77.80 |
13.55 |
3.27 |
1.10 |
| 15 |
Minsk |
Belarus |
Illegal |
15.80 |
51.15 |
9.08 |
3.33 |
1.12 |
| 16 |
Athens |
Greece |
Partial |
14.95 |
79.95 |
7.42 |
1.74 |
0.62 |
| 17 |
Auckland |
New Zealand |
Partial |
14.77 |
77.34 |
106.03 |
25.73 |
9.28 |
| 18 |
Munich |
Germany |
Partial |
14.56 |
72.90 |
50.90 |
13.10 |
4.80 |
| 19 |
Helsinki |
Finland |
Partial |
14.42 |
81.53 |
27.12 |
6.24 |
2.31 |
| 20 |
Singapore |
Singapore |
Illegal |
14.01 |
66.23 |
0.14 |
0.04 |
0.02 |
| 21 |
Berlin |
Germany |
Partial |
13.53 |
72.90 |
114.77 |
29.55 |
11.64 |
| 22 |
Stuttgart |
Germany |
Partial |
13.50 |
72.90 |
20.20 |
5.20 |
2.05 |
| 23 |
Thessaloniki |
Greece |
Partial |
13.49 |
79.95 |
3.17 |
0.75 |
0.29 |
| 24 |
Stockholm |
Sweden |
Illegal |
13.20 |
68.84 |
15.06 |
4.11 |
1.66 |
| 25 |
Vienna |
Austria |
Partial |
12.87 |
74.00 |
59.21 |
15.02 |
6.22 |
| 26 |
Copenhagen |
Denmark |
Partial |
12.47 |
74.75 |
20.65 |
5.18 |
2.22 |
| 27 |
Moscow |
Russia |
Partial |
11.84 |
47.63 |
128.97 |
50.82 |
22.87 |
| 28 |
Hamburg |
Germany |
Partial |
11.64 |
72.90 |
50.16 |
12.92 |
5.91 |
| 29 |
Chicago |
USA |
Partial |
11.46 |
42.54 |
119.61 |
52.77 |
24.54 |
| 30 |
Philadelphia |
USA |
Partial |
11.30 |
42.54 |
68.37 |
30.16 |
14.22 |
| 31 |
Bucharest |
Romania |
Partial |
11.18 |
75.41 |
17.23 |
4.29 |
2.04 |
| 32 |
Cologne |
Germany |
Partial |
11.14 |
72.90 |
28.51 |
7.34 |
3.51 |
| 33 |
Geneva |
Switzerland |
Partial |
11.12 |
61.20 |
5.90 |
1.81 |
0.87 |
| 34 |
Boston |
USA |
Legal |
11.01 |
42.54 |
28.59 |
12.61 |
6.10 |
| 35 |
Adelaide |
Australia |
Partial |
10.91 |
56.76 |
41.60 |
13.75 |
6.72 |
| 36 |
Istanbul |
Turkey |
Partial |
10.87 |
82.13 |
21.79 |
4.98 |
2.44 |
| 37 |
Melbourne |
Australia |
Partial |
10.84 |
56.76 |
132.75 |
43.90 |
21.58 |
| 38 |
Sydney |
Australia |
Partial |
10.79 |
56.76 |
138.36 |
45.75 |
22.59 |
| 39 |
New York |
USA |
Partial |
10.76 |
42.54 |
354.48 |
156.40 |
77.44 |
| 40 |
Düsseldorf |
Germany |
Partial |
10.70 |
72.90 |
15.82 |
4.07 |
2.03 |
| 41 |
Brisbane |
Australia |
Partial |
10.63 |
56.76 |
66.88 |
22.12 |
11.09 |
| 42 |
Hanover |
Germany |
Partial |
10.51 |
72.90 |
13.46 |
3.47 |
1.76 |
| 43 |
Prague |
Czech Rep. |
Partial |
10.47 |
77.42 |
63.95 |
15.50 |
7.89 |
| 44 |
Frankfurt |
Germany |
Partial |
10.29 |
72.90 |
18.06 |
4.65 |
2.41 |
| 45 |
Wellington |
New Zealand |
Partial |
10.11 |
77.34 |
19.53 |
4.74 |
2.50 |
| 46 |
Dallas |
USA |
Partial |
10.03 |
42.54 |
51.01 |
22.50 |
11.95 |
| 47 |
Houston |
USA |
Partial |
10.03 |
42.54 |
89.13 |
39.32 |
20.89 |
| 48 |
Vilnius |
Lithuania |
Illegal |
10.00 |
75.76 |
5.20 |
1.29 |
0.69 |
| 49 |
Zurich |
Switzerland |
Partial |
9.71 |
61.20 |
10.33 |
3.17 |
1.74 |
| 50 |
Montpellier |
France |
Illegal |
9.70 |
80.30 |
12.21 |
2.85 |
1.57 |
| 51 |
Canberra |
Australia |
Partial |
9.65 |
56.76 |
10.96 |
3.63 |
2.00 |
| 52 |
Zagreb |
Croatia |
Partial |
9.43 |
75.26 |
24.35 |
6.07 |
3.43 |
| 53 |
Nice |
France |
Illegal |
9.40 |
80.30 |
15.80 |
3.69 |
2.09 |
| 54 |
Phoenix |
USA |
Partial |
9.35 |
42.54 |
58.26 |
25.71 |
14.65 |
| 55 |
Paris |
France |
Illegal |
9.30 |
80.30 |
102.25 |
23.90 |
13.69 |
| 56 |
Miami |
USA |
Partial |
9.27 |
42.54 |
16.24 |
7.16 |
4.12 |
| 57 |
San Francisco |
USA |
Legal |
9.27 |
42.54 |
30.94 |
13.65 |
7.85 |
| 58 |
London |
UK |
Illegal |
9.20 |
82.16 |
237.35 |
54.22 |
31.40 |
| 59 |
Colombo |
Sri Lanka |
Illegal |
9.12 |
73.78 |
3.98 |
1.01 |
0.59 |
| 60 |
Riga |
Latvia |
Illegal |
9.00 |
76.89 |
10.23 |
2.50 |
1.48 |
| 61 |
Bratislava |
Slovakia |
Illegal |
8.92 |
81.54 |
7.24 |
1.67 |
1.00 |
| 62 |
Milan |
Italy |
Partial |
8.85 |
75.68 |
46.06 |
11.42 |
6.88 |
| 63 |
Varna |
Bulgaria |
Illegal |
8.83 |
82.65 |
4.84 |
1.10 |
0.66 |
| 64 |
Marseille |
France |
Illegal |
8.69 |
80.30 |
36.23 |
8.47 |
5.19 |
| 65 |
Glasgow |
UK |
Illegal |
8.65 |
82.16 |
15.21 |
3.47 |
2.14 |
| 66 |
Toulouse |
France |
Illegal |
8.62 |
80.30 |
18.67 |
4.36 |
2.70 |
| 67 |
Birmingham |
UK |
Illegal |
8.58 |
82.16 |
27.73 |
6.34 |
3.93 |
| 68 |
Kuala Lumpur |
Malaysia |
Illegal |
8.54 |
55.36 |
6.61 |
2.24 |
1.40 |
| 69 |
Monterrey |
Mexico |
Partial |
8.45 |
65.87 |
4.17 |
1.19 |
0.75 |
| 70 |
Edinburgh |
UK |
Illegal |
8.41 |
82.16 |
12.22 |
2.79 |
1.77 |
| 71 |
Lisbon |
Portugal |
Partial |
8.36 |
74.51 |
4.69 |
1.18 |
0.75 |
| 72 |
Strasbourg |
France |
Illegal |
8.35 |
80.30 |
11.13 |
2.60 |
1.66 |
| 73 |
Warsaw |
Poland |
Partial |
8.31 |
80.29 |
29.27 |
6.84 |
4.39 |
| 74 |
Lyon |
France |
Illegal |
8.20 |
80.30 |
19.45 |
4.55 |
2.95 |
| 75 |
Los Angeles |
USA |
Legal |
8.14 |
42.54 |
124.88 |
55.10 |
36.06 |
| 76 |
Liverpool |
UK |
Illegal |
7.94 |
82.16 |
10.86 |
2.48 |
1.67 |
| 77 |
Amsterdam |
Netherlands |
Partial |
7.89 |
73.40 |
20.94 |
5.35 |
3.61 |
| 78 |
Manchester |
UK |
Illegal |
7.88 |
82.16 |
58.99 |
13.48 |
9.11 |
| 79 |
Rome |
Italy |
Partial |
7.86 |
75.68 |
88.16 |
21.86 |
14.82 |
| 80 |
Toronto |
Canada |
Partial |
7.82 |
69.80 |
124.15 |
33.38 |
22.75 |
| 81 |
Denver |
USA |
Legal |
7.79 |
42.54 |
20.53 |
9.06 |
6.20 |
| 82 |
Naples |
Italy |
Partial |
7.75 |
75.68 |
29.82 |
7.40 |
5.08 |
| 83 |
Leeds |
UK |
Illegal |
7.67 |
82.16 |
16.93 |
3.87 |
2.69 |
| 84 |
Seattle |
USA |
Legal |
7.58 |
42.54 |
20.59 |
9.08 |
6.39 |
| 85 |
Madrid |
Spain |
Partial |
7.47 |
78.09 |
93.40 |
22.45 |
16.01 |
| 86 |
Calgary |
Canada |
Partial |
7.30 |
69.80 |
52.23 |
14.05 |
10.25 |
| 87 |
Luxembourg City |
Luxembourg |
Partial |
7.26 |
70.24 |
1.62 |
0.43 |
0.32 |
| 88 |
San Jose |
Costa Rica |
Partial |
7.23 |
69.76 |
7.84 |
2.11 |
1.56 |
| 89 |
Buenos Aires |
Argentina |
Partial |
7.13 |
69.84 |
25.32 |
6.81 |
5.09 |
| 90 |
Brussels |
Belgium |
Partial |
7.09 |
75.92 |
15.50 |
3.83 |
2.88 |
| 91 |
Santo Domingo |
Dominican Rep. |
Illegal |
6.93 |
58.87 |
0.67 |
0.21 |
0.16 |
| 92 |
Graz |
Austria |
Partial |
6.84 |
74.00 |
4.81 |
1.22 |
0.95 |
| 93 |
Budapest |
Hungary |
Illegal |
6.74 |
77.26 |
7.70 |
1.87 |
1.48 |
| 94 |
Sofia |
Bulgaria |
Illegal |
6.66 |
82.65 |
12.83 |
2.91 |
2.33 |
| 95 |
Ottawa |
Canada |
Partial |
6.62 |
69.80 |
35.43 |
9.53 |
7.67 |
| 96 |
Vancouver |
Canada |
Partial |
6.40 |
69.80 |
23.44 |
6.30 |
5.25 |
| 97 |
Sao Paulo |
Brazil |
Partial |
6.38 |
64.94 |
68.55 |
19.81 |
16.55 |
| 98 |
Rotterdam |
Netherlands |
Partial |
6.33 |
73.40 |
12.75 |
3.26 |
2.74 |
| 99 |
Ljubljana |
Slovenia |
Partial |
6.32 |
80.41 |
3.43 |
0.80 |
0.67 |
| 100 |
Barcelona |
Spain |
Partial |
6.23 |
78.09 |
39.59 |
9.51 |
8.14 |
| 101 |
Montreal |
Canada |
Partial |
6.15 |
69.80 |
60.52 |
16.27 |
14.10 |
| 102 |
Kiev |
Ukraine |
Partial |
6.00 |
74.78 |
14.73 |
3.70 |
3.28 |
| 103 |
Abuja |
Nigeria |
Illegal |
5.88 |
20.63 |
7.40 |
6.73 |
6.10 |
| 104 |
Lima |
Peru |
Partial |
5.88 |
37.83 |
12.28 |
6.09 |
5.52 |
| 105 |
Mexico City |
Mexico |
Partial |
5.87 |
65.87 |
22.58 |
6.43 |
5.84 |
| 106 |
Cape Town |
South Africa |
Illegal |
5.82 |
48.80 |
2.47 |
0.95 |
0.87 |
| 107 |
Karachi |
Pakistan |
Illegal |
5.32 |
60.70 |
135.48 |
41.89 |
41.95 |
| 108 |
Manila |
Philippines |
Illegal |
5.24 |
74.27 |
2.32 |
0.59 |
0.60 |
| 109 |
Rio de Janeiro |
Brazil |
Partial |
5.11 |
64.94 |
28.82 |
8.33 |
8.69 |
| 110 |
Mumbai |
India |
Partial |
4.57 |
60.39 |
89.38 |
27.78 |
32.38 |
| 111 |
New Delhi |
India |
Partial |
4.38 |
60.39 |
101.20 |
31.45 |
38.26 |
| 112 |
Antwerp |
Belgium |
Partial |
4.29 |
75.92 |
4.10 |
1.01 |
1.26 |
| 113 |
Astana |
Kazakhstan |
Illegal |
4.22 |
39.29 |
1.78 |
0.85 |
1.07 |
| 114 |
Montevideo |
Uruguay |
Legal |
4.15 |
66.75 |
19.54 |
5.50 |
7.06 |
| 115 |
Johannesburg |
South Africa |
Illegal |
4.01 |
48.80 |
3.76 |
1.45 |
1.92 |
| 116 |
Panama City |
Panama |
Illegal |
3.85 |
56.52 |
0.81 |
0.27 |
0.37 |
| 117 |
Jakarta |
Indonesia |
Illegal |
3.79 |
53.40 |
1.92 |
0.68 |
0.95 |
| 118 |
Asuncion |
Paraguay |
Partial |
2.22 |
16.00 |
0.16 |
0.19 |
0.46 |
| 119 |
Bogota |
Colombia |
Partial |
2.20 |
49.44 |
15.80 |
6.00 |
14.53 |
| 120 |
Quito |
Ecuador |
Partial |
1.34 |
70.39 |
0.56 |
0.15 |
0.60 |
Methodology
Selection of the cities:
To select the cities for the study, Seedo first looked at the top and bottom cannabis consuming countries around the world. Then they analysed nations where marijuana is partially or completely legal, as well as illegal, and selected the final list of 120 cities in order to best offer a representative comparison of the global cannabis price.
Data:
- Price per gram, US$ – Crowdsourced city-level surveys adjusted to World Drug Report 2017 of the United Nations Office on Drugs and Crime.
- Taxes on Cigarettes, % of the most sold brand – Taxes as a percentage of the retail price of the most sold brand (total tax). Source: Appendix 2 of the WHO report on the global tobacco epidemic, 2015.
- Annual possible tax collection is calculated in the following way:
- Total_Possible_Tax=Population_City*Prevalence*Avg_Consumption_year_gr*price*tax_level, where:
- Population: latest available local population data sources.
- Annual Prevalence (percentage of population, having used weed in the year). Source: World Drug Report 2017 of the United Nations Office on Drugs and Crime
- Average Consumption of weed per year in grams (people who consumed weed at least once in the previous year).
- Estimation, with the assumption, that one use of weed on average means one joint.
- One joint is assumed to have 0.66 grams of weed as in the paper of Mariani, Brooks, Haney and Levin (2010).
- The distribution of use during the year is assumed to be the same as in Zhao and Harris (2004), where the yearly usage varies from once or twice a year to everyday.
- Total Consumption in Tons
- Consumption=Population*Prevalence*Consumption_year_gr
- Population: latest available local population data sources.
- Annual Prevalence (percentage of population, having used weed in the year). Source: World Drug Report 2017 of the United Nations Office on Drugs and Crime
- Average Consumption of weed per year in grams (people who consumed weed at least once in the previous year).
- Estimation, with the assumption, that one use of weed on average means one joint.
- One joint is assumed to have 0.66 grams of weed as in the paper of Mariani, Brooks, Haney and Levin (2010).
- The distribution of use during the year is assumed to be the same as in Zhao and Harris (2004), where the yearly usage varies from once or twice a year to everyday.
- US tax level – Average tax level in the states of US where weed is legal: Alaska, California, Colorado, Maine, Massachusetts, Nevada, Oregon and Washington. Includes retail sales taxes, state taxes, local taxes and excise taxes.
- Growshops – Sourced via Google Maps Listings 2018
- Headshops – Sourced via Google Maps Data Listings 2018
- Legality
- Legal, if possession and selling for recreational and medical use is legal.
- Illegal, if possession and selling for recreational and medical use is illegal.
- Partial, if
- Possession of small amounts is decriminalised (criminal penalties lessened, fines and regulated permits may still apply)
- OR medicinal use legal
- OR possession is legal, selling illegal
- OR scientific use legal
- OR usage allowed in restricted areas (e.g. homes or coffee shops)
- OR local laws may apply to legality (e.g. illegal at federal level, legal at state level)
First quote: Based on New York City Council’s free lunch initiative which began in September 2017, with 1.1 million public school children, at a cost of $1.75 per child per day.


