The Metropolitan Museum of Art to Receive Major Gift of Relief Prints by renowned Inuit printmakers from René Balcer and Carolyn Hsu-Balcer.
(New York, March, 2025)—The Metropolitan Museum of Art announced today the landmark gift of the René Balcer and Carolyn Hsu-Balcer Inuit Print Collection, which features over 500 relief prints by renowned Inuit printmakers from multiple regions across Nunavut and Nunavik, the semiautonomous Arctic homeland of Canada’s Inuit population. This important collection, gifted to The Met by René Balcer and Carolyn Hsu-Balcer, is among the strongest examples of Inuit graphic art in the United States. With works ranging from the mid-1940s to the present day, it includes major works by some of the most influential Indigenous women artists in history and will significantly enhance The Met’s collections of Inuit objects. The Balcer Collection represents diverse Inuit printmaking methods, including sealskin and paper stencils; monoprints; and carved stone, or stone-cuts, on paper, and features imagery of birds, animals, Inuit peoples, transformative figures, dreams, cosmologies, and hunting scenes.
Kenojuak Ashevak’s drawings and prints feature fantastical creatures and bold colors and forms. This captivating image of an arctic owl was among the first prints produced by the West Baffin Eskimo Cooperative. It quickly became a Canadian icon, and in 1970 the print was chosen for the country’s commemorative stamp.
“We are deeply grateful to René Balcer and Carolyn Hsu-Balcer for this extraordinary gift, which is a leading collection of Inuit masterworks in a U.S. museum,” said Max Hollein, The Met’s Marina Kellen French Director and Chief Executive Officer. “Mr. and Mrs. Balcer’s dedication to the support of Inuit artists is evident in this magnificent and comprehensive collection that celebrates the remarkable artistry of Native and Indigenous individuals and communities, and we are thrilled to be able to share these prints with visitors in our American Wing galleries.”
René Balcer began collecting Inuit art in Montreal, Canada, in the late 1970s. The René Balcer and Carolyn Hsu-Balcer Inuit Print Collection highlights the famous artists’ collective and printmaking studio at Baffin Island’s Cape Dorset, the source of Inuit printmaking that was established in the 1950s. The original artists working at Cape Dorset collectively identified as the West Baffin Eskimo Co-operative, and in 1960 they released their first official catalogued collection of 41 prints to great critical acclaim. The René Balcer and Carolyn Hsu-Balcer Inuit Print Collection includes some of the most celebrated Inuit artists associated with the collective, such as Jessie Oonark (1906–1985) and Kenojuak Ashevak (1927–2013), whose print The Enchanted Owl (1960) was featured on a commemorative Canadian postal stamp in 1970 and was on view in The Met exhibition A Decade on Paper: Recent Acquisitions, 2014–2024(August 26, 2024–February 23, 2025). Looking ahead, select works in the Balcer Collection will be included as part of ongoing annual rotations in the Art of Native America installation in the Museum’s American Wing.
“This is an aesthetically and culturally significant gift, and it has been an absolute pleasure to work with René Balcer and Carolyn Hsu-Balcer in our mutual goal to more strongly represent Inuit artists in The Met collection,” said Patricia Marroquin Norby (P’ urhépecha), Associate Curator of Native American Art in the American Wing. “The arrival of this beautifully curated collection aligns with our departmental vision to prioritize previously underrepresented artists and the presence, voices, and experiences of peoples and communities who have contributed greatly to our cultural and national identities. We look forward to collaborating with Inuit communities and individual artists to highlight these works in our galleries and programming.”
René Balcer and Carolyn Hsu-Balcer said, “One of the greatest challenges the Inuit face vis-à-vis the southern world is invisibility. At best, the Inuit and their brethren in the Circumpolar region are an abstraction to the rest of the world, glimpsed mostly through the distorted lens of pop history. At worst, the reaction the Inuit get when meeting non-Indigenous people is, ‘Oh, I thought you all died off years ago.’ It is our modest hope that this collection will demonstrate that the Inuit and their culture are very much alive and very much engaged in the modern world (to wit, see the following image of Annie Pootoogook’s Watching Jerry Springer from 2003). My wife, Carolyn, and I are very grateful to The Met for accepting the collection and committing its vast resources and reach to showcase to the world the creative brilliance, wisdom, and humor of Inuit artists.”
About René Balcer and Carolyn Hsu-Balcer
René Balcer is an Emmy-winning writer, producer, and creator of critically acclaimed TV series and documentaries. René’s engagement with the Canadian North began as a teenager working in lumber mills, hydro projects, and construction on airstrips in remote communities, often alongside First Nations and Inuit coworkers.
Among other artistic endeavors across North America and Asia, René and Carolyn recently organized and participated in a multiyear artist’s residency with Chinese artist Wu Jian’an and Inuit artists at the Uqqurmiut Centre for Arts and Crafts in Pangnirtung, Nunavut, and with renowned artists Shuvinai Ashoona, Ningiukulu Teevee, and Qavavau Manumie at Kinngait Studios (Cape Dorset). René’s poignant photographs of the Arctic have been featured in gallery exhibitions in New York and appear in his recently published portfolio, Seeing As (ACC Art Books UK). For the Silo, Meryl Cates/ The Metropolitan Museum of Art.
(above) Sample pages from Rene’s “Seeing As” Artbook
About The Met
The Metropolitan Museum of Art was founded in 1870 by a group of American citizens—businessmen and financiers as well as leading artists and thinkers of the day—who wanted to create a museum to bring art and art education to the American people. Today, The Met displays tens of thousands of objects covering 5,000 years of art from around the world for everyone to experience and enjoy. The Museum lives in two iconic sites in New York City—The Met Fifth Avenue and The Met Cloisters. Millions of people also take part in The Met experience online. Since its founding, The Met has always aspired to be more than a treasury of rare and beautiful objects. Every day, art comes alive in the Museum’s galleries and through its exhibitions and events, revealing both new ideas and unexpected connections across time and across cultures.
Feature Image: Kenojuak Ashevak. “Untitled (red woman/birds/wings/feet),”Drawing, pencil and ink 10x14in, 25.4×35.6 cm. Waddington, 9/18/20. René Balcer and Carolyn Hsu-Balcer Collection, Gift of René Balcer and Carolyn Hsu-Balcer, 2024 Kenojuak Ashevak. “Untitled (red woman/birds/wings/feet),”Drawing, pencil and ink 10x14in, 25.4×35.6 cm. Waddington, 9/18/20. René Balcer and Carolyn Hsu-Balcer Collection, Gift of René Balcer and Carolyn Hsu-Balcer, 2024
In 2024, Canada’s labour market showed modest growth, with job creation continuing but lagging rapid population growth. This led to an increase in the unemployment rate, reflecting a mismatch between labour force expansion and job creation rather than a decline in sector-specific labour shortages.
Ongoing challenges persist, such as declining labour productivity, sector-specific labour shortages, underemployment, demographic shifts and disparities, and regional imbalances.
Our international comparisons show that Canada typically ranks at or below the Organisation for Economic Co-operation and Development (OECD) average in terms of labour force participation and employment rates for certain population segments. This is largely due to weaker performance in specific regions, such as the Atlantic provinces, and pension policies that incentivize early retirement.
This labour market review emphasizes the need for tailored policies to improve labour market outcomes for seniors and immigrants. Recommendations include gradually increasing the retirement age, offering high-quality training support, and easing labour mobility barriers.
Introduction
The labour market is where economic changes most directly affect working-age Canadians, influencing their job opportunities and income. The supply of labour also determines the availability of Canadians’ skills and knowledge to employers who combine them with capital to produce goods and services that drive our national income and its distribution among income classes. Therefore, the labour market is one of the most important components of Canada’s – or any – economy.
In 2024, Canada’s labour market saw moderate growth, with employment rising to 20.7 million jobs. However, the employment rate declined to 61.3 percent, down from 62.2 percent in 2023, and remains below the pre-pandemic level of 62.3 percent in 2019. While over 1.7 million employed persons have been added since 2019, employment growth has lagged behind population growth, partly due to an aging population, despite high levels of immigration.1 The unemployment rate also increased, reflecting a gap between job creation and labour force expansion, partly due to limited absorptive capacity to keep pace with population growth.
Job vacancies have decreased since mid-2022, but over half a million positions remained unfilled during the third quarter of 2024 (12 percent higher than the pre-pandemic level). Of these vacancies, the majority were full-time (432,810 positions), with more than 31 percent remaining vacant for the long term – persisting for over 90 days. Despite high full-time vacancies, more than half a million workers were underemployed in 2024, seeking full-time work while employed part-time, indicating mismatches between the skills needed by employers and the skills offered by job seekers. Among sectors facing labour shortages, factors such as better relative wages and working conditions appear to be helping, particularly in industries like construction. Healthcare, on the other hand, may benefit from raising wages and reducing training costs to better attract and retain workers.
Further, Canada faces declining labour productivity, which can be attributed to factors such as stagnant capital investment and automation, high reliance on temporary foreign workers to fill low-paying positions, underemployment (including immigrants’ overqualification), a growing public sector with lower productivity, and shifts in industry composition.
This inaugural C.D. Howe Institute labour market review highlights major differences in the labour market across provinces and sectors and among socio-economic groups. It shows that labour force participation and employment of older workers and recent immigrants still have room for improvement.
Canada needs targeted workforce development policies to improve labour market participation and outcomes for diverse population groups and encourage a longer working life (Holland 2018 and 2019). Our recommendations are to:
Gradually raise the normal retirement age from 65 to 67 and delay pension access.
Support older workers with flexible work, part-time options, and self-employment, especially in the Atlantic provinces.
Invest in high-quality training programs for underrepresented groups, focusing on digital skills and job search strategies.
Streamline credential recognition and licensure for skilled immigrants and ease labour mobility in regulated occupations while maintaining the quality of professional services.
Enhance settlement strategies for immigrants, including workplace-focused language training.
Businesses should integrate automation and artificial intelligence (AI) to boost productivity while improving retention and encouraging later retirement by offering training2 and flexible scheduling (Mahboubi and Zhang 2023).Finally, better informing Canadians about learning and training opportunities and addressing financial and non-financial barriers would improve their training participation rates and empower them to acquire the skills needed in a changing labour market.
Overview of Canada’s Labour Market
Canada’s labour market has undergone major changes over time, influenced by factors such as the COVID-19 pandemic, globalization, technological progress, and demographic shifts. These forces have affected the functioning of the labour market, with demographic changes playing a particularly important role. This section reviews key indicators (i.e., labour-force participation, employment and unemployment) and highlights the major trends and disparities in provincial and national labour markets.
The labour force has grown steadily since 1976 but experienced a decline in 2020 due to the pandemic. The lockdowns and public health measures significantly reduced worker participation, especially among women, in the labour market. However, once the restrictions were lifted, workers returned, and the labour force fully recovered. By 2024, Canada had 22.1 million people in the labour force, an increase of about 1.9 million from 2019, mainly driven by the expansionary immigration policy that the country has followed until recently.3 Immigrants accounted for 56 percent of this increase in the labour force, while non-permanent residents made up 32 percent.4
Although the labour force has grown over time, the labour force participation rate (LFPR) has trended downward over the last two decades. This trend is largely driven by an aging population, as participation rates drop sharply after age 54 and continue to decline with age. While the LFPR among prime-aged workers (25-54) reached a record high in 2023, the overall rate remained below pre-pandemic levels and declined further in 2024, reaching 65.5 percent despite high levels of immigration.5 Three factors contributed to this decline compared to pre-pandemic levels: a lower participation rate among youth, a substantial increase in the older population (aged 55 and over) and a decline in the latter group’s participation rate. This decline in older workers’ participation is primarily due to aging, as the proportion of seniors aged 65 and over within the 55-and-over age group increased from 54.8 percent in 2019 to 60 percent in 2024.
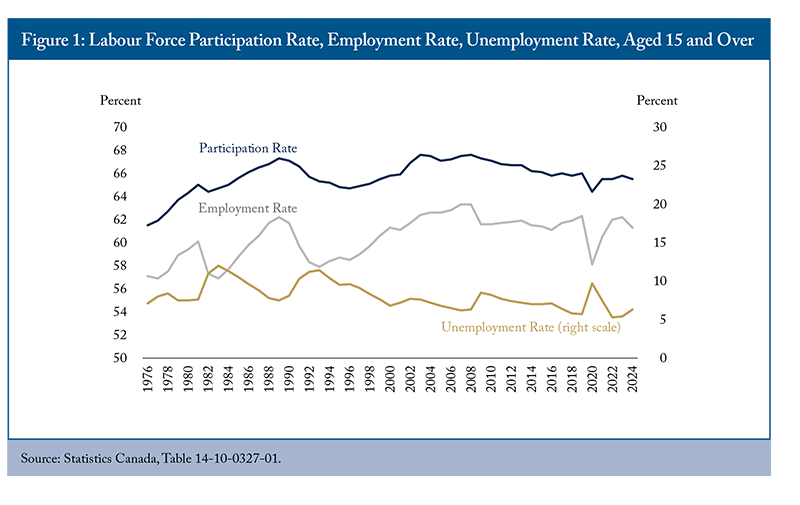
The employment rate is more sensitive to economic conditions and fluctuates with cyclical changes in the unemployment rate. It is also influenced by factors such as government policies on education, training, and income support, as well as employers’ investments in skill development and their effectiveness in matching people to jobs. Despite some volatility during economic booms and recessions, the employment rate trended upward until 2008 but has declined since then, mirroring the impact of an aging population on the participation rate (Figure 1). The pandemic caused a sharp decline in the employment rate, followed by a modest recovery. In 2024, the rate, however, declined again by approximately one percentage point to 61.3 percent, as employment growth (1.9 percent) failed to keep pace with the population growth (3 percent).
Regional disparities in employment persist across Canada. Alberta consistently maintains the highest employment rate, while Newfoundland and Labrador lags. Despite significant improvements since 1976, the Atlantic provinces continue to face challenges with employment. For its part, Ontario’s employment rate – historically the second highest in the country – has been below the national average since 2008. Regional differences in economic development, sectoral specialization patterns, educational attainment, family policy, and demographic characteristics are factors behind these employment disparities. For example, Newfoundland and Labrador and New Brunswick had the highest old-age dependency ratios (OADs) in 2024 at 39 and 37 percent, respectively, while Alberta remains the youngest province with an OAD ratio of less than 23 percent.6
The unemployment rate, a key short-term indicator, tends to rise during economic downturns and fall back during recovery, affecting employment outcomes in the opposite direction (Figure 1). The onset of the pandemic in 2020 led to a temporary surge in the unemployment rate to 9.7 percent – a four-percentage point hike from the previous year. As the economy recovered, the unemployment rate plummeted to a record low of 5.3 percent in 2022. However, by 2024, it had risen to 6.3 percent, a figure that remains relatively low by historical standards but higher than the pre-pandemic rate in 2019.
While employment grew by 1.7 million people between 2019 and 2024, the labour force expanded even faster, increasing by 1.9 million people. This imbalance – where the labour force grew more quickly than employment – pushed the unemployment rate higher, reflecting a loosening labour market and making it more challenging for job seekers to secure employment.
Overall, the labour force and employment in Canada have been expanding due to a surge in immigration. Despite unemployment rates remaining higher than the pre-pandemic level, this primarily reflects the exceptional growth in the labour force rather than a lack of job creation. The labour market continues to adjust to the increase in labour supply through strong job creation.
Looking ahead, several uncertainties and factors could influence unemployment rates. For example, the imposition of trade tariffs by the United States poses a direct risk to export-related jobs. In 2024, 8.8 percent of workers – equivalent to 1.8 million people – were employed in industries dependent on US demand for Canadian exports.7 Sectors most vulnerable to these risks include oil and gas extraction, pipeline transportation, and primary metal manufacturing.
On the other hand, stricter immigration policies that limit the inflow of permanent and non-permanent residents may reduce the growth of the labour force, which could, in turn, place downward pressure on the unemployment rate. However, the ongoing arrival of refugees, which contributes to the growing population of non-permanent residents, could lead to higher unemployment rates, particularly if newcomers face significant challenges integrating into the labour market.
To mitigate the negative impacts of aging on the labour market and address labour needs, it is important to encourage greater participation of underrepresented groups and seniors, ensure new entrants and young workers are equipped with the relevant skills to meet the labour market needs and enhance the productivity of the existing workforce. However, declining labour productivity poses an additional challenge that requires urgent attention.
Trends in Labour Productivity
Labour productivity8 in Canada has generally trended upward until the pandemic, but with a general downward trend in its growth rate. In 2020, average productivity surged to $68.5 per hour worked (in 2017 dollars), mainly driven by compositional changes in employment towards more productive jobs, particularly in the business sector, since most job losses were among low-wage workers. However, this gain proved short-lived; by 2023, productivity fell to $63.6, returning to nearly the same level as in 2019 (Figure 2).
Declining productivity has contributed to a reduction in real GDP per capita, which is a key indicator of Canadians’ living standards. Although Canada’s GDP rose by 6.9 percent (in 2017 dollars) between Q4 2019 and Q4 2023, GDP per capita decreased by 0.2 percent over that period. Since 2020, Canada’s GDP per capita growth has averaged an annual decline of 1.3 percent, compared to a growth rate of 1 percent per year between 2010 and 2019 (Wang 2022). Labour productivity continued to decline in 2024 as real GDP growth fell short of the growth of hours worked. This stands in stark contrast to the robust growth of labour productivity seen in the US during the same period.
Several factors, including human capital stock, skills utilization, overqualification, the concentration of immigrants in low-skilled jobs, limited capital investment, and slow adoption of technology, have likely contributed to recent poor labour productivity trends (Wang 2022; Robson and Bafale 2023, 2024). Notably, the combined influx of immigrants and non-permanent residents has driven the majority of employment growth between 2019 and 2024, accounting for 89 percent of the total increase in employment. Although immigrants and non-permanent residents are more likely than Canadian-born workers to have a university education, many are overqualified and work in jobs that require only a high-school diploma (Mahboubi and Zhang 2024). According to the 2021 census, the overqualification rate among immigrants9 and non-permanent residents was 21 percent and 32.4 percent, respectively, while only 8.8 percent of Canadian-born individuals with a bachelor’s degree or higher were overqualified (Schimmele and Hou 2024). With rising immigration, Canada’s productivity will increasingly depend on how effectively it leverages and develops the skills of new immigrants (Rogers 2024).
The recent influx of newcomers can help mitigate the impact of an aging population as they tend to be younger, typically being at their prime working age (Maestas, Mullen and Powell 2023). However, the concentration of immigrants and non-permanent residents in lower-skilled, low-paying sectors and occupations reduces productivity and, consequently, their contribution to GDP per capita. According to Lu and Hou (2023), between 2010 and 2019, non-permanent residents (work permit holders) were increasingly concentrated in several low-paying industries: accommodation and food services, retail trade, and administrative and support, waste management and remediation services.10 Collectively, these industries accounted for 45 percent of all temporary foreign workers in 2019. With the surge of non-permanent residents, one would expect the situation to have worsened in 2023 since the cap for hiring low-wage temporary foreign workers in 2022 increased from 10 percent to 30 percent in seven sectors, including accommodation and food services and to 20 percent for other industries.11 Similarly, Picot and Mehdi (2024) found that immigrants contribute approximately equal amounts of lower-skilled and higher-skilled labour, with 35 percent of those who landed in 2018 or 2019 working in lower-skilled jobs by 2021.
Relying on temporary foreign workers and immigrants to fill lower-skilled, low-paying jobs means that labour becomes a cheaper option than capital, which naturally disincentivizes businesses from investing in productivity-enhancing technology.12 Increases in the supply of labour also discourage business investment in skills upgrading for the existing workforce (Acemoglu and Pischke 1999).
Increases in labour supply without corresponding higher capital investment will also depress productivity. According to Robson and Bafale (2023), a larger labour force resulting from high immigration will not lead to higher living standards if workers are not equipped with better tools to produce and compete. Young and Lalonde (2024) also found that two-thirds of productivity declines since 2021 stem from this population shock.
Technological advancements, particularly digitalization and AI, offer opportunities to boost productivity. Mischke et al. (2024) find that digitalization and other technological advances could add up to 1.5 percentage points to annual productivity growth in advanced economies. Nevertheless, Canada has been slow in capital investment, automation and AI adoption.
The expansion of the public sector also poses challenges. Compared to 2019, public-sector employment increased by 19.6 percent in 2024, while private sector employment only saw an 8.5 percent increase. Consequently, public-sector jobs in 2024 accounted for 21.5 percent of all employment in Canada, up from 19.6 percent in 2019. However, public-sector productivity has lagged the business sector since 2019. In 2023, it was $58.20 per hour worked, 1.5 percent lower than its 2019 level and 1.5 percent below that of the business sector. With a higher share of public employment in the economy, this lower productivity in the public sector reduces overall labour productivity.
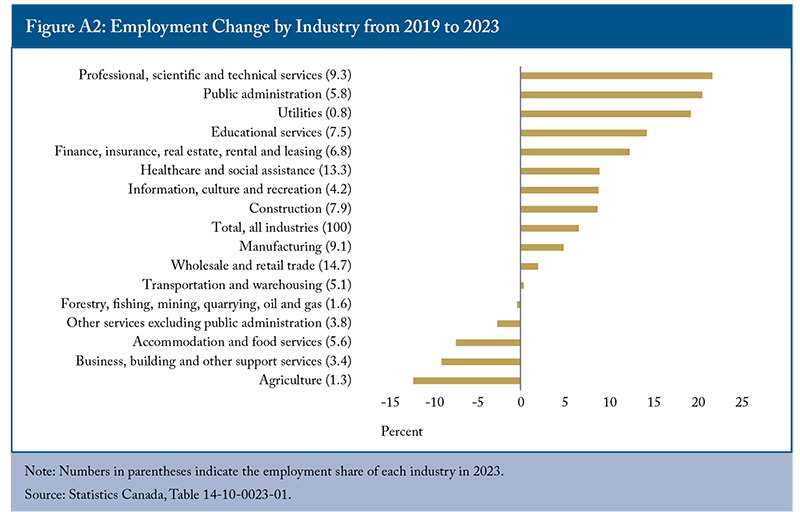
Lastly, significant variations in productivity across industries within the business sector shape Canada’s overall performance (Appendix Figure A1). Some industries, such as educational services, experienced notable productivity gains of 25 percent between 2019 and 2023. In contrast, some low-productivity industries faced substantial declines, with that of holding companies decreasing by 60 percent and construction and transportation dropping by 10 percent.13 Labour productivity in industries with the largest employment gains remained unchanged (professional, scientific, and technical services) or declined (public administration) during the same period (Appendix Figure A2). In contrast, agriculture and accommodation and food services witnessed productivity increases, likely due to investments in machinery and automation accompanying employment declines.
Therefore, the industrial distribution of jobs, shifts in industry composition, and demographic changes within industries can greatly affect Canada’s overall productivity. Tackling Canada’s productivity challenges will require substantial capital investment, targeted initiatives in skills development, technological advancements, and industry-specific strategies to promote sustainable economic growth.
Employment by Skill Level
Skill-biased technological changes – innovations that primarily benefit highly skilled workers, such as those proficient in technology, complex problem-solving, and critical thinking – have increased the demand for high-skilled labour in today’s job market. Despite the limitations of that approach, education has generally been used as a proxy for skills. In response to labour market needs, there has been a significant surge in higher education attainment among Canadians over time. The proportion of the population aged 25 and over having a postsecondary certificate, diploma or university degree rose from 37 percent in 1990 to 69 percent in 2024. According to OECD (2024), Canada has the highest postsecondary education attainment rate among core working-age individuals (25-64).
Despite these educational advancements, Canada faces productivity challenges and lags in technological adoption, particularly relative to the United States. One explanation is that although higher levels of education should translate into greater skills – leading to enhanced productivity, employability and adaptability to labour market changes – other factors such as education quality, experience, on-the-job training, capital investment, technological advancement, skill utilization, and age can substantially influence individuals’ skills levels (Mahboubi 2017b and 2019; Robson and Bafale 2023).
Skills and education levels heavily influence labour-market outcomes. For example, labour force participation, including among seniors, increases with educational attainment and those with higher education tend to remain in the labour market longer. This can mitigate some of the negative effects of an aging labour force, as significantly more seniors today possess a formal education above high school compared to decades ago and can take advantage of the ongoing shift from physical work to knowledge-based work.
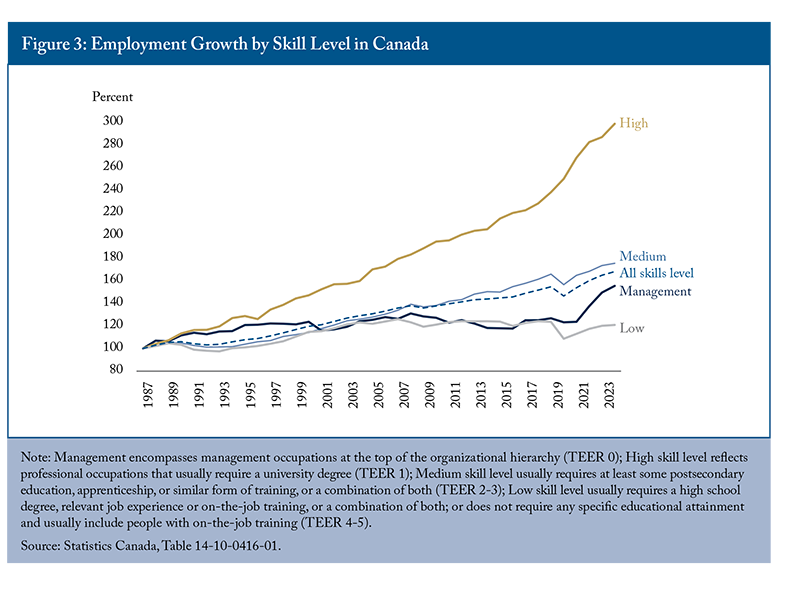
In parallel with increases in the supply of highly educated labour, there has been a shift in skills requirements among employers.14 Figure 3 shows employment in high-skill-level occupations has seen remarkable growth over the past three decades, increasing by 299 percent from 1987 to 2024. Notably, during the pandemic, employment in high-skill-level roles continued to grow, even as jobs in other skill categories declined. By 2024, high-skill-level occupations accounted for 23 percent of total employment. Despite this growth, medium- and low-skill-level occupations remain predominant, employing approximately 8.1 million and 5.8 million workers, respectively, compared to 4.8 million in high-skill roles. In the last two decades, immigrants and non-permanent residents have increasingly taken both high-skilled and low-skilled jobs. Between 2001 and 2021, they accounted for half of the employment growth in professional and technical skill occupations (Picot and Hou 2024). Over the same period, employment in lower-skilled occupations decreased by half a million. However, more immigrants and non-permanent residents increasingly occupied low-skilled positions, while Canadian-born workers significantly transitioned away from these roles (Picot and Hou 2024). By 2021, immigrants were more concentrated in professional and lower-skilled occupations compared to their Canadian-born counterparts.
In general, the Canadian labour market has performed well since the pandemic, with particularly strong employment growth for high-skill level occupations. As demand for high-skilled labour continues to grow, improving education quality, promoting on-the-job training, and better utilizing the skills of the workforce are essential for maintaining this balance, maximizing the benefits of educational advancements, enhancing productivity and meeting the evolving demands of the labour market.
Imbalances of Labour Supply and Demand
Studying the relationship between unemployment and job vacancies provides insight into labour supply and demand imbalances. It allows us to examine two problems that hinder business growth and slow the economy down: the lack of sufficient employment opportunities for job seekers and the absence of people with the right skills to fill existing jobs.
This relationship is often described by the Beveridge curve, which illustrates how job vacancy rates and unemployment typically move in opposite directions. However, as noted by Blanchard, Domash, and Summers (2022), shifts in this relationship can occur due to factors such as increased labour demand or structural changes in the economy, leading to both higher vacancy rates and higher unemployment simultaneously.
From 2021 to mid-2022, Canada experienced a tight labour market, with an increase in job vacancies alongside declining unemployment. In response, the federal government relaxed several immigration policies to help address these shortages. However, Fortin (2024, 2025) found that a surge in immigration, particularly driven by temporary immigrants, may aggravate job vacancy rates in the overall economy, as observed in Canada between 2019 and 2023. While immigration can initially alleviate skilled labour shortages, it can also intensify shortages in the broader economy due to increased demand from newcomers for goods and services.
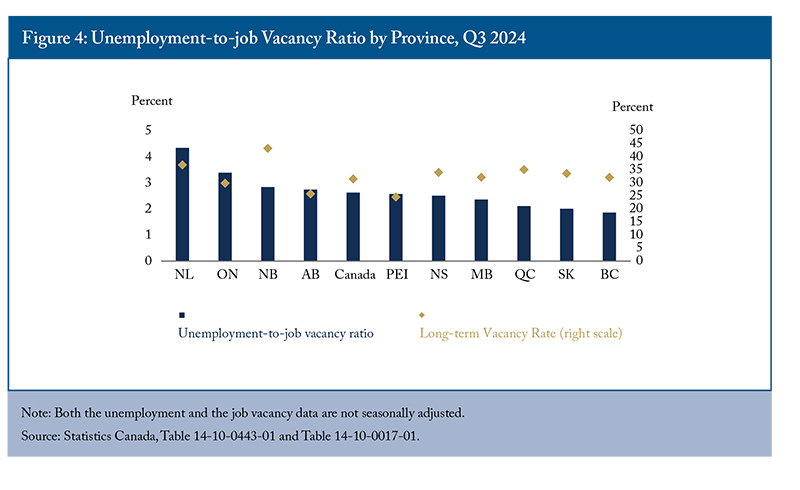
In 2024, the labour market transitioned from a state of tightness to a slackening one. In the third quarter of 2024, job vacancies in Canada totalled more than 572,000,15 marking a 12 percent increase compared to the pre-pandemic level in Q4 2019. With 1.5 million unemployed people in the labour market, there were more than two job seekers for every vacant position during that quarter. However, the provincial situations varied (Figure 4). For example, while British Columbia experienced a relatively tighter labour market, with fewer than two unemployed persons for each vacant position, there were more than four unemployed persons available per vacant position in Newfoundland and Labrador. However, the long-term vacancy rate – the share of openings that remained vacant for 90 days or more in total vacancies – in that province was 36.9 percent, which was four percentage points higher than the British Columbia rate in the third quarter of 2024. This indicates both limited employment opportunities for those unemployed and a mismatch between existing skills and those demanded by employers.
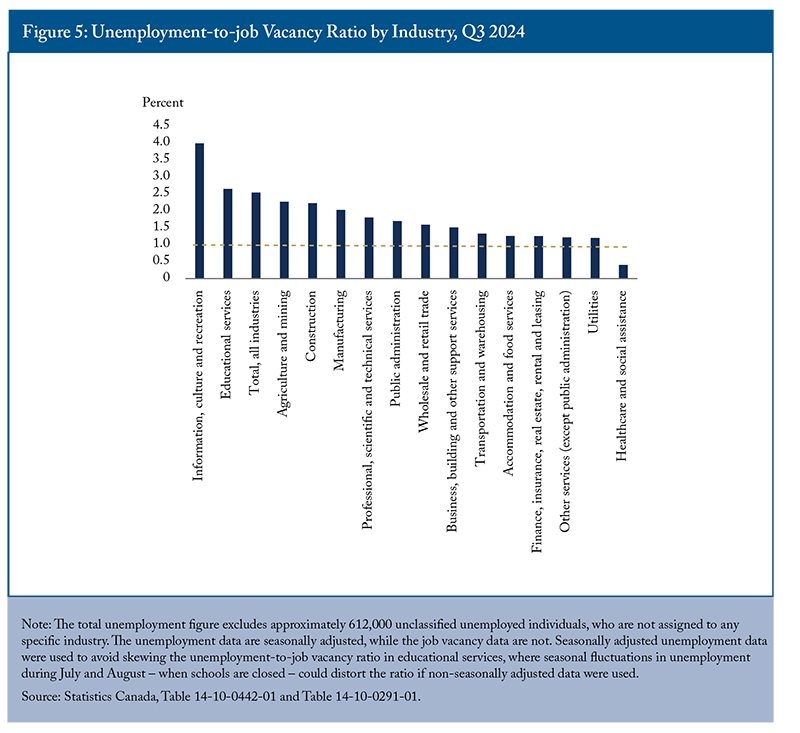
Imbalances between labour supply and demand in Canada also exist at the industry level (Figure 5). For example, while the healthcare sector faces severe labour shortages, the information, culture and recreation industry has the highest unemployment-to-vacancy ratio, indicating an excess labour supply. One interesting observation is that while both the construction and manufacturing sectors had similar levels of excess labour supply, the vacancy rate in construction was significantly higher at 3.6 percent, compared to 2.2 percent in manufacturing. This suggests that employers in the construction sector face more challenges in finding workers with the right skills.
The unemployment-to-job vacancy ratios across industries excluded some 612,000 unclassified unemployed persons: those who had never worked before or were employed more than a year earlier. According to Statistics Canada, about 43 percent of job vacancies in the third quarter of 2024 were for entry-level positions, which is helpful for those unclassified unemployed persons as these roles typically do not require prior experience. However, the specific skills and education requirements of these entry-level positions remain unclear.
An analysis of educational requirements for vacancies in the same quarter shows that 48 percent of all job vacancies required post-secondary training or education. Positions requiring post-secondary education below a bachelor’s degree had an unemployment-to-job vacancy ratio of 2.6, while those requiring a bachelor’s degree or higher faced a higher ratio of 4.1. In contrast, vacancies requiring only a high-school diploma or less had a lower unemployment-to-job vacancy ratio of 1.8. However, employers find it more challenging to secure suitable candidates for positions requiring higher educational levels and specialized skills, particularly at wage levels that candidates are willing to accept.
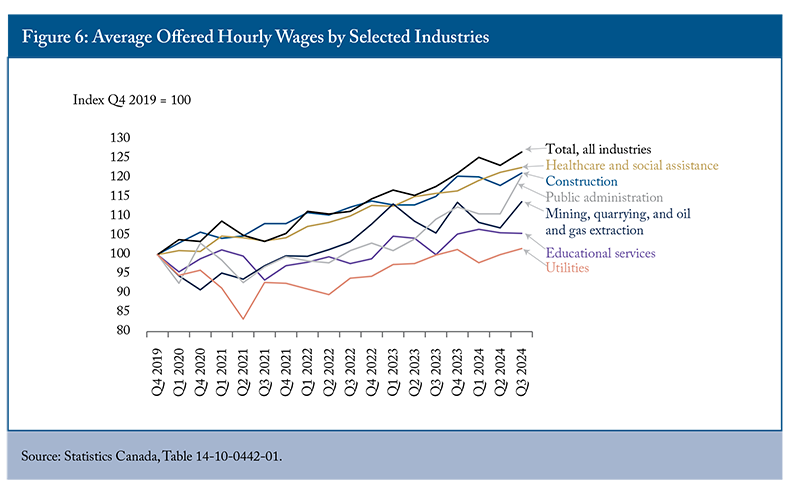
Wages play an important role in reducing labour market imbalances, as they affect both the supply and demand for labour and encourage labour mobility and reallocation. Between Q4 2019 and Q3 2024, the average offered hourly wage saw the largest increases in industries such as arts and entertainment, agriculture, and information and cultural industries (over 30 percent). These sectors also experienced the most significant reductions in job vacancies, suggesting that offering higher wages can help alleviate labour shortages. To address shortages more broadly, there may also need to be a restructuring of relative wages and working conditions between occupations with labour shortages and those with surplus labour.
Offered wage, or stated salary, rates for vacant positions should largely depend on the growth of job vacancies and the difficulties in finding candidates to fill them. However, Figure 6 shows that industries experiencing a surge in vacancies post-pandemic did not respond consistently. In fact, the average hourly offered wage in these industries fell short of the national average, which was 27 percent between Q4 2019 and Q3 2024. For example, despite substantial growth in vacancies and a shortage of candidates in healthcare, the average offered wage growth in this industry only increased by 23 percent. This is largely due to government control over wages, making them less responsive to market forces. Policies like Ontario’s Bill 124, which capped annual wage increases at one percent for civil servants from 2019 to 2022, have contributed to this restraint. Additionally, multi-year labour contracts and provincial efforts to reduce deficits and debt post-COVID have further limited wage growth in the sector.
In Q3 2024, the average hourly offered wage in the utilities sector only increased by 2 percent compared to the pre-pandemic level, despite a 48 percent increase in job vacancies. Employers in this sector need to raise wages to attract and retain workers with the necessary skills. Otherwise, they will rely on their current workforce to work longer hours to maintain operations, which can lead to lower productivity per additional hour of work and retention challenges.
The average offered wage rate by occupation follows a similar trend (Appendix Figure A3). For example, despite a 59 percent increase in job vacancies, the wage rate for occupations in education, law and social, community and government services only rose by 16 percent, which is below the national average. This further highlights the need for employers to raise wages and improve working conditions to attract and retain workers.
Outcomes by Demographic Characteristics
While labour market indicators point to a strong post-pandemic recovery characterized by high employment, not all working-age Canadians have equally participated in and benefited from this resurgence, highlighting untapped potential across different population groups. Notably, recent demographic trends highlight that the older population and immigrants experience distinct labour market outcomes. Seniors (aged 65 and over) have substantially lower labour force participation rates compared to other demographics, raising concerns about both their economic security and potential contributions to the workforce. Additionally, immigrants frequently face employment barriers that limit their ability to fully integrate into the labour market and contribute to addressing the challenges posed by an aging population. Understanding the labour market outcomes for these groups is important for identifying the obstacles they face and formulating targeted policy recommendations to enhance their participation and success in the workforce.16
Age
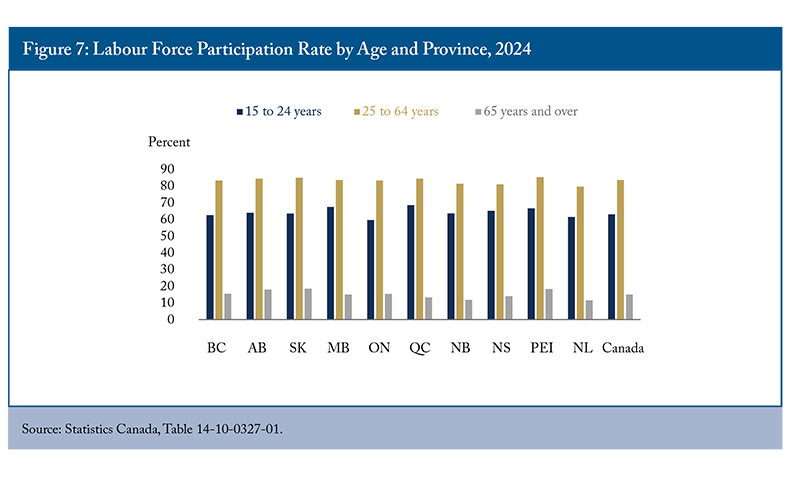
There are significant variations in labour force participation across age groups. As expected, seniors exhibit the lowest participation rates, with their engagement in the labour market declining substantially after age 65 (Figure 7). Seniors’ participation rate is low across all provinces, albeit with varying degrees. For instance, Saskatchewan has the highest participation rate for seniors at 18.5 percent, while Newfoundland and Labrador records a notably lower rate of 11.5 percent. The four provinces in the Atlantic region, where the aging problem is more severe, have the lowest participation rate. A lack of employment opportunities for seniors in this region seems to be a major driver, with their unemployment rate significantly higher than both the national average and their counterparts aged 25 to 64 (except for Nova Scotia) (Figure 8).
While seniors participate far less than other Canadians in the labour market, Figure 9 shows significant shifts in their average retirement age over time and notable differences across employment types. Self-employed workers consistently retire later than other workers, with their average retirement age exceeding 68 in recent years, while public sector workers tend to retire earlier. These trends likely reflect variations in pension structures, job security, and financial incentives across employment types. Between 1976 and 1998, the average retirement age of all workers declined by four years to 60.9, likely influenced by the introduction of early retirement pension schemes in order to free up jobs for younger workers (OECD 2017). However, this shift had no obvious impact on younger workers’ employment. Many economists also warned that these measures were shortsighted, as the aging of the baby boomer generation would eventually create new challenges. Meanwhile, concerns about the financial sustainability of pension systems grew due to the increasing life expectancy and subsequent rising costs of providing retirement income (Banks et al. 2010; Herbertsson and Orszag 2003; Jousten et al. 2008; Kalwij et al. 2010; OECD 2017).
In response, the federal government in 2012 increased financial penalties for early retirement to encourage longer working lives.17 Consequently, the average retirement age of all workers began to rise and reached 65.3 in 2024, slightly surpassing its 1976 level. However, the persistent gap between the public sector and self-employed workers suggests that policy adjustments – such as pension reform or incentives for longer careers in the public sector – could be considered to encourage more uniform retirement patterns across employment types. The recent influx of immigrants may also help to alleviate the impact of the retirement wave, as immigrants are more likely to keep working and retire later. According to Fan (2024), the average retirement age among immigrant workers is around 66 over the last decade, two years older than that for Canadian-born workers.
Accordingly, the LFPR of seniors has increased substantially from a historical low of 6 percent in 2001 to 15 percent in 2024. Termination of mandatory retirement, lack of sufficient savings, higher educational attainments, and better health conditions among seniors have contributed to these LFPR increases.18 Hicks (2012) predicts that social and economic pressures will lead to further delay in retirement in the future. For example, of all seniors aged 65 to 74, including both Canadian-born and immigrants, one in ten were employed in 2022 (Morissette and Hou 2024). Nine percent reported working by necessity, while immigrant seniors were more likely to do so than their Canadian-born counterparts.
In the long run, labour productivity growth is the primary driver of Canada’s GDP per capita growth, though the participation rate of seniors can also have a significant impact. Wang (2022) found that during the pandemic, declines in employment and participation rates driven by young people and seniors were major contributors to the sharp drop in GDP per capita. He estimated that if work intensity, the employment rate, and the participation rate had maintained their pre-pandemic momentum from 2010 onward, Canada’s GDP per capita could have been 4 percent higher in 2021 than it was.
As babyboomers are gradually retiring, their lower LFPR will continue to influence the overall participation rate. Vézina et al. (2024) found that the overall participation rate is expected to continue declining in the short term, regardless of the number of immigrants selected. Across various scenarios, the overall participation rate appears to be more sensitive to changes in the participation of seniors than to increases in immigration.19 As a result, keeping older workers, particularly those aged 55 and over, in the labour market could significantly impact the future overall participation rate. As more older workers remain employed, improvements in employment assistance, labour market flexibility, and skills upgrading will be essential (Vézina et al. 2024).
International Comparisons of Pension and Retirement Policies
An international comparison reveals that differences in pension and retirement policies play a crucial role in explaining disparities in employment and retirement decisions across countries (Figure 10). Factors such as the flexibility to choose between continuing to work or claiming a pension, legal provisions regarding age-based termination of employment, and employers’ retention strategies – such as offering on-the-job training and flexible work schedules – greatly influence retirement timing.
One of the most significant factors contributing to the variation in employment decisions across OECD countries is the normal age at which individuals can claim full pension benefits. For instance, in 2022, over 32 percent of Iceland’s population aged 65 and over was employed, although the normal retirement age is 67, with the earliest pension access at age 65. In contrast, only about 14 percent of Canada’s population in the same age group remained employed despite having a higher life expectancy. This discrepancy can be explained by Canada’s normal retirement age of 65, with pension benefits available as early as age 60.
Cross-country analyses show that policy reforms reducing financial incentives for early retirement were key drivers behind the increase in old-age employment (Coile et al. 2024). To address challenges related to aging populations, many countries such as Australia, Denmark, the UK, Japan and Italy have raised, or plan to gradually increase, the retirement age to encourage longer working lives. Denmark and Sweden have even indexed their mandatory retirement ages to life expectancy. Canada should consider similar approaches by raising the normal retirement age and delaying the earliest access age.
Immigrants
International immigration has significantly contributed to Canada’s population and labour force growth. Between 2019 and 2024, immigrants and non-permanent residents accounted for 68 percent of the population growth and over 88 percent of the increase in the labour force. However, immigrants often encounter various obstacles such as language barriers, a lack of Canadian work experience and varying recognition for foreign education and experience (Mahboubi and Zhang 2024). These challenges can limit their employment opportunities and earnings. Furthermore, as Canada faces an aging population, the challenge of integrating immigrants into the workforce becomes even more critical. While aging workers often possess valuable experience, they may struggle with the physical demands of certain jobs or require retraining. Newcomers, on the other hand, may not be immediately equipped to fill these gaps in employment. The productivity levels of immigrants can also be affected by their integration into the labour market, as they may require additional training and support to navigate workplace expectations and cultural nuances.
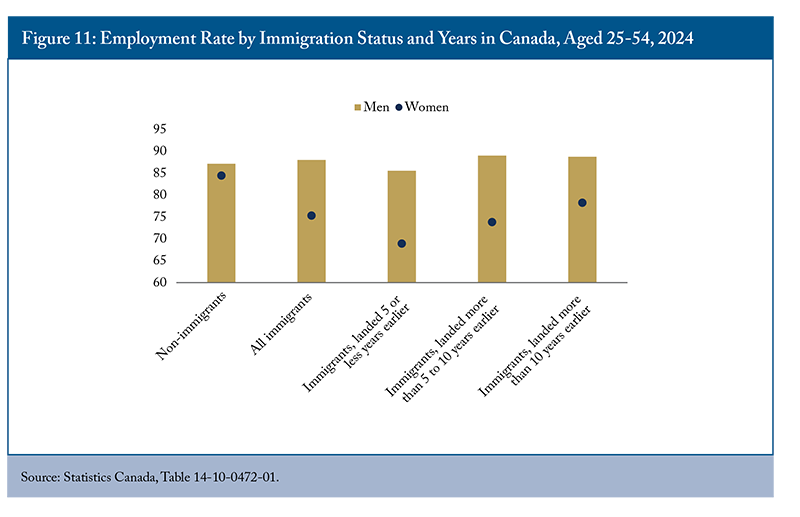
In 2024, immigrants aged 25 to 54 had a lower employment rate (by 4.3 percentage points) compared to non-immigrants (Figure 11). This gap has narrowed since 2006 and continued to decline even through the pandemic despite the latter’s greater impact on immigrants.20 The remaining gap is mainly due to the lower employment rate of female immigrants.
Employment outcomes of immigrants, particularly among women, depend predominantly on the number of years spent in Canada. For women aged 25-54, the employment gap between female non-immigrants and more recent immigrants (who landed less than 5 years) was 15.5 percentage points. This gap narrowed to 10.6 percentage points for immigrants who landed between 6 and 10 years and further to 6.2 percentage points for those who have been in Canada for more than 10 years.
Over the last decade, the improvements in immigrant employment rates are likely attributed to several factors. These include an increased selection of economic immigrants from non-permanent residents with Canadian work experience, the implementation of the Express Entry21 system for immigration selection, and favourable economic conditions where the demand and supply of immigrant labour are broadly aligned (Hou 2024). In addition, the growth in managerial, professional, and technical occupations accelerated in the late 2010s (Frenette 2023), which would benefit recent immigrants with a university education. Recent immigrants in the prime age group of 25 to 54 have seen faster employment rate growth since the early 2010s, with a notable increase of 13.1 percentage points from 2010 to 2024, compared to a 3.5 percentage point increase among non-immigrants.
However, it’s important to note that some of these conditions may change in the short term. For example, the employment rate for recent immigrants stalled from 2022 to 2023, a period when labour shortages eased, and levels of both permanent and non-permanent immigration rose rapidly (Hou 2024). As such, the dynamics of labour supply and demand have changed, particularly with the increases in the labour supply of new immigrants and non-permanent residents coupled with a cooling labour market and rising unemployment. This could negatively affect the employment outcomes of foreign-born residents in Canada more than those of Canadian-born individuals, as immigrants are often disproportionately affected during economic downturns. In 2024, there was a large increase in the unemployment rate of recent permanent immigrants, rising from 8 percent in 2023 to 9.9 percent. This is more than double the unemployment rate of non-immigrants, indicating the difficulties recent immigrants face in securing employment.
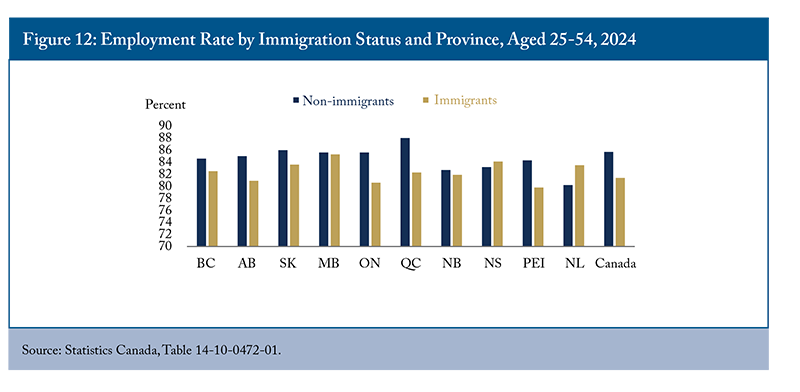
The employment rate of immigrants residing in some provinces is lower than the national rate, such as Ontario and PEI (Figure 12). The relatively poor employment outcomes among immigrants in these provinces may stem from specific employment barriers unique to immigrants, as the unemployment rate of non-immigrants in these provinces remains below the national rate. However, immigrants in Newfoundland and Labrador have a higher employment rate than non-immigrants. In contrast, the employment gap between immigrants and non-immigrants is most pronounced in Quebec, a province with the highest employment rate for non-immigrants in Canada. This gap can, to some extent, be due to a large gap in the unemployment rates of these two population groups. The unemployment rate of immigrants in Quebec is twice that of non-immigrants (or a gap of 3.5 percentage points). Grenier and Nadeau (2011) show that the lack of knowledge of French largely explains why the employment rate gap between immigrants and non-immigrants is larger in Montreal than in Toronto. Greater emphasis on official language training could enhance their ability to fully participate in the local labour market.
Policy Discussion
While the Canadian labour market has shown resilience post-pandemic and continued to perform relatively well in 2024, significant disparities across regions, industries, and demographic groups highlight opportunities to improve participation and employment outcomes. Further, Canada’s declining productivity poses a challenge to the labour market’s ability to drive sustained economic growth and competitiveness.
Demographic shifts, particularly an aging population, continue to affect participation rates and contribute to some shortages. Notably, the expansion of the health industry and the associated labour shortages are closely tied to Canada’s aging population. However, in some industries, average offered wages have not risen enough to attract a larger labour supply, and employers have not sufficiently adopted alternative strategies, such as capital investment and automation, to address their workforce needs.
Addressing these challenges requires a holistic approach. Beyond automation and higher wages, investing in existing workers and removing barriers to labour-market participation by underrepresented groups – such as women, youth, Indigenous Peoples, and seniors – can significantly improve labour market outcomes.
Regional differences in economic conditions contribute to provincial variations in the participation of seniors, while differences in pension and retirement policies play an important role in driving discrepancies in retirement timing across countries. Gradually increasing the normal retirement age is a strategy adopted by some countries to encourage later retirement among seniors. In Canada, the federal government in Budget 2019 offered a way to make later retirement financially more attractive by increasing the Guaranteed Income Supplement (GIS) earnings exemption, allowing seniors to retain more of their increased income if they choose to work. However, provincial measures aimed at boosting older workers’ labour force participation have had mixed results. For instance, Lacroix and Michaud (2024) found that a tax credit in Quebec designed to boost employment among older workers had no significant impact on transitions in or out of the labour force, with only modest effects on earnings for those aged 60 to 64. The study concluded that this measure was not a cost-effective way to increase public revenue or employment rates for older workers.
While the Conservative government in 2012 announced a plan to gradually raise the eligibility age for Canada’s Old Age Security benefits from 65 to 67 starting in 2023, the newly elected Liberal government cancelled the plan in 2016. However, with an aging population and increasing longevity, Canada should reconsider gradual adjustments to the normal retirement age and the earliest access age to help sustain public pension systems and ease demographic pressures. This approach aligns with successful international models, though it requires careful implementation to account for differences in job types and income levels.
Seniors today are healthier and living longer, and delaying retirement can offer both personal and economic benefits and ease demographic transitions (Robson and Mahboubi 2018). Longer working lives allow individuals to accumulate greater retirement savings, reducing the risk of financial insecurity in old age. Working longer has also been linked to better cognitive function, mental well-being, and social engagement.
That said, raising the retirement age would affect workers differently depending on their occupations and financial situations. While high-income, knowledge-based workers may benefit from extended careers through flexible work arrangements or hybrid options, many low-income workers in physically demanding jobs – such as those in construction, manufacturing, or caregiving – may find it challenging to work longer. Policies promoting flexible work options, lifelong learning initiatives, and encouraging and monitoring training program uptake22 can help older workers stay in the workforce longer and maintain their skills (Mahboubi and Mokaya 2021).23 Targeted support, such as enhanced workplace accommodations, phased retirement options, and retraining programs for workers in physically demanding jobs, could ensure that a later retirement age does not disproportionately burden lower-income individuals.
In response to population aging and existing labour shortages, Canada has increasingly relied on higher levels of immigration. However, the overqualification of immigrants’ skills and credentials, particularly among those from non-Western countries, remains a persistent issue. The successful integration of newcomers into the workforce is important to mitigate the short-term impact of an aging population on the labour market and enhance productivity. For example, recognizing the credentials of foreign-trained professionals in fields like healthcare could increase their productivity and earnings, helping to address the chronic shortage of healthcare workers. However, many skilled immigrants hold qualifications in regulated fields overseen by provincial regulatory bodies, which creates considerable barriers to entering the labour market. While these regulations aim to uphold public safety, they differ among provinces. Over the past few years, several provincial governments have taken steps to reduce barriers for foreign-trained immigrants. For instance, British Columbia and Nova Scotia have expedited credential assessments for foreign-trained healthcare professionals, which helped expand their healthcare workforce. Other provinces should consider adopting similar initiatives.
Licensed workers, either immigrants or non-immigrants, in these occupations also face barriers if they wish to change their province of residence. Easing provincial labour mobility in regulated professions could help reduce regional labour shortages in these sectors. Ensuring immigrants’ skills and qualifications are recognized and accepted by employers is also important.
Canada also needs to adopt more effective settlement strategies, with a strong emphasis on improving language proficiency for immigrants who struggle with communication skills. Language training tailored to workplace culture can also bridge language gaps and help newcomers obtain licences to integrate into the labour market. A notable example is the Health English Language Pro (HELP) program, which was launched by ACCES Employment to support internationally educated physicians. The program pairs Canadian physician volunteers with internationally trained medical graduates to help them acquire the necessary medical English skills. Furthermore, in recent years, the expansion of language training facilities has not kept pace with the explosive increase in the number of permanent and temporary immigrants. Governments need to systematically evaluate settlement service agencies to assess the returns on investment and enhance the effectiveness of these services in the labour market.
In addition to reducing regional disparities and improving labour market fluidity – making it easier for workers to transition between jobs – Canada should also focus on increasing GDP per capita by encouraging greater capital investment (Robson, Kronick and Kim 2019; Gu 2024; Robson and Bafale 2023 and 2024) and promoting the adoption of new technologies (e.g., AI, robotics, and automation), with a focus on increasing productivity and complementing the skills of the existing workforce.
Canada’s labour productivity has declined recently – a worrisome trend. Enhancing labour productivity involves addressing skill shortages, overqualification and mismatches. Policies that encourage training and promote automation, as well as higher wages in high-demand sectors, are essential. The potential of AI should also be explored to support labour productivity and mitigate skills and labour shortages (Mahboubi and Zhang 2023). However, it is equally important to provide support for the displacement of low-skilled workers who may be impacted by automation. Governments and employers should focus on training programs that align with the evolving demands of the labour market, including reskilling and upskilling initiatives for those at risk of displacement.
Conclusion
Addressing the challenges of an aging population, a lower senior participation rate, the overqualification of immigrants’ skills, and declining labour productivity requires comprehensive and targeted policy interventions. Canada’s labour market will benefit from proactive measures that support both its existing workforce and newcomers while addressing the demographic pressures ahead.
To ensure sustainable economic growth and greater labour market participation, the following policy actions should be considered:
The federal government should gradually raise the normal retirement age to 67 and assess the benefits of delaying the earliest access age for pension benefits, in line with successful international models.
Provincial governments should adopt targeted policies to support older workers, such as promoting flexible work arrangements, part-time career opportunities, and self-employment options, particularly in regions like the Atlantic provinces, where senior participation is notably low.
All levels of government should invest in high-quality training programs that equip individuals with the skills needed for the evolving labour market, such as digital skills and job search strategies, with a focus on underrepresented groups like seniors, Indigenous Peoples, and youth.
Provinces and regulatory bodies should collaborate to streamline the licensing process for skilled immigrants, enabling foreign-trained professionals to meet local regulatory requirements more efficiently. They should also work together to ease labour mobility in regulated occupations, ensuring that qualifications are recognized across regions without compromising service quality.
The federal government should invest in enhancing settlement strategies for immigrants, including providing language training tailored to workplace culture. It is also important to evaluate the effectiveness of existing programs to ensure they adequately support newcomers’ integration into the workforce.
Employers, in collaboration with governments, should integrate automation and advanced technologies such as AI to boost productivity while ensuring that workers’ skills align with the evolving demands of the economy.
By implementing these policies, Canada can better navigate labour market imbalances, enhance its labour force participation, and position itself for sustainable economic growth in the face of demographic and technological change.
The authors extend gratitude to Pierre Fortin, Mikal Skuterud, Steven Tobin, William B.P. Robson, Rosalie Wyonch, and several anonymous referees for valuable comments and suggestions. The authors retain responsibility for any errors and the views expressed.
References
Acemoglu, Daron, and Pischke, Jörn-Steffen. 1999. “The structure of wages and investment in general training.” Journal of Political Economy 107(3): 539-572.
Banks, James, et al. 2010. “Releasing Jobs for the Young? Early Retirement and Youth Unemployment in the United Kingdom.” In Social Security Programs and Retirement around the World: The Relationship to Youth Employment. University of Chicago Press, pp. 319-344.
Busby, Colin, and Ramya Muthukumaran. 2016. Precarious Positions: Policy Options to Mitigate Risks in Non-standard Employment. Commentary. Toronto: C.D. Howe Institute. December.
Casey, Bernard. 1998. “Incentives and Disincentives to Early and Late Retirement.” Working Paper AWP3.3. Paris: OECD.
Coile, Courtney, David Wise, Axel Börsch-Supan, Jonathan Gruber, Kevin Milligan, Richard Woodbury, Michael Baker, James Banks, Luc Behaghel, Melika Ben Salem, Paul Bingley, Didier Blanchet, Richard Blundell, Michele Boldrín, Antoine Bozio, Agar Brugiavini, Tabea Bucher-Koenen, Raluca Elena Buia, Eve Caroli, Naohiro Yashiro. 2025. “Social Security and Retirement around the World: Lessons from a Long-term Collaboration.” Journal of Pension Economics and Finance 24: 8-30.
Coile, Courtney, Kevin S. Milligan, and David A. Wise. 2018. “Social Security Programs and Retirement Around the World: Working Longer – Introduction and Summary.” National Bureau of Economic Research. Working Paper 24584. May.
Fortin, Pierre, 2024. “Does immigration help alleviate economy-wide labour shortages?” CLEF Working Paper Series 70, Canadian Labour Economics Forum (CLEF), University of Waterloo.
Fortin, Pierre, 2025. The Immigration Paradox: How an Influx of Newcomers Has Led to Labour Shortages. Commentary 677. Toronto: C.D. Howe Institute. February.
Gagnon, Morgan, Sithandazile Kuzviwanza. 2023. “Mapping Employment Supports for Québec’s Racialized and Immigrant English-speaking Communities.” Provincial Employment Roundtable (PERT). July.
Grenier, Gilles, and Serge Nadeau. 2011. “Immigrant access to work in Montreal and Toronto.” Canadian Journal of Regional Science 34(1): 19-32.
Gu, Wulong. 2024. “Investment Slowdown in Canada After the Mid-2000s: The Role of Competition and Intangibles.” Statistics Canada. DOI: https://doi.org/10.25318/11f0019m2024001-eng
Guillemette, Yvan. 2006. “Misplaced Talent: The Rising Dispersion of Unemployment Rates in Canada.” E-Brief 33. Toronto: C.D. Howe Institute.
Haun, Chris. 2023. “A Detailed Analysis of Canada’s Post-2000 Productivity Performance and Pandemic-Era Productivity Slowdown.” Center for the Study of Living Standards. Available at https://www.csls.ca/reports/csls2023-11.pdf
Herbertsson, Tryggvi Thor, and Mike Orszag. 2003. “The Early Retirement Burden: Assessing the Costs of the Continued Prevalence of Early Retirement in OECD Countries.” IZA Discussion Paper, No. 816, July.
Holland, Brian. 2018. “Defining and Measuring Workforce Development in a Post-Bipartisan Era.” GLO Discussion Paper Series # 234, Global Labour Organization (GLO).
___________. 2019. “The Design and Uses of an Employability Index to Evaluate the Vertical Workforce Development Process.” New Horizons in Adult Education and Human Resource Development 31(2): 41-59.
Jousten, Alain, Mathieu Lefèbvre, Sergio Perelman,and Pierre Pestieau. 2010. “The Effects of Early Retirement on Youth Unemployment: The Case of Belgium.” In Social Security Programs and Retirement Around the World: The Relationship to Youth Employment. University of Chicago Press, pp. 47-76.
Kalwij, Adriaan, Arie Kapteyn and Klass de Vos. 2010. “Retirement of Older Workers and Employment of the Young.” De Economist 158 (4): 341-359.
Lacroix, Guy, and Pierre-Carl Michaud. 2024. “Tax Incentives and Older Workers: Evidence from Canada.” HEC Montreal. Working Paper. September.
Lefebvre, Pierre, and Philip Merrigan. 2008. “Child-Care Policy and the Labour Supply of Mothers with Young Children: A Natural Experiment from Canada.” Journal of Labour Economics 26 (3): 519-48.
Mahboubi, Parisa. 2017a. The Power of Words: Improving Immigrants’ Literacy Skills. Commentary 486. Toronto: C.D. Howe Institute. May.
___________. 2017b. “Talkin’ ‘Bout My Generation: More Educated, But Less Skilled Canadians.” E-Brief. Toronto: C.D. Howe Institute.
___________. 2024. Quality Over Quantity: How Canada’s Immigration System Can Catch Up With Its Competitors. Commentary 654. Toronto: C.D. Howe Institute. February.
Mahboubi, Parisa, and Amira Higazy. 2022. Lives Put on Hold: The Impact of the COVID-19 Pandemic on Canada’s Youth. Commentary 624. Toronto: C.D. Howe Institute. July
Mahboubi, Parisa, and Momanyi Mokaya. 2021. The Skills Imperative: Workforce Development Strategies Post-COVID. Commentary 609. Toronto: C.D. Howe Institute.
Mahboubi, Parisa, and Tingting Zhang. 2023. Empty Seats: Why Labour Shortages Plague Small and Medium-Sized Businesses and What to Do About It. Commentary 648. Toronto: C.D. Howe Institute. November.
___________. 2024. Harnessing Immigrant Talent: Reducing Overqualification and Strengthening the Immigration System. Commentary 672. Toronto: C.D. Howe Institute.
______. 2022. What has been the impact of the COVID-19 pandemic on immigrants? An update on recent evidence. OECD Publishing. Paris. https://doi.org/10.1787/65cfc31c-en
Picot, Garnett, and Tahsin Mehdi. 2024. “The Provision of Higher- and Lower-skilled Immigrant Labour to the Canadian Economy.” Statistics Canada. DOI: https://doi.org/10.25318/36280001202400900005-eng
Robson, William B.P. 2019. Thin Capitalization: Weak Business Investment Undermines Canadian Workers. Commentary 550. Toronto: C.D. Howe Institute. August.
Robson, William B.P., and Mawakina Bafale. 2024. Underequipped: How Weak Capital Investment Hurts Canadian Prosperity and What to Do about It. Commentary 666. Toronto: C.D. Howe Institute. September.
Robson, William B.P, and Mawakina Bafale. 2023. Working Harder for Less: More People but Less Capital Is No Recipe for Prosperity. Commentary 647. Toronto: C.D. Howe Institute. June.
Robson, William B.P., and Parisa Mahboubi. 2018. “Inflated Expectations: More Immigrants Can’t Solve Canada’s Aging Problem on Their Own.” E-Brief. Toronto: C.D. Howe Institute. November.
Robson, William B.P., Jeremy Kronick and Jacob Kim. 2018. Tooling Up: Canada Needs More Robust Capital Investment. Commentary 520. Toronto: C.D. Howe Institute. September.
Schimmele, Christoph, and Feng Hou. 2024. “Trends in Education–Occupation Mismatch among Recent Immigrants with a Bachelor’s Degree or Higher, 2001 to 2021.” Statistics Canada. May 22. DOI: https://doi.org/10.25318/36280001202400500002-eng
Skuterud, Mikal. 2023. “Canada’s Missing Workers: Temporary Residents Working in Canada.” E-Brief 345. Toronto: C.D. Howe Institute. September.
Skuterud, Mikal. 2025. “The Growing Data Gap on Canada’s Temporary Resident Workforce.” E-Brief 367. Toronto: C.D. Howe Institute. February.
The gambling industry in Canada has changed a lot over the years. While land-based casinos remain popular, online platforms have opened up new opportunities for players who prefer the convenience of playing from home. With better internet access, secure payment methods, and a wider variety of games, more Canadians are choosing online casinos over traditional ones.
Online casinos allow players to enjoy everything from classic slot machines to live dealer games, making them a preferred choice for those looking for excitement without visiting a physical casino. Many platforms are now licensed and regulated to ensure safe and fair play. Whether you are a beginner or an experienced player, the options available today cater to everyone.
One of the biggest attractions of online casinos is the variety of games they offer. Websites casinosincanada provide detailed reviews and recommendations on the best platforms available, making it easier for players to choose a trustworthy casino.
Understanding Online Casino Regulations in Canada
The legal status of online gambling in Canada is unique. While gambling is allowed, it is regulated at the provincial level. This means that each province has its own rules regarding online casinos. For example, Ontario has introduced a fully regulated market through iGaming Ontario, allowing licensed operators to provide legal online gambling services.
Other provinces, such as British Columbia and Quebec, operate their own online casino platforms. However, many Canadians still play on international sites that accept players from Canada. These offshore casinos operate under licenses from jurisdictions such as Malta, Gibraltar, and Curacao.
Since each province sets its own rules, it’s important for players to check whether an online casino is legally allowed to operate in their area. Choosing a licensed casino ensures a safer experience, as these platforms follow strict guidelines to protect players.
The Most Popular Online Casinos in Canada
With so many online casinos available, choosing the right one can be difficult. Here are some of the top-rated casinos that Canadian players trust:
1. JackpotCity Casino
Established in 1998, JackpotCity is known for its wide selection of games.
Offers over 700 games, including slots, table games, and live dealer games.
New players can claim up to $1,800 in welcome bonuses.
Holds a license from the Malta Gaming Authority, ensuring a secure experience.
2. Spin Casino
Provides a user-friendly platform with high-quality games.
Features over 700 slot machines and table games.
New users can receive a $1,000 match bonus plus free spins.
Licensed by the Malta Gaming Authority.
3. LeoVegas Casino
Specializes in mobile gaming, offering over 2,500 games.
Known for fast withdrawals, often processed within 24 hours.
Provides a welcome bonus of up to $1,000 plus 100 free spins.
Holds licenses from iGaming Ontario and the Malta Gaming Authority.
4. PartyCasino
Features a mix of classic and modern casino games.
Offers frequent promotions and a loyalty rewards program.
Licensed by the UK Gambling Commission and the Gibraltar Regulatory Authority.
5. Bet365 Casino
A well-known international platform with a strong reputation.
Provides over 2,000 games, including slots, blackjack, and roulette.
New players receive 100 free spins with no wagering requirements.
Regulated by the UK Gambling Commission and iGaming Ontario.
How to Choose the Right Online Casino
If you are new to online gambling, selecting a reliable casino is crucial. Here are a few things to look for:
1. Licensing and Security
Always choose a casino that is licensed by a trusted authority. This ensures fair gaming and secure transactions. Look for SSL encryption, which protects personal and financial data.
2. Game Selection
A good casino should offer a wide variety of games, including slots, table games, and live dealer options. Make sure the platform provides games from reputable software providers.
3. Bonuses and Promotions
Many casinos attract new players with welcome bonuses, free spins, and loyalty programs. Read the terms and conditions carefully to understand wagering requirements before claiming any offers.
4. Payment Methods
Choose a casino that supports convenient and secure payment options. Common methods include credit cards, e-wallets, and bank transfers. Fast withdrawal processing is a key factor to consider.
5. Customer Support
Reliable customer support is essential for a smooth gaming experience. Look for casinos that offer 24/7 assistance through live chat, email, or phone.
The Future of Online Gambling in Canada
The online gambling industry in Canada is evolving rapidly. Ontario’s success in regulating its online market may encourage other provinces to introduce similar frameworks. This could lead to safer and more transparent gaming environments across the country.
Technology is also changing the way people play. Virtual reality (VR) and augmented reality (AR) are expected to enhance the gaming experience, making online casinos more interactive. Additionally, cryptocurrency payments may become more common, providing faster and more secure transactions.
Final Thoughts
Online casinos offer a great way to enjoy casino games without visiting a physical location. With the right precautions, players can have a fun and safe experience. Checking for proper licensing, choosing reputable platforms, and setting limits on gameplay are important steps in responsible gambling.
As the industry grows, more Canadian players will have access to better platforms, improved security, and a wider range of gaming options. Whether you are playing for fun or real money, always gamble responsibly and choose casinos that prioritize player protection. For the Silo, Vinayak Gupta.
Newcomers increase consumption and spending, and are actually contributing to demand for labour in other sectors.
Study in Brief
This study investigates the effects of Canada’s expansive immigration policy, implemented between 2016 and 2024, on labour shortages. It explores how the influx of permanent and temporary immigrants has affected the balance between labour supply and demand, with attention to whether the policy has met one of its key objectives – alleviating shortages in labour markets.
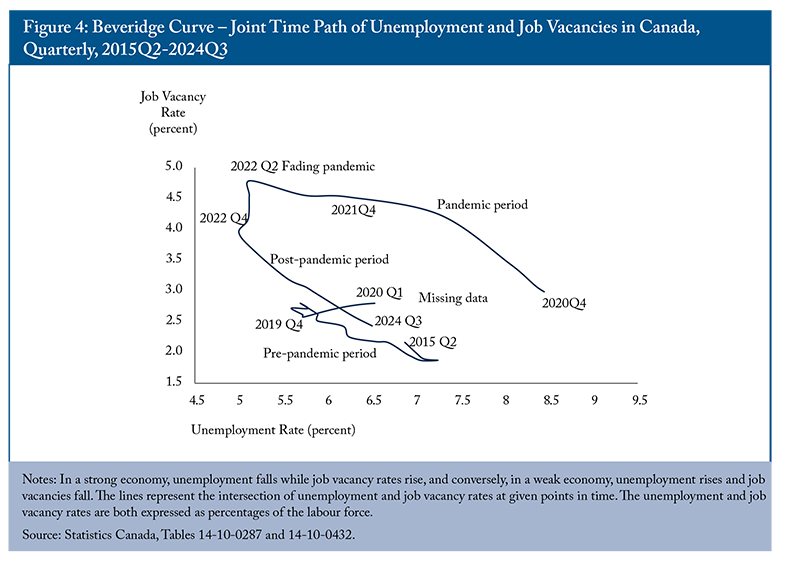
It provides an analysis of labour market dynamics through the lens of the Beveridge curve, which tracks the joint path of unemployment and job vacancies over time. The study compares labour market tightness before, during, and after the pandemic and evaluates how rapidly rising immigration and the adoption of remote work have affected job vacancy rates in Canada.
The arrival of immigrant workers has expanded the supply of labour to employers, but has also generated additional income and spending, and hence greater demand for labour throughout the economy. The macroeconomic evidence from this study indicates that, on balance, the increase in demand generated by immigration has more than likely outpaced the additional supply, potentially making economy-wide labour shortages more widespread rather than alleviating them.
Introduction
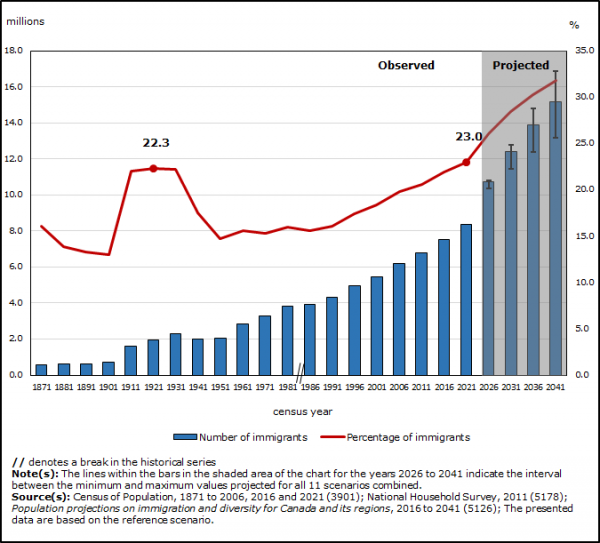
Canada’s immigration levels began to accelerate in 2016, following a period of relative stability. From 2001 to 2015, the annual inflow of immigrants, including both permanent and temporary admissions, was reasonably stable at around 0.85 percent of the overall population. In the following years, despite a temporary contraction during the pandemic, this rate rose fourfold, reaching up to 3.2 percent of the population in 2023.
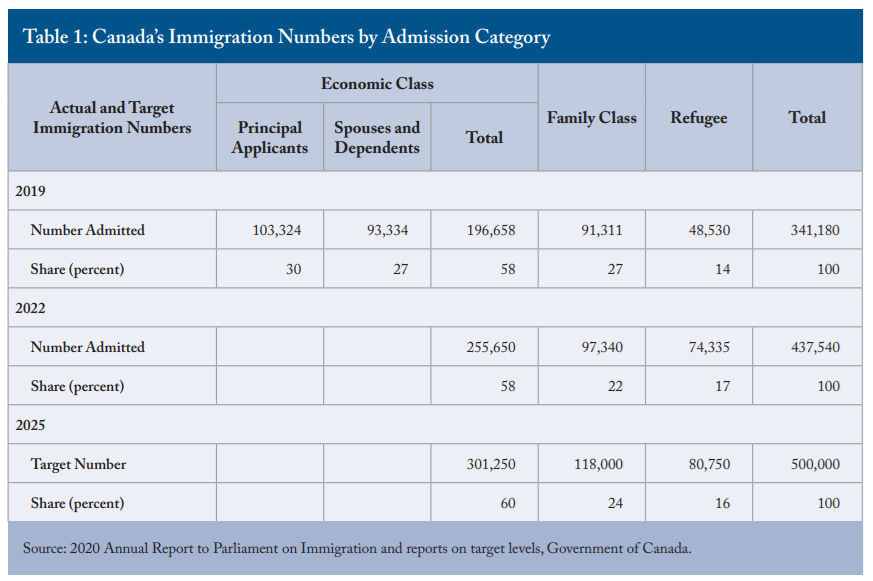
This post-2015 expansion was consistent with recommendations from the Advisory Council on Economic Growth, established by Minister of Finance Bill Morneau in 2016. The Council’s 2016 report suggested that the annual number of permanent economic immigrants should be increased from 300,000 in 2016 to 450,000 in 2021, and to nearly double this number later. Its stated objectives were to increase population growth, reduce the old age dependency ratio, generate a bigger GDP, and accelerate the rise in real GDP per capita by easing shortages of high-skilled workers and other means. Policymakers, encouraged by the perceived success of Canada’s immigration program, embraced the idea that higher immigration levels could deliver even greater economic and demographic benefits.1 The Council also urged the government to facilitate admissions of temporary workers and attract more international students. The government responded by increasing permanent immigration levels from 270,000 in 2015 to 480,000 in 2024, allowing uncapped increases in temporary immigration, and trying to address shortages of low- as well as high-skilled labour.
The C.D. Howe Institute’s research has shown that the benefits of immigration in mitigating population aging, and supporting the growth of GDP per capita, have been more limited than expected (Mahboubi and Robson 2018; Doyle, Skuterud and Worswick 2024). The present study is an attempt to assess whether the policy has succeeded in meeting the goal of easing the challenges employers face in finding suitable candidates for their job openings. The answer to this question has clearly been a big “yes” at the level of the individual employer. Many employers are benefiting from the contribution of their new immigrant workers, which is the basis for the unrelenting support for more immigration by representative national business organizations.
It is less clear whether immigration has helped alleviate labour shortages in the overall economy. Immigration not only expands the supply of labour, but also adds to the demand for labour. Putting more immigrants to work generates an expansionary multiplier effect on gross domestic product (GDP) and national income. As the additional income is spent on various consumption and investment goods by households, businesses and governments, the demand for labour increases. The net effect of immigration on the difference between supply and demand in the aggregate economy is, therefore, a priori uncertain. It could be negative or positive.
My goal in this study is to uncover what simple economic logic, and the statistical evidence from Canadian macrodata, reveal about the direction and quantitative importance of the net effect of rising immigration on the economy-wide balance between the demand for, and the supply of, labour. I find that the demand has likely matched or exceeded the supply and has therefore increased the overall job vacancy rate at any given level of unemployment.
Labour Shortages and Job Vacancies
What do “labour shortages” mean, and how have they evolved since Canada’s immigration rate began to increase eight years ago? Employers feel they are short of labour when the number of unfilled job openings significantly exceeds the number of available employees with the necessary skills and qualifications to meet their operational needs. Each month, Statistics Canada reports the extent of labour shortages in various sectors and regions from its Job Vacancy and Wage Survey. It is called the “job vacancy rate” and is an estimate of the number of job vacancies as a percentage of total labour demand, including all occupied and vacant salaried jobs.
Data on the job vacancy rate have been available since 2015 (Figure 1). After the oil-induced economic slowdown of 2014-2015, job vacancies increased from 2.3 percent of labour demand in mid-2016 to 3.3 percent in early 2020. No vacancy data were available from April to September 2020 due to a six-month pandemic-related pause in Statistics Canada’s survey. Moving through the spring 2020 recession, but with the unemployment rate still very high, job vacancies then increased swiftly, reaching a peak of 5.7 percent of all occupied and vacant jobs in the second quarter of 2022. But with the economic slowdown and slackened labour markets subsequently accompanying high interest rates, vacancies fell back to 3.0 percent of labour demand in the third quarter of 2024.
Immigration and Labour Supply and Demand
Since 2015, Canada’s job vacancy rate has fluctuated in response to three key macroeconomic factors: rising immigration, the pandemic, and fluctuations in aggregate economic activity.
Immigration has risen steadily in recent years, with both permanent and temporary entries increasing in each non-pandemic year (Figure 2). Permanent admissions rose from 272,000 in 2015 to 472,000 in 2023. This upward trend was guided by the multi-year immigration-level targets set each year since 2017 by the government in its Annual Report to Parliament on Immigration. For example, the target for permanent admissions in 2023 was set at 465,000 in the 2022 Report.
Temporary immigration includes holders of study or temporary work permits, asylum seekers, and their family members. They are collectively referred to as “non-permanent residents” by Statistics Canada. Prior to 2024, temporary immigration was excluded from the government’s annual targets. It was uncapped and followed demand from businesses and educational establishments. The net annual addition to temporary permits (new entries less exits to permanent residence and to abroad) rose from basically zero in 2015 to 190,000 in 2019, and 821,000 in 2023 (Figure 2).
Overall, total immigration – the sum of permanent and temporary immigration – increased fivefold from 263,000 in 2015, to 1,293,000 in 2023. Was this fivefold surge in immigration over eight years able to lower the job vacancy rate and reduce labour shortages in the aggregate Canadian economy? How could it not? Prima facie, the arrival of new immigrant workers increases the supply of labour, allowing recipient employers to ameliorate their personnel gap, at least in part. The addition of immigrant labour might suggest the “common sense” inference that labour scarcity has been effectively eased up throughout the economy.
However, it is erroneous to assume that simply because immigration solves the personnel shortage of individual employers, it will necessarily solve the problem of labour scarcity in the aggregate economy.
The error comes from focusing narrowly on increasing the supply of labour, while neglecting the simultaneous increase in the demand for labour that is generated by immigration. With more immigrants in the workforce, employers can produce more goods and services and generate more income for themselves, their employees, and their suppliers – a good thing. However, to assess the overall effect of immigration on labour scarcity, it is crucial to consider that this additional income will be spent on various consumer and investment goods. Immigrants allocate their new income, along with any savings brought from abroad, to essentials such as food, clothing, housing, transportation, personal care, and leisure. In turn, employers and their chains of suppliers invest more in construction, machinery and intellectual property. Furthermore, immigrants, employers and suppliers all contribute to taxes, which governments allocate to meet the increased demand for social services, including public housing, education, and healthcare. The growing demand for private and public goods and services will expand aggregate labour demand.
In other words, the hiring of immigrants initially adds to the supply of labour, but it also ends up adding to the demand for labour once the new income generated is spent throughout the economy and a multiplier effect is generated on GDP. On net, it is a priori uncertain whether the supply increases more than the demand, in which case labour would be made less scarce overall, or whether it is the demand that increases more than the supply, in which case labour would be made scarcer.
As a first attempt to clarify the picture, let us see how the excess of labour supply over labour demand evolved from 2016 to 2024 (Figure 3). I take labour supply to be the entire labour force (all workers who are employed or are looking for work), and labour demand to be the sum of employment and job vacancies (all jobs that are occupied or ready to be filled). Expressed as a percentage of the labour force, the difference between the two – excess supply – boils down to the difference between unemployment and job vacancies. Excess supply goes up or down depending on whether unemployment increases more or less than job vacancies.
Figure 3 shows that the excess supply of labour has fluctuated widely since 2016. In the pre-pandemic period 2016-2019, it declined from 5.4 percent to 2.9 percent of the labour force. Labour became scarcer. During the pandemic year 2020, it shot up to 6.1 percent of the labour force. But in the aftermath, labour demand outpaced supply again so that by mid-2022 excess supply had dropped to a low of 0.3 percent of the labour force. Since then, it has risen back to 4.1 percent.
The time path of the excess supply of labour cannot alone determine whether the rise in immigration since 2016 has increased labour supply more or less than labour demand. Excess supply results from the interplay of three simultaneous determinants: rising permanent immigration and accelerating temporary immigration, the disruptions caused by the pandemic and its potential after-effects, and fluctuations in aggregate activity. For example, the declining excess supply in the pre-pandemic period 2016-2019 was the combined outcome of rising immigration and aggregate economic expansion. But the impact of rising immigration cannot be separated out from that of aggregate economic expansion by just looking at the trend in excess supply. Correctly identifying the net effect of each of the two factors requires a more comprehensive economic and statistical analysis of the data.
The Shifting Beveridge Curve
To identify the net effect of immigration on labour shortages, I will use a well-established tool called the Beveridge curve. The Beveridge curve offers valuable insights by highlighting the observed inverse relation between vacancies and unemployment.
William Beveridge (Beveridge 1960) used the unemployment rate as a main marker of fluctuations in aggregate activity, a practice business cycle analysts still follow to this day (Romer and Romer 2019; Hazell et al. 2022). He observed that vacancies and unemployment typically move in opposite directions through business cycles. He attributed the negative relationship to the pressure exerted by aggregate activity on economic potential. When aggregate economic activity was moving up to its full potential (as in Canada in 2016-2019), there were fewer unemployed workers and more job vacancies. Conversely, when activity was moving away from potential (as in Canada in 2023-2024), there were more unemployed workers and fewer job vacancies. Since 1960, this inverse relation between the job vacancy rate and the unemployment rate – now called the Beveridge curve – has played a key role in macroeconomic analysis of labour markets. It has been abundantly studied by researchers and has been identified in job vacancy and unemployment data in many countries (e.g., Blanchard and Diamond 1989; Pissarides 2000; Archambault and Fortin 2001; Elsby, Michaels and Ratner 2018; Michaillat and Saez 2021).
It is instructive to examine the trajectory of the Canadian unemployment – job vacancy relation in two-dimensional space from 2015 to 2024 (Figure 4). First, following the 2015 economic slowdown, the economic expansion of 2016-2019 brought a decrease in the unemployment rate and an increase in the job vacancy rate along a path that was consistent with a negatively sloped Beveridge curve. The sudden outbreak of the pandemic in early 2020 shattered this trajectory. The unemployment – job vacancy pair was sent far outward toward the northeast corner of the chart. From then until the end of 2021, it followed a new Beveridge curve to the northwest. During the recovery following the pandemic recession in the spring quarter of 2020, the unemployment rate decreased and the job vacancy rate increased along a path that was about parallel to that of 2015-2019, but at a much higher level. For instance, whereas the unemployment rate was the same in the summer quarter of 2021 as in the winter quarter of 2016 (7.25 percent), the job vacancy rate was twice as large in the former (4.2 percent) as it was in the latter (1.9 percent). Finally, as the pandemic faded, the unemployment – job vacancy pair did a loop to the west. A new post-pandemic Beveridge curve emerged along a southeasterly trend that looked parallel to, but somewhat higher than, the old pre-pandemic path of 2015-2019.2
This visual check reveals that there have been three distinct periods in the inverse relationship between job vacancies and unemployment, known as the Beveridge curve: pre-pandemic, pandemic and post-pandemic. The start and end of the pandemic significantly affected the vertical position of the Beveridge curve in the unemployment – job vacancy space. Although the three branches are not perfectly aligned, they appear to be nearly parallel. According to the statistical results in Table 1 below, a one percent change in the unemployment rate corresponds to about a 1.5 percent change in the opposite direction in the vacancy rate – this is sometimes referred to as the Beveridge curve “elasticity.”
The shifts in the Canadian Beveridge curve during the pandemic are not an entirely unexpected development. Shifts have occurred from time to time in the past.3 As Figure 4 has shown, the Canadian Beveridge curve looked relatively stable before the pandemic in 2016-2019. Figure 5 is an idealized illustration of the position it occupied in the unemployment – job vacancy space in this period. However, starting in 2020, it shifted significantly. It first moved outward during the pandemic in 2020-2021 and then returned inward after the pandemic in 2022-2024.
As an initial assessment of the magnitude of these movements, I use the actual values of unemployment and job vacancies to calculate the implied monthly shifts in the Figure 5 Beveridge curve from January 2016 to October 2024. I then illustrate the implied vertical movements of the job vacancy rate corresponding to a given reference unemployment rate of 5.5 percent4 by averaging the results for each year from 2016 to 2024. The vertical height of the Beveridge curve calculated in this way increased from 2.8 percent in 2019 to nearly 6 percent in 2020-2021, and dropped back to 3.2 percent in 2024 (Figure 6).
The Beveridge curve’s elevation at around 3.2 or 3.3 percent in the post-pandemic period 2023-2024 is higher than its height of 2.8 or 2.9 percent in the pre-pandemic period 2018-2019. This can be attributed to shifts in the ratio of two background factors: the intensity of labour reallocation across occupations, industries and regions, and the efficiency of the matching process between job openings and job seekers (Blanchard, Domash and Summers 2022). At any given rate of unemployment, the job vacancy rate and the Beveridge curve will be higher in relation to the intensity of labour reallocation and the inefficiency of job matching.
The first factor, the intensity of labour reallocation, is captured by the monthly flow of hires as a percentage of the labour force. It is shown as an index with 2019 = 100 in Figure 7. It increased by some 10 percent during the pandemic of 2020-2021. Labour moved from transport industries and those requiring person-to-person contact toward electronic communications and home deliveries. There was a displacement from traditional businesses and occupations to those allowing work from home. However, in 2022-2024 labour reallocation calmed down and its intensity decreased by some 15 percent below its 2019 level. This pushed the Beveridge curve downward.
The second factor, the efficiency of job matching, reflects the capacity of labour markets to generate hires at the observed levels of unemployment and job vacancies. It is an index with 2019 = 100 in Figure 8. It experienced a sharp drop of nearly 20 percent during the pandemic (2020-2021). Factors contributing to this decline include the increasing physical distance between vacant positions and available candidates, as well as the widening gap between the demand for and supply of skills. Also, the rise in illnesses and the increased popularity of remote work during the pandemic likely may have contributed to a decline in job search intensity. As a result, employers found it more difficult to match job offers with suitable job seekers. Matching efficiency did not recover from 2022-2024. It remained some 20 percent below its pre-pandemic level of 2018-2019. This pushed the Beveridge curve upward.
Going from 2019 to 2024, movements in labour reallocation and matching efficiency had opposite effects on the height of the Beveridge curve. But the upward pressure on the curve from the 20 percent drop in matching efficiency was greater than the downward pressure from the 15 percent decline in labour reallocation. Therefore, as already pictured in Figures 4 and 6, the net outcome is that, going over the pandemic, the Beveridge curve wound up at a higher level in 2024 than in 2019, implying a higher job vacancy rate for any given unemployment rate.
So far, I have used the Beveridge relation between job vacancies and unemployment as a broad interpretive framework for macroeconomic developments in Canada over the 2015-2024 period. First, I have focused on the effect of fluctuations in aggregate economic activity (captured by changes in unemployment) on the job vacancy rate. Second, I have noted that the onset and ending of the pandemic have been big shifters of this unemployment – job vacancy trade off upward in 2020-2021 and downward in 2022-2024. Nevertheless, third, I have shown that, mainly due to a persistent 20 percent drop in job matching efficiency since 2019, the Canadian Beveridge curve was occupying a higher vertical position in 2023-2024 than before the pandemic.
In addition to the pandemic, Canada’s immigration policy, characterized by rising immigration levels, is another major development that has impacted labour markets in recent years. Like the pandemic, this policy may have affected the level of the unemployment rate along the Beveridge curve, as well as the vertical position of the curve, through its impacts on labour reallocation and matching efficiency. The following sections try to assess the existence and magnitude of these potential effects of immigration.
Economic Logic
The Beveridge framework can be used to explain how the expansion of immigration in Canada before and after the pandemic could have produced a lasting decrease or increase in labour shortages. Excluding the pandemic’s influence, rising immigration may affect aggregate labour shortages in two mechanical ways: by causing labour markets to slide up or down along the Beveridge curve, or by shifting the entire position of the Beveridge curve upward or downward, resulting in a larger or a smaller number of job vacancies for any given unemployment rate.
The first scenario involves a slide along the Beveridge curve. If rising immigration moves the economy up and to the northwest, unemployment decreases and vacancies increase; if the economy descends to the southeast, unemployment increases and vacancies decrease, as shown in Figure 5.
A permanent increase in unemployment along a given Beveridge curve is not what is generally hoped for by policymakers and the public. We want to achieve a permanent reduction in labour scarcity without being forced to suffer a permanent increase in unemployment. Nevertheless, it is important to understand how rising immigration could impact unemployment permanently, such that a higher or lower unemployment rate would be structurally needed to keep inflation low and stable over time.
A rough check on whether a higher immigration rate has raised or lowered the national unemployment rate consists of seeing if the excess of the national rate over the rate of the experienced group, formed by the Canadian-born plus the immigrants landed more than five years earlier, was higher or lower in 2023 than in 2015. Labour force data indicate that the excess of the national rate over the rate of this experienced group did increase in this period, but by just 0.1 percentage point, owing essentially to the rising labour force share of immigrants landed less than five years earlier. Seen in this light, rising immigration does not seem to have had a meaningful direct effect on structural unemployment. This result is consistent with research by Dion and Dodge (2023), who found no significant change in the national unemployment rate needed to keep inflation stable, known as the noninflationary rate of unemployment, that could be attributed to rising immigration.
It is a relief to see that rising immigration has not entailed a permanent reduction in the job vacancy rate by permanently pushing the national unemployment rate upward. There is evidence, though, that rising immigration has led to greater cyclical volatility of unemployment. First, the phenomenal expansion in the number of new residents since 2021 is known to have contributed to the strong demographic pressure on the demand for housing and, hence, to the significant increase in the cost of rented and owned accommodation. The Bank of Canada has acknowledged that the persistence of high shelter inflation consequently acts “as a material headwind against the return of inflation to the 2 percent target” (Bank of Canada 2024). In other words, through this channel, rising immigration is prolonging the current period of slower growth and higher unemployment. Second, the difference in cyclical sensitivity of the unemployment rate, between the above-defined experienced group and immigrants landed less than five years earlier, seems to have increased. In the economic slowdown during the spring quarter of 2024, the unemployment rate was 4.0 points higher than a year before for immigrants landed less than five years earlier, but only 0.7 point higher for the experienced group. The difference of 3.3 points between them was larger than in the 2009 and 2020 recessions. It could be due in part to the rising share of the low-skilled population of immigrant workers, which is more exposed to layoffs.
This study is primarily concerned with the permanent structural effects of rising immigration on unemployment, which look small, and not with the short-term economic and social costs associated with the greater cyclical volatility of unemployment around its steady state. Nevertheless, the possibility that these short-term costs are real should be kept in mind. Easing labour scarcity by tolerating more unemployment, whether of the short- or long-term variety, is an outcome our policies should try to avoid.
The other way rising immigration may have impacted aggregate labour shortages is by moving the vertical position of the entire Beveridge curve up or down in the unemployment-job vacancy space. Ultimately, we want to know whether rising immigration has increased the job vacancy rate and worsened labour shortages, or whether it has decreased the vacancy rate and alleviated the shortages, at every given level of unemployment.
The combined visual evidence presented by Figures 4 to 8 above implies that the Beveridge curve did shift upward somewhat from the pre-pandemic to the post-pandemic period, particularly due to a persistent 20 percent drop in job matching efficiency. Has rising immigration in Canada contributed to this evolution? Bowlus, Miyairi and Robinson (2016) conducted a longitudinal study of the job search behaviour of immigrants to Canada in 2002-2007. Results imply that heightened immigration may reduce matching efficiency in the short run, as new immigrants often face a lower rate of job offers than natives during their initial integration period. Based on US data, Barnichon and Figura (2015) focused on the two primary determinants of aggregate matching efficiency: worker heterogeneity and labour market segmentation. They pointed out that matching efficiency would decline if workers with a lower-than-average search efficiency became more represented among job seekers, or if the dispersion between tight labour submarkets and slack ones increased. These two conditions would seem to apply to the Canadian context with rising immigration. Lu and Hou (2023) have identified a major shift of immigration toward lower-skilled workers, and a significant relative tightening of labour markets such as construction, accommodation, food, business support services, education, healthcare, and social services. The statistical analysis below will provide a test of whether in recent years rising immigration has in fact shifted the Beveridge curve upward and intensified labour scarcity, or not.
Rising immigration is not the only macroeconomic development that may conceivably have affected aggregate labour shortages in the post-pandemic period. It is entirely conceivable that some of the changes triggered suddenly by the pandemic shock may have persisted into the post-pandemic era. Potentially, the most important of these is the widespread shift to work from home (Aksoy et al. 2023). The pandemic can be seen as a mass natural experiment that brought millions of workers in Canada, and other countries, to suddenly experience more work from home, to value its benefits, and to stick to it thereafter, often with a surprising upside in productivity.
The percentage of Canadian workers aged 15 to 69 who work most of their hours from home was 7 percent in early 2020. It sprang to 41 percent in the great confinement month of April 2020, and then declined as the pandemic evolved and faded out. But it was still holding up around 20 percent in the first half of 2024, which was three times as large as the 7 percent of early 2020.
The large increase in the percentage of Canadians working primarily from home has introduced an increase in worker heterogeneity compared to the pre-2020 period. With more workers satisfied with their work from home, fewer are incentivized to seek new jobs, particularly of the traditional variety. Following the Barnichon and Figura (2015) result, this could partly explain the reduction in job matching efficiency that has so far kept the Beveridge curve at a higher level than otherwise.
The economic logic developed in this section suggests that rising immigration and increased work from home may have contributed to the 20 percent loss of matching efficiency that has kept the post-pandemic height of the Canadian Beveridge curve at a level higher than before the pandemic. (However, fully confirming this hypothesis is beyond the scope of this study).
Statistical Analysis
This section summarizes an analysis of the factors influencing job vacancies in Canada, focusing on immigration and the rise of work-from-home arrangements. Introducing the rate of work from home as a factor is done to verify whether the shift to work from home that was initiated by the pandemic, but persisted in 2022-2024 (Schirle 2024), affected the position of the Beveridge curve.5
The analysis spans six Canadian regions – Atlantic Canada, Quebec, Ontario, the Prairies (Manitoba and Saskatchewan), Alberta, and British Columbia – across the periods from 2015 to 2019 (pre-pandemic) and 2022 to 2024 (post-pandemic).
Table 1 summarizes the key findings of the statistical results. Consistent with expectations, it shows that the Beveridge relationship between vacancies and unemployment is negative, with a precisely estimated elasticity of -1.42 in the two models. The results also show that immigration has been a significant contributor to the rise in job vacancies in Canada. Specifically, Model 1 estimates that a one percentage point increase in the immigration rate is associated with an 8.12 percent increase in the job vacancy rate after one year. It suggests that rising immigration has pushed the Beveridge curve upward, increasing the job vacancy rate at each unemployment rate over the period. However, when accounting for the rise in work-from-home arrangements in Model 2, the effect of immigration is smaller, at 3.21 percent,6 reflecting the additional impact of remote work.7 The positive effect of work-from-home arrangements is estimated at 0.85 percent.
These results suggest that both factors – immigration and remote work – have played a significant role in pushing the Beveridge curve upward, making it more difficult to match available workers with job openings.
While both factors contribute to the rise in job vacancies, their high correlation complicates the ability to isolate their individual effects. The correlation between immigration and remote work is particularly strong, which makes it challenging to assess their independent impacts.8 As a result, the evidence for immigration’s effect on job vacancies in Model 2 is less powerful than it would be if the data allowed sharper estimation.9 However, the findings from Model 2 indicate that the combined effects of both immigration and remote work have contributed to higher job vacancies, suggesting that increasing immigration alone is unlikely to solve labour shortages in the short term.
To be specific, statistical calculation of Model 2 indicates an 82 percent chance that rising immigration has left the job vacancy rate unchanged or raised it, and only an 18 percent chance that it has lowered it.10 In other words, increased immigration is more than four times as likely to have raised the aggregate demand for labour by as much as, or more than, the supply than to have increased it by less than the supply. In short, it is unlikely that rising immigration in Canada has helped the country solve its economy-wide problem of labour shortages by reducing the job vacancy rate at any given unemployment rate.
A natural question is whether the effect of immigration on job vacancies varies between permanent and temporary immigration. So far, an expanded version of Model 2, which distinguishes between these factors by analyzing the permanent and temporary immigration rates separately, has found no significant difference in their four-quarter total effects.11 Future analyses could benefit from disaggregating data by industry, as the impact of immigration and working from home may vary across sectors. For instance, remote work affects sectors like technology differently than it does retail or construction.
Discussion and Conclusion
This paper’s conclusion, drawn from statistical analysis of the macrodata runs, is contrary to the views of business organizations, which have campaigned relentlessly in favour of increases in permanent and temporary economic immigration in the past several years (e.g., Business Council of Canada 2022; Canadian Manufacturers & Exporters 2023; Canadian Federation of Independent Business 2021; Conseil du patronat du Québec 2022). Their position is understandable and grounded in a genuine concern to address labor shortages. By filling the vacancies, economic immigration enables firms to produce more and maintain or increase profitability.
The evidence presented here does not question the important role immigration can play for individual employers, whose need for additional employees is acute and urgent. However, in economics, everything depends on everything. The direction and importance of a phenomenon, confirmed at a microeconomic level with regard to a particular business, government organization, or sector, can be different or even reversed at the macroeconomic level, once all spillovers into the rest of the economy are accounted for. In his 1955 introductory textbook, the renowned American economist Paul Samuelson warned against the risk of the “fallacy of composition,” where it is assumed that what is true for individual parts is automatically true for the whole economy.
In the case of immigration, the fallacy of composition consists of believing that the advantages accruing to employers that hire immigrants can simply be added up and said to extend to the whole economy. What the present study has uncovered is that this belief is not corroborated by the macroeconomic evidence from the recent experience of Canadian regions. It is true that immigration eases up the dearth of personnel in firms that hire newcomers, which is clearly a good thing. But it is also true, conversely, that it worsens the shortage of labour in industries that must cater to the additional demand for goods and services generated by the addition to total GDP. The induced increase in the demand for labour in the aggregate economy can offset or even exceed the initial expansion of supply, so that it contributes to amplify economy-wide labour shortages on net. The insights I have extracted from Canadian regional data suggest that rising immigration has more likely redistributed or increased labour scarcity across the economy than reduced it overall. The political implication is that, if labour shortages persist or increase in the whole of the country despite fast-rising immigration, the insistent demand of business organizations for more immigration will not calm down; labour shortages will persist or intensify.
The vision of immigration as an economy-wide offset to labour scarcity is also reductionist. To take account solely of the hoped-for benefits accruing directly to employers of new immigrants overlooks the fact that immigration is a global and transformative phenomenon. The purpose of immigration is not only to serve the interests of a particular group. It is of concern to a whole society for reasons that are no doubt partly economic, but also demographic, cultural, social, and humanitarian. Society is morally obligated to welcome and integrate all immigrants in the most humane manner. This requires much time and money. Society must also make sure that the pace of immigration is not so fast that it leads ethnic groups to “hunker down” (as Putnam 2007 found) and provokes serious economic disequilibria in sectors that must absorb the induced increase in demand, such as construction, housing, health, education and social services. The overall pace and composition of immigration must balance individual interests against the challenges it brings to society.
Among these costs are the negative potential repercussions on productivity and wage growth stemming from the open-door immigration policy that Canada has followed until recently. Two key implications merit attention. First, investment in housing, business investment to equip newcomers with required physical and human capital, and government investment in public infrastructure to provide social services have not been able to keep pace with fast-rising immigration. Second, the open-door policy has made it easy for employers to rely on low-skilled foreign workers to meet high labour demand, which has been concentrated in low-wage industries (Lu and Hou 2023). While immigration alleviates immediate labour shortages, it may suppress wage increases that would otherwise occur as labour markets tighten and affect capital investments.
For example, in the 12 months leading to 2024Q3, overall wages increased by 4 percent, outpacing inflation at 2 percent, but sectoral differences were stark: wages grew by 3.2 percent in the business sector compared to 6.3 percent in the non-commercial sector. These dynamics suggest that wage growth patterns are influenced by a blend of short-term factors and structural shifts, including immigration trends.
Data also show that business sector labour productivity in Canada is on a slippery slope. From 2021Q3 to 2024Q3, output per hour went down cumulatively by 2.3 percent, whereas it would have gone up by 3.2 percent if it had increased at the same rate as in 1999-2019 (Statistics Canada, table 36-10-0206). While there are many factors behind this slowdown in productivity growth, the high immigration rate may have been a contributor.
In March 2024, the government suddenly announced a reversal of its immigration policy. Immigration Minister Marc Miller committed his department to cutting Canada’s non-permanent resident population from 6.5 percent of the overall population in early 2024 to 5 percent in early 2027. In November, details of the plan were set in the 2024 Annual Report to Parliament on Immigration (Government of Canada 2024, Annex 4). There would be 446,000 fewer entries of new non-permanent residents than exits in each of 2025 and 2026. Annual temporary immigration would be negative to this extent. The Annual Report also announced that the annual target for admissions to permanent immigration would be reduced from 485,000 in 2024 to 395,000 in 2025, 380,000 in 2026 and 365,000 in 2027.
If implemented as intended, scaling back the number of temporary and permanent immigrants will impact Canada’s aggregate labour supply significantly in 2025-2027. The working-age (15-64) population will stagnate instead of increasing by 800,000 or more, as it did in each of 2023 and 2024. An implication of the evidence reported above in Table 1 is that labour demand will likely decline alongside the reduction in labour supply because there will be 800,000 fewer consumers in the Canadian economy. While this policy reversal may not directly address the job vacancy rate, it could reduce vacancies by decreasing the overall demand for labour. As a result, while Canada’s aggregate GDP may contract, GDP per capita could increase, particularly if a smaller portion of national savings is directed toward demographic investments and the composition of immigration shifts toward fewer low-skilled immigrants.
The government’s policy reversal is a first step toward moderation. While it presents challenges, it also offers opportunities for improvement. When employers do not have the luxury of recruiting a rising stream of newcomers who are willing to accept low wages, it may push them to invest more in technology and work reorganization, and hence increase productivity. Furthermore, with a more moderate immigration level, the issue of the lack of absorptive capacity in the economy to provide enough skill-equivalent jobs to high-skilled immigrants will be less acute. Immigrants will see their skill utilization increase and their overqualification rate decrease. This shift could enhance Canada’s ability to attract global talent, aligning with the 2016 recommendation from the Advisory Council on Economic Growth that immigration should help address the shortage of high-skilled workers.
Appendix: Statistical Methodology and Data
This appendix provides a detailed description of the statistical analysis conducted to assess the factors influencing the job vacancy rate in Canada. The analysis spans 27 non-pandemic quarters, covering two periods: 2015Q2 to 2019Q4 (pre-pandemic) and 2022Q4 to 2024Q3 (post-pandemic). It includes data from six Canadian regions – Atlantic Canada, Quebec, Ontario, the Prairies (Manitoba and Saskatchewan), Alberta, and British Columbia. Each of these regions has a population of more than 2 million.
The dataset consists of 162 observations, representing the six regions across the 27 quarters. All labour market and population data are sourced from publicly available Statistics Canada tables. The job vacancy rate and unemployment rate are expressed as ratios of seasonally adjusted job vacancies and unemployment to the labour force. These variables are logarithmically transformed to account for the convexity of the Beveridge curve.
To estimate the relationship between job vacancies and its key determinants, two regression models are specified:
• Model 1 includes the unemployment rate, the immigration rate (measured as the total number of new permanent immigrants and net additional non-permanent residents relative to the population, annualized), and three unconstrained lagged values of the immigration rate.
• Model 2 builds upon Model 1 by including the rate of work from home as an additional explanatory variable. The work-from-home rate is the fraction of workers aged 15 to 69 who work most of their hours from home in their main jobs. This model tests whether the pandemic-induced shift to remote work, which persisted post-pandemic, has affected the Beveridge curve and the job vacancy rate.
Both models incorporate regional and seasonal fixed effects to account for regional disparities and seasonal fluctuations in the labour market.
The author is grateful to Mario Fortin, Gilles Grenier, Jeremy Kronick, Nicolas Marceau, Parisa Mahboubi, Pascal Michaillat, Mario Polèse, Statistics Canada data analysts, Mikal Skuterud, Daniel Schwanen, Christopher Worswick and several anonymous referees for valuable comments and suggestions. The author retains responsibility for any errors and the views expressed.
References
Advisory Council on Economic Growth. 2016. “The Path to Prosperity: Resetting Canada’s Growth Trajectory.” Report of the Advisory Council on Economic Growth to the Minister of Finance of Canada. October.
Ahn, Hie Joo, and Leland Crane. 2020. “Dynamic Beveridge curve accounting.” Finance and Economic Discussion Series 2020-27. Board of Governors of the Federal Reserve System, Washington. March.
Aksoy, Cevat Giray, Jose Maria Barrero, Nicholas Bloom, Steven Davis, Mathias Dolls and Pablo Zarate. 2023. “Working from home around the world.” Brookings Papers on Economic Activity, Fall 2022, 281-330.
Archambault, Richard, and Mario Fortin. 2001. “The Beveridge Curve and Unemployment Fluctuations in Canada.” Canadian Journal of Economics 34(1): 58-81.
Bank of Canada. 2024. Monetary Policy Report. Ottawa, January.
Barlevy, Gadi, Jason Faberman, Bart Hobijn and Ayşegül Şahin. 2024. “The Shifting Reasons for Beveridge Curve Shifts.” Journal of Economic Perspectives 38(2): 83-106.
Barnichon, Régis, and Andrew Figura. 2015. “Labor market Heterogeneity and the Aggregate Matching Function.” American Economic Journal: Macroeconomics 7(4): 222-249.
Beveridge, William. 1960. Full Employment in a Free Society. Second edition. London: Allen & Unwin.
Blanchard, Olivier, and Peter Diamond. 1989. “The Beveridge Curve.” Brookings Papers on Economic Activity (1)1-67.
Blanchard, Olivier, Alex Domash, and Lawrence Summers. 2022. “Bad news for the Fed from the Beveridge space.” Policy Brief. Peterson Institute for International Economics. July.
Bok, Brandyn, Nicolas Petrosky-Nadeau, Robert Valetta, and Mary Yilma. 2022. “Finding a soft landing along the Beveridge curve.” Economic Letter. Federal Reserve Bank of San Francisco. August.
Bowlus, Audra, Masashi Miyairi and Chris Robinson. 2016. “Immigrant job search assimilation in Canada.” Canadian Journal of Economics 49(1): 5-52.
Dion, Richard, and David Dodge. 2023. “Labour force growth and labour market gap in Canada: 2011 to 2032.” Working Paper. Ottawa: Bennett Jones, May.
Doyle, Matthew, Mikal Skuterud and Christopher Worswick. 2024. Optimizing Immigration for Economic Growth. Commentary No. 662. Toronto: C.D. Howe Institute.
Elsby, Michael, Ryan Michaels and David Ratner. 2015. “The Beveridge Curve: A Survey.” Journal of Economic Literature 53(3): 571-630.
Fortin, Pierre.2024. “Does immigration help alleviate economy-wide labour shortages?” Working Paper #70, Canadian Labour Economics Forum, University of Waterloo. May.
Government of Canada. 2024.2024 Annual Report to Parliament on Immigration. Immigration, Refugees and Citizenship Canada. October.
Hazell, Jonathon, Juan Herreño, Emi Nakamura, and Jón Steinsson. 2022. “The Slope of the Phillips Curve: Evidence from US states.” Quarterly Journal of Economics 137(3): 1299-1344.
Lam, Alexander. 2022. “Canada’s Beveridge curve and the outlook for the labour market.” Staff Analytical Note 2022-18, Bank of Canada, Ottawa. November.
Lu, Yuqian, and Feng Hou. 2023. “Foreign workers in Canada: distribution of paid employment by industry.” Economic and Social Reports. Catalogue No. 36-28-0001. Ottawa: Statistics Canada. December.
Mahboubi, Parisa, and William Robson. 2018. “Inflated Expectations: More Immigrants Can’t Solve Canada’s Aging Problem on Their Own.” E-Brief. Toronto: C.D. Howe Institute.
Michaillat, Pascal, and Emmanuel Saez. 2021. “Beveridgean unemployment gap.” Journal of Public Economics Plus 2. December.
Morissette, René, Vincent Hardy and Voltek Zolkiewski. 2023. “Working most hours from home: new estimates for January to April 2022.” Analytical Studies Branch Research Papers Series. Catalogue no. 11F0019M, No. 472. Ottawa: Statistics Canada. July.
Pissarides, Christopher. 2000. Equilibrium Unemployment Theory. Cambridge MA: MIT Press.
Putnam, Robert. 2007. “E Pluribus Unum: Diversity and community in the twenty-first century: The 2006 Johan Skytte Prize Lecture.” Scandinavian Political Studies 30(2): 137-174.
Romer, Christina, and David Romer. 2019. “NBER business cycle dating: Retrospect and prospect.” Paper prepared for the session “NBER and the Evolution of Economic Research, 1920–2020” at the ASSA Annual Meeting, San Diego, California, January 2020. Department of Economics, University of California, Berkeley.
Samuelson, Paul. 1955. Economics: An Introductory Analysis. New York: McGraw-Hill.
Schirle, Tammy. 2024. “Settling into a New Normal? Working from Home across Canada.” E-Brief. Toronto: C.D. Howe Institute.
Shimer, Robert. 2012. “Reassessing the Ins and Outs of Unemployment.” Review of Economic Dynamics 15(2): 127-148.
Our friends at MSN have really stirred the maple syrup pot up with this story- which one of the following companies is the most surprising for you? Leave us a note in the comments section at the bottom of the article.
Many beloved Canadian brands that fill shopping carts and homes across the country have something surprising in common—they’re actually owned by foreign investors and companies. Behind familiar logos and proud Canadian histories stand international corporations that have quietly acquired these businesses, often maintaining their strong local identity while decisions are made overseas.
This eye-opening list reveals 8 well-known Canadian companies that now operate under foreign ownership.
While these businesses still employ thousands of Canadians and remain important parts of communities nationwide, their profits and major corporate choices flow to boardrooms in places like the United States, Europe, and Asia. Each example shows how Canada’s business landscape has evolved in today’s global economy.
A Canadian fast-food icon, Tim Hortons has been owned by Restaurant Brands International since 2014, with its headquarters in Toronto but major control from Brazil-based 3G Capital. The beloved coffee chain started in Hamilton, Ontario in 1964 as a single donut shop. Today, it serves millions of customers daily across Canada and has expanded into 14 countries. The Brazilian investment firm maintains the Canadian feel of the brand while pushing for global growth.
Hudson’s Bay Company, founded in 1670, is now owned by American businessman Richard Baker’s NRDC Equity Partners. The historic retailer shifted from Canadian ownership in 2008 through a $1.1 billion deal. HBC continues to operate The Bay stores across Canada while managing an extensive real estate portfolio. The company maintains its Canadian identity despite being controlled from south of the border.
The Montreal-based entertainment company, famous for its artistic circus shows, was acquired by TPG Capital, a U.S. private equity firm, in 2015. Following financial difficulties during the pandemic, ownership changed again in 2020 to a group including Catalyst Capital Group. The company still creates its shows in Montreal. The creative spirit of Cirque remains distinctly Quebec-based despite foreign investment control.
The luxury winter coat maker, started in Toronto in 1957, sold a majority stake to U.S.-based Bain Capital in 2013. The company continues to manufacture its core products in Canada, maintaining its made-in-Canada promise. The brand has expanded globally under foreign ownership while keeping its Canadian headquarters. The international success of Canada Goose proves that Canadian craftsmanship can thrive under foreign ownership.
The Canadian hardware retailer Rona underwent major ownership changes in recent years. After operating independently for decades, the Quebec-based chain was acquired by U.S. home improvement leader Lowe’s in a $3.2 billion deal completed in 2016. However, Lowe’s ownership proved relatively short-lived. In 2023, the American retailer divested Rona, selling it to Sycamore Partners, a private equity firm headquartered in New York, for $2.4 billion. Despite these corporate transitions, Rona maintained its distinct brand identity in the Canadian home improvement marketplace.
Ontario-based CARA Operations (now Recipe Unlimited) purchased Quebec’s St-Hubert restaurants for $537 million in 2016. The restaurant chain, founded in Montreal in 1951, maintains its distinct Quebec identity. Multiple foreign investment firms hold significant stakes in Recipe Unlimited through the parent company MTY Food Group. The company continues operating across Quebec while major business decisions are made outside the province.
In 2019, Toronto-based Onex Corporation acquired Westjet for $5 billion, with significant backing from international investors and foreign private equity firms. The airline maintains its headquarters in Calgary and continues operating as a Canadian carrier. Major foreign institutional investors hold substantial positions through Onex Corporation. While preserving its Canadian operations, the company’s ownership structure includes significant international investment.
Suncor Energy owns Petro-Canada stations, with significant foreign institutional investors holding major stakes. The company merged with Suncor in 2009 in a $19 billion deal. Petro-Canada remains a prominent Canadian retail fuel brand. International investment firms hold substantial voting shares in the parent company.
Loblaw Companies Limited, a Canadian company, acquired Shoppers Drug Mart in 2014 for $12.4 billion. Despite its Canadian roots, the pharmacy chain has significant foreign institutional investment. Under this foreign ownership, Shoppers Drug Mart continues to expand its healthcare services across Canada.
Presenters at last year’s C.D. Howe Institute’s conference on Canada’s debt problem had some pointed advice for our federal and provincial governments:
Canada’s public debt should be reduced about 10 percentage points of Canada’s GDP to ensure fiscal policy can be used to cushion the effects of future economic crises. Since major crises happen frequently, prudence suggests that the target should be achieved before the decade is out.
Tax increases harm economic performance, so elimination of public spending that does not provide enough benefits to offset this damage should be the first step in reducing deficits and debt. This will require undertaking comprehensive value-for-money assessments to identify wasteful spending.
Post-conference analysis found that achieving this prudent debt target would require increasing the combined federal-provincial primary balance by 1.4 percent of GDP, or $43 billion, starting in 2025/26. This amount includes a buffer – ensuring an 80 percent probability of meeting the debt target – to account for inevitable economic downturns, other crises that raise deficits and debt, and the uncertainty posed by fluctuating interest rates on financing costs.
The conference was one of four on deficits and debt held in Canada over the past 40 years. A clear and consistent message from these conferences – which politicians have yet to fully absorb – is that debt has economic costs and, therefore, imposes a burden on future generations. In this Commentary, the authors report on, and offer their analysis of, the findings of the latest conference.
Introduction
Does Canada have a debt problem? The answer from a recent C.D. Howe Institute conference is a resounding “yes.” Canada’s public debt should be about 10 percentage points of GDP lower to ensure sustainability. Given that major crises, which put upward pressure on deficits and debt, happen frequently, this target should be achieved before the decade is out.
The May 2024 conference was one of four on deficits and debt held in Canada over the past 40 years. Each aimed to provide guidance to policymakers on managing deficits and debt. While a common thread was concern about the economic cost of public debt, each conference provided context-specific policy advice.
The first conference, “Deficits: How Big and How Bad?” (Conklin and Courchene 1983), occurred when debt levels were rising rapidly but still relatively low. The key policy issue then was whether fiscal consolidation or expansion to support the economy was appropriate.
In the 1994 conference, “Deficit Reduction – What Pain, What Gain?” (Robson and Scarth 1994), and the 2002 conference, “Is the Debt War Over?” (Ragan and Watson 2004), there were clear recommendations to reduce debt levels. In 1994, this was motivated by concerns over economic damage caused by debt approaching 100 percent of GDP and questions about fiscal sustainability. By 2002, although the debt ratio had fallen substantially, further debt reduction was still advocated to reduce the burden on future generations who will not benefit from the spending.
A combination of discretionary measures and sustained economic growth led to a substantial reduction in the combined federal-provincial debt ratio from 2002 until the global financial crisis of 2007-2009. The debt ratio stabilized at a relatively high level after the crisis until the pandemic. The massive increase in debt during the pandemic and subsequent government spending raised the overall federal-provincial net debt ratio to about 75 percent of GDP, nearing levels from the time of the “Debt War” conference. This surge, combined with concerns about further increases, refocused attention on debt sustainability. This concern was reflected in the May conference, “Does Canada Have a Debt Problem?”, which recommended a debt target based on the need for fiscal prudence.
The latest conference included sessions on the economic costs of debt, the sustainability of federal debt, guidance for policymakers on a prudent and fair debt target, and reforming the federal fiscal framework. However, given the one-day format, not all issues could be thoroughly addressed. This report not only summarizes the proceedings but also fills some gaps by providing additional analysis to complement the presenters’ advice.
Economic Costs of Public Debt
Interest expenses were central to the analysis by University of Calgary economist Trevor Tombe of the economic costs of public debt. Interest paid on the public debt is often considered a transfer among individuals with no real impact on the economy. However, higher interest payments for a given level of program spending necessitate higher taxes, which harm economic performance by affecting incentives to work, save and invest. If not financed by tax increases, higher interest payments will crowd out valued program spending.
When discussing the opportunity cost of interest payments – the benefits of lower tax rates or higher program spending – Tombe cited work by Dahlby and Ferede (2022). They estimate the economic cost of raising an extra dollar of tax revenue, referred to as the “marginal cost of public funds” (MCPF). The MCPF includes both the dollar taken from the private sector and the loss in output per dollar of tax revenue raised due to reduced incentives to work, save and invest. Higher taxes shrink the tax base not only because of reduced economic activity but also due to efforts to reduce taxable income without changing economic behaviour.
Dahlby and Ferede (2022) find a very high cost from raising taxes. For the corporate income tax, the federal MCPF in 2021 was approximately two.1The MCPF from raising the top federal personal income tax rate has been higher than its corporate tax counterpart since 2012, when the corporate tax rate was reduced to 15 percent. The gap increased in 2016 when the top federal marginal personal income tax rate increased to 33 percent, pushing the MCPF to about 2.9.
The federal government expects to pay $54.1 billion in public debt charges in the current fiscal year. The economic cost of these payments is substantial. If the opportunity cost of these payments is lower corporate income taxes, their economic cost would also be about $54 billion. If their opportunity cost is a lower top personal income tax rate, their economic cost would exceed $100 billion. If the contribution from corporate income and top personal income tax were equal, the economic cost would be about $75 billion.
Other costs of public debt arise from a reduction in the national savings rate, which is the sum of public and private sector savings rates. Government deficits represent public sector dissaving, so with a constant private savings rate, national savings will decline when governments run deficits. Tombe highlighted the impact of lower national savings on investment, presenting data showing a negative correlation between debt ratios and investment ratios across countries (Figure 1). He stated there is “probably” a causal relationship between higher debt ratios and lower investment ratios.
Although Tombe did not elaborate, there are reasons to be circumspect about asserting causality. One reason is that the private savings rate may rise in response to budget deficits if economic agents anticipate higher future taxes to service the debt. Households might increase savings in anticipation, partially offsetting the decline in national savings. There is evidence that expansionary fiscal policy is partially offset by increased household savings. Johnson (2004) concluded that household savings would increase by 30-50 percent of the increase in government debt. In a recent study of fiscal expansions in the Euro area from 1999 to 2019, Checherita-Westphal and Stechert (2021) found that 19 percent of a fiscal stimulus is offset by higher household savings in the short-term, rising to 41 percent in the long-term.
Another reason for being cautious about inferring causality is that in an open economy, a decline in national savings does not necessarily lead to lower domestic investment, as any shortfall can be offset by borrowing from abroad. However, interest payments on borrowed funds and the return on foreign-owned capital reduce national income. An additional cost arises because the resulting current account deterioration must be offset by higher net exports, which requires a reduction in real wages in the export sector.
To complement Tombe’s analysis, we present an estimate of the economic cost of reduced national savings. In a closed economy with constant household savings, a budget deficit leads to a dollar-for-dollar crowding out of investment. Using historical returns on capital and assuming that national savings decline by 60 percent of the deficit due to offsetting increases in household savings, the $1,372 billion in federal net debt in the current fiscal year would have an economic cost of about $90 billion.2 This calculation does not capture the impact of lower capital intensity on productivity, so it underestimates the true cost.
If foreign savings offset the decline in national savings and foreigners invest directly in Canada, they receive the return on this capital, so the gross economic cost remains the same. However, the return is subject to corporate income tax, so the net economic cost would be about 25 percent lower. If Canadian firms borrow abroad to finance domestic investment, the economic cost is the interest paid to foreigners. While gross interest payments to foreigners will be less than the return on capital unless there is a large country-risk premium, interest payments are taxed more lightly.3 Therefore, the net economic cost may not differ substantially.
An additional cost of accessing foreign savings arises because higher capital servicing charges put downward pressure on the current account balance, which must be offset by an increase in net exports. In a small economy, export and import prices are determined in world markets, so the increase in net exports requires a decline in real wages in the export sector. However, if a country’s exports have unique features, increased supply can lower export prices, adding to the economic cost of borrowing from abroad (Burgess 1996).
Calculating the economic cost of investment crowding out when foreign borrowing is possible as the net-of-tax return on capital paid to foreigners establishes a minimum cost because it excludes the reductions in real wages required to increase net exports. The minimum cost would, therefore, be 0.75 x $90 billion = $68 billion, where the $90 billion reflects the economic cost of lower investment, adjusted by a factor of 0.75 to represent corporate income taxes on the returns paid to foreign investors. The $75 billion cost associated with raising taxes to finance higher federal interest expenses does not change with the availability of foreign financing, so the overall cost of the federal debt is approximately $142 billion, or 4.7 percent of GDP in 2024/25.
A similar calculation can be performed for overall provincial debt. In 2021/22, provincial net debt amounted to $784.7 billion, with debt service charges of $30.6 billion. Using the same weighted average economic cost of taxation as for the federal government, the economic cost of provincial debt service charges was $42 billion. The cost of investment crowding out adds another $39 billion, bringing the total cost of debt at the provincial level to $81 billion, or 3.2 percent of GDP in 2021/22. Assuming provincial debt remains at the same percentage of GDP from 2021/22 to 2024/25, the overall cost of Canada’s debt is about 8 percent of GDP.
Benefits of Debt and Its Optimal Level
Tombe also discussed the benefits of public debt, noting its role in financing long-lived assets, stabilizing the economy and smoothing tax rates over time. Governments should borrow to finance investments that will benefit future generations and should finance current expenditures out of current taxes. Spending on education, health and knowledge creation raises special concerns because it benefits both current and future generations. However, since each generation must make these investments, financing them through current revenues typically aligns with the benefit principle.
Counter-cyclical fiscal policy enhances social well-being by mitigating costly deviations from full employment. Additionally, governments can reduce the harmful effects of distortionary taxes by keeping them stable. Since the efficiency cost of taxes is higher when rates are above average than when rates are below average,4 governments should set tax rates at levels sufficient to support expected spending over the cycle and allow deficits to rise and fall in response to unexpected expenditures.5
An issue absent from discussions at the conference was the role of public debt in addressing market imperfections, which can improve efficiency. One such imperfection is the lack of adequate insurance markets against individual-specific wage income losses. As a result, individuals “self-insure” by increasing savings, which is more costly than paying the premiums in a well-functioning insurance market. Public debt puts upward pressure on interest rates and provides a safe savings instrument, allowing households to reduce their savings closer to the efficient level.
Unlike the efficiency gains from using public debt to stabilize the economy and smooth tax rates, mitigating the impact of inadequate insurance markets may justify a permanent increase in public debt. With a well-functioning insurance market, the optimal public debt ratio would be negative – governments should be net savers rather than net debtors. This would allow governments to finance expenditures from interest received on assets rather than from distortionary taxes.6
Empirical issues raised by the inadequate insurance-market approach include whether correcting the market failure is sufficient to make the optimal debt ratio positive and whether the penalty for deviating from the optimal ratio is significant enough to affect the choice of a debt target. Early analyses of incomplete markets found a positive optimal debt ratio. For instance, Aiyagari and McGrattan (1998) calculated an optimal debt ratio of 66 percent of GDP for the US economy. However, Peterman and Sager (2018), using a model with many of the same features as Aiyagari and McGrattan but incorporating multiple generations with standard life cycles instead of a single generation with an infinite life span, found that net government saving is optimal in the US economy. The main reason for the different result is that individuals in a life-cycle model spend a substantial fraction of their working lives accumulating enough savings to make self-insurance possible, so the benefit from self-insurance is smaller than if infinite life spans are assumed.
These results are less relevant for Canada for two reasons. First, employment insurance and other income support measures are more generous in Canada, so self-insurance leading to excess saving is less of an issue. Second, the US analysis assumes deficits are financed entirely by domestic savings, which is a much less realistic assumption for Canada. Foreign borrowing reduces the optimal debt ratio because it lessens the upward pressure on interest rates, which diminishes the impact of public debt on “self-insurance” savings and raises the cost of debt. James and Karam (2001) modified the Aiyagari and McGrattan model to allow borrowing from abroad, which changes the optimal debt ratio from 66 percent to about -80 percent. This qualitative result – that access to foreign savings reduces the optimal debt ratio – has been confirmed by other researchers (Nakajima and Takahashi 2017; Okamoto 2024; and Cozzi 2022).
This review suggests that the inadequate-markets approach does not reverse the conclusion from standard models that the optimal debt ratio is negative, implying that welfare gains can be realized when debt levels are reduced. However, the studies reviewed indicate that the penalty for deviating from the optimal debt ratio is small. In three of the six optimal debt studies reviewed, it is possible to compare the estimated economic costs. In the Peterman/Sager and Nakajima/Takahashi studies, a one-percentage-point increase in the debt ratio reduces consumption by .003 percent. The corresponding figure in the Cozzi study is much higher, approximately .02 percent. These estimates are very low relative to the estimates presented earlier, which imply a loss of .05 percent per percentage-point increase in the debt ratio.
It seems likely that these models are substantially understating the cost of debt. The benefits would have to be understated by an even larger percentage to overturn the conclusion that governments should be creditors not debtors. Since the argument for incurring debt to improve market efficiency is weak, the debt ratio should be chosen by considering only its impact on generational fairness. However, since debt is one of several factors affecting generational transfers, debt policy may have to deviate from the benefit principle to achieve a desired balance of the well-being of current and future generations.
Sustainability Analysis
High debt also raises concerns about its prudence or sustainability: can the interest expense be financed without requiring tax increases or cuts in program spending in the future? In his presentation, Alex Laurin, the Institute’s Vice President and Director of Research, challenged the federal budget’s claim that federal public finances are sustainable (Canada 2024, 382). The federal government’s sustainability claim is based on long-term projections showing a continuously declining debt-to-GDP ratio, reaching nine percent by 2055/56. Moreover, this trend holds even with less optimistic assumptions about interest rates and economic growth.
Laurin argued that this projection is not a convincing demonstration of sustainability for three reasons:
1) Interest Rate Assumptions: In the base case, the effective interest rate on federal debt (r) remains below the growth rate of the economy (g) for 32 years, which puts continuous downward pressure on the debt ratio. This assumption is inconsistent with the historical record. Over the past 35 and 45 years ending in 2022/23, averages of r-g are positive, at 0.8 and 0.4 percentage points, respectively. Only when the averaging period is extended back to include the high-inflation period starting in the 1970s does the multi-year average turn negative.7
2) Program Spending Assumptions: While revenues are assumed to grow in line with GDP, program spending decreases by about one percentage point of GDP over the projection period, causing the primary surplus to rise and putting downward pressure on the debt ratio. A more realistic “no policy change” assumption would keep the share of program spending roughly constant, allowing an assessment of the sustainability of current spending levels.
3) Exclusion of Economic Downturns: The projection fails to explicitly include economic downturns. Over the last 60 years, Canada has experienced five recessions, each prompting discretionary temporary stimulus measures that permanently increased debt. The policy response averaged 1.09 percentage points of potential GDP for each percentage point deviation from potential GDP (Table 1).
Laurin presented an alternative debt projection, assuming that overall program spending grows in line with GDP from 2029/30 to 2055/56 and that r equals g on average over the projection period.8 With these changes, the decline in the federal debt ratio is less pronounced, reaching 29 percent in 2055/56 compared to 9 percent in the budget projection.
Economic downturns were included in the projection by simulating 1,000 random probabilistic scenarios – assuming the frequency and magnitude of recessions over the past 60 years are representative of the future. Laurin assessed debt sustainability by calculating the probability that the debt ratio remains at or falls below its initial value over the projection period.9 The simulations showed an even chance that the debt ratio will exceed its 2028/29 value late in the projection period. Under the International Monetary Fund’s classification (IMF 2022), Canada’s federal debt would be considered unsustainable.
Some conference participants suggested that Laurin’s analysis might not fully capture the risks associated with the federal fiscal position because it assesses a single r-g profile. They also emphasized the importance of including provincial and territorial governments in any sustainability analysis, as these levels are most affected by demographic aging.
For this report, Laurin modified his approach to include provincial and territorial governments’ net debt and to capture the risks of r-g deviating from its assumed zero average over the long term. He introduced variability in the interest-rate growth-rate gap based on historical data, allowing for a more comprehensive risk assessment (methods and assumptions are provided in Appendix).
The modified analysis showed that, without any simulated shocks, the combined federal and provincial/territorial net debt-to-GDP ratio initially declines and then stabilizes until 2041/42, when rising healthcare costs due to demographic aging – and the associated interest on provincial debt – cause it to rise steadily (Figure 2, black dashed line). Introducing interest rate and recession shocks significantly alters the outlook, indicating a 50 percent chance that the debt ratio will begin its long-term rise in 2035/36, eventually surpassing 100 percent of GDP (black dotted line). There is a 20 percent chance (the 80th percentile) that the debt ratio will not decrease substantially from its current level and start a steady increase in 2033/34 (grey dotted line). Conversely, there is only a 20 percent chance (the 20th percentile) that the ratio will stay below its near-term value for the entire projection period (gold dotted line).
A Prudent and Fair Target
Prudence
According to McGill economist Christopher Ragan, the main concern about Canada’s high public debt is that it will reduce our ability to borrow to address the next economic crisis. He analysed this issue using three zones for the debt ratio: red (top), yellow (middle) and green (bottom) (Figure 3). The red (top) zone, which represents unsustainable debt, starts roughly five percentage points below the 1995 federal-provincial debt ratio’s peak of 100 percent, when Canada entered a period of “forced austerity.” This entry point to the red (top) zone is higher than the 90 percent threshold for negative effects on growth developed by Reinhart and Rogoff (2010). However, the threshold would be lower if the interest rate on public debt (r) were higher than the rate of economic growth (g).
Ragan argued that the current combined federal-provincial debt-to-GDP ratio is in the yellow (middle) “cautionary” zone. The height of this zone is determined by the buffer required to avoid being pushed into the red (top) zone by an economic crisis. Entering the red (top) zone would mean sharply higher interest rates and lower growth.
To avoid this, Ragan set the buffer at 28 percentage points of GDP, about a quarter more than the increase in the debt ratio during the COVID-19 pandemic. Given the frequency of economic crises, he advocated returning to the green (bottom) zone by 2029/30, nine years after the end of the pandemic-induced recession. This requires reducing the federal-provincial debt ratio by about 10 percentage points.
Laurin followed up by determining the fiscal effort required to return to the green (bottom) zone with high probability. His calculations show that, starting in the next fiscal year (2025/26), the combined federal-provincial primary balance would need to increase permanently by 1.38 percent of GDP – or $42.9 billion in 2025/26.10 If implemented through spending reductions, provincial spending would have to decline by about 7 percent, or federal spending would have to fall by almost 9 percent. Note that such spending reductions would still not fully return the combined federal-provincial program spending/GDP ratio to its pre-pandemic 2018/19 value. The federal government could achieve the same effect by raising the GST to 8.5 percent. However, since most spending pressures from an aging population are on provincial governments, it would be sound policy for the federal government to transfer tax points to provincial governments (Kim and Dougherty 2020). Even with near-term fiscal adjustment, additional consolidation may be necessary in the future to prevent a rise in the debt/GDP ratio.
Ragan favoured achieving the debt target through expenditure restraint rather than raising taxes, which he thinks may have reached their limit. Restraining expenditures will be particularly challenging given medium-term pressures from an aging society, rising military and security needs, and potentially increased public investments for the transition to a green economy. Canada, therefore, needs an ongoing and thorough program review to identify low-priority spending.
Fairness
Financing current government spending with debt is generally considered fair if the debt-to-GDP ratio is constant or declining over time, implying that future generations can receive the same level of government services without facing higher tax rates. However, stable tax rates alone are insufficient to prevent intergenerational transfers. Taxes must increase to finance the interest on the debt or remain higher than they would be otherwise. If the tax increase applies to both current and future generations, tax rates would be stable but higher than they would be without the increased debt. The higher tax rates required to finance debt interest and the deficit-induced reduction in national-savings transfer part of the cost of government spending to future generations who do not benefit from the spending.
Assessing generational fairness requires understanding the extent of intergenerational transfers resulting from fiscal policy. The presentation by Parisa Mahboubi, a Senior Policy Analyst at the Institute, offered insights into this issue using generational accounts. These accounts show lifetime net taxes imposed by federal and provincial governments for each birth cohort from 1923 to 2023 and for a composite future generation consisting of all persons born after 2023. The lifetime tax burdens of the 2023 birth cohort and future generations are comparable because a complete life cycle is captured in both cases. Her analysis shows that future generations are expected to face a slightly higher lifetime net tax burden than the youngest living generation.
Preparing generational accounts requires information on lifetime taxes and transfers for each birth cohort alive today and for future generations. Projected values of taxes paid by current birth cohorts are developed based on age-specific profiles of different types of taxes,11 assuming unchanged tax policies. Spending on health, education, elderly benefits, child benefits, social assistance and GST credits vary by age, while other government expenditures are evenly distributed per capita. Per capita taxes, transfers and expenditures are assumed to grow at the same rate as productivity.
The lifetime net tax burdens for currently alive birth cohorts are calculated as the present value of projected tax payments less the present value of projected government transfers the cohort will receive. Lifetime net tax burdens of future generations are calculated using the “no free lunch” constraint: someone, sometime, must pay for all that the government spends (US Congressional Budget Office 1995). The lifetime net tax burden of future generations equals the amount of future spending not paid by currently alive generations.12
In the baseline scenario, productivity grows 0.94 percent annually, the average GDP per capita growth from 2002 to 2022. The discount rate is the average return on real return bonds over the same period, 1.3 percent.13 Statistics Canada’s medium-growth scenario14 is used for demographic projections, with population growing at an average annual rate of 0.85 percent over the 100-year projection, driven entirely by net immigration. The ratio of those over 65 to those aged 18-65 – the old-age dependency ratio – more than doubles over the projection period, rising from 30 percent to 72 percent (Figure 4).
The increase in the old-age dependency ratio drives upward trends in elderly benefits and health-related expenditures as a share of GDP. Other categories of age-specific spending remain roughly constant.
In the baseline scenario, the lifetime net tax burden of future generations (“unborn”) exceeds that of the cohort born in 2023 (“newborn”) by $23,000 per person (Figure 5). Factors influencing this result include:15
Fiscal Position in the Base Year: In 2023, federal and provincial tax revenues exceeded program spending by over one percent of GDP. A smaller primary surplus would have decreased the lifetime net tax burden of the newly born, increasing the burden on the unborn.
Population Growth: Faster population growth reduces the relative tax burden on future generations by slowing the rise in the old-age dependency ratio and reducing the per-capita burden of existing debt.
Healthcare Costs: If real healthcare costs increase faster than productivity growth, the recently born will pay a smaller share, leaving more for future generations.
The baseline assumptions represent the midpoint of a range of plausible values. While results are sensitive to changes in assumptions, the baseline is considered the most likely outcome. The generational accounts, therefore, suggest that fiscal policy is generationally fair.
However, other factors must be considered when assessing fairness:
Population Stability: If there were no net population growth, the tax burden on future generations would be much higher, even if the old-age dependency ratio did not change, because the cost of existing debt would be spread over a smaller population. This observation draws attention to the fact that future generations will be paying for services they did not receive, even with stable lifetime net taxes.
Income Growth: Future generations will likely be richer due to productivity growth, which could justify asking them to bear some costs of current consumption. However, parents may not wish to pass on costs to their children, even if incomes are rising over time. Population growth through immigration substantially reduces intergenerational linkages, which could encourage the current generation to increase the target size of intergenerational transfers.
New Spending Pressures: The generational accounts do not capture new pressures like rising military and security commitments or higher spending to achieve a net-zero emissions economy. In both cases, underspending in the past has pushed costs into the future. Pre-funding some of this spending by increasing taxes in the near term would even out contributions across generations.
Comparisons with Near Term Future Generations: Generational accounts compare a representative future generation with the most recent birth cohort. Comparing the tax burden of living generations with the burden on near-term future generations is also relevant.
While the generational accounts indicate that the federal-provincial fiscal stance is fair to future generations under current assumptions, it is beneficial to supplement this analysis with assessments over shorter time horizons. For example, virtually all living generations benefited from the debt-financed income stabilization and health measures implemented during the pandemic-induced recession. There is a strong fairness argument for paying down pandemic-related debt before the next generation starts working and paying taxes, which would occur over the 2035-to-2045 period (Lester 2021).
Federal and provincial Covid-related spending amounted to approximately $430 billion from 2020/21 to 2022/23.16 Federal and provincial debt was $2,092 million in 2022/23. Reducing the level of debt to $1,660 million no later than 2045/46 would be fair to generations born in 2019 and later. However, in Laurin’s prudent scenario, in which debt is sustainable with 80 percent probability, the level of debt rises continuously over the projection period. The gap between the prudent and fair level of debt is $1,200 million in 2035/36. Achieving a fair level of debt would require more fiscal consolidation than is needed to achieve sustainability.
Reforming Expenditure Management
Ragan’s debt target and the recommendation to achieve it through expenditure restraint raise two issues:
1) Building Consensus: How to build a consensus on the proposed debt target and increase the likelihood of achieving it.
2) Identifying Savings: How to identify programs that don’t provide enough value to justify raising taxes to finance them.
Economist and C.D. Howe Institute Fellow-in-Residence John Lester emphasized that achieving a political consensus on a more prudent fiscal approach requires vigorous and sustained advocacy. Part of this advocacy involves convincing governments to surrender some policy flexibility to increase the odds of achieving the target reduction in debt and reduce the risk of relapse after the next crisis.
Lester and Laurin (2023) propose a principles-based fiscal governance framework intended to reduce the bias toward deficit financing in both good times and bad. Governments should adopt guiding principles for fiscal policy, set operational rules for achieving target outcomes and transparently assess consistency with these principles.
At the conference, Lester expanded upon one element of the governance framework: a binding multi-year ceiling on non-cyclical spending. A key motivation for this proposal is the failure to adhere to spending tracks set out in budgets and fiscal updates. For example, in the federal government’s 2019 Economic and Fiscal Update, program spending was projected to decline as a share of GDP, reaching 13.8 percent by 2024/25. The spending ratio projected for 2024/25 increased in successive budgets so that in 2024-25 it will be almost 2 percentage points higher than projected in 2019.18
Binding multi-year expenditure ceilings apply in 11 OECD member countries (Moretti, Keller, and Majercak 2023).19 In the Netherlands and Switzerland, the ceilings are set out in legislation that constrains expenditure growth. Alberta has recently adopted a similar approach.20 However, in most countries, expenditure ceilings are set by the government to ensure consistency with its self-defined fiscal objectives, which may or may not include expenditure restraint. This is the general approach recommended for Canada, although the hope is that the self-defined objective will be to achieve the debt target through expenditure restraint.
The expenditure ceiling would be binding for five years, ideally developed in the first year of a new electoral mandate after a campaign outlining spending plans in detail. The ceiling would cover all categories of spending directly affected by policy decisions. It would be updated annually to account for forecasting errors in program determinants (e.g., inflation, population growth). There would be escape clauses for major economic recessions, natural disasters and war. The ceiling could include a reserve for new policy initiatives, but in the context of expenditure restraint new initiatives may need to be funded by eliminating or modifying existing programs.
Identifying the programs that should be scaled back or eliminated because they don’t provide enough benefits to justify raising taxes to finance them requires, according to Lester, an overhaul of the way the government manages its spending, particularly the performance management framework that is key to establishing value for money. Yves Giroux set the stage for this discussion by describing the federal government’s current expenditure management system.
The requirement to evaluate programs was formalized following the creation of the Office of the Comptroller General in 1978. Despite several modifications, program evaluations have not been successful in affecting strategic spending decisions. The Ministerial Task Force on Program Review (the Nielsen Task Force) from 1984 to 1986 described evaluations as “generally useless and inadequate for the work of program review” (quoted in Grady and Phidd 1993). More recently, McDavid et al. (2018, 302) conclude that evaluations do not “address questions that would be asked as cabinet decision-makers choose among programs and policies.”
Under the current evaluation policy, federal government departments have considerable flexibility in conducting evaluations. They may focus on design and delivery, program beneficiary responses or a comparison of program costs and benefits. A review of 48 evaluations prepared since 2020 in eight departments21 found that only four went beyond assessing operational efficiency and impacts on beneficiaries to examine whether the program represented value for taxpayer money. Three of these applied formal benefit-cost analysis, which is the standard for assessing regulatory proposals.22
Evaluating programs in terms of operational efficiency and beneficiary impacts helps improve programs, but if evaluations are to inform strategic spending decisions, value-for-money assessments must be mandatory. These assessments should be based on the benefit-cost framework applied to regulatory proposals.
Benefit-cost analysis of regulatory proposals – and by extension, spending programs – assesses the overall social benefits and costs of policy initiatives. The quantitative analysis attempts to determine if the economic pie is larger or smaller after government intervention. For example, economic development programs (business subsidies) are implemented with the expectation that they will increase overall real income. To assess this, benefit-cost analysis considers not only the additional investment and employment resulting from the subsidy but also the opportunity cost of workers and capital – the amount that would have been earned otherwise. The net increase in the economic pie is the incremental earnings of workers and capital less efficiency losses from raising taxes or issuing debt to finance the subsidy and resources used to administer and apply for it.
The nature of the assessment should vary by program type. Business subsidies, labour market development programs and climate change mitigation/adaptation measures have benefits and costs measurable in monetary terms. These programs could be ranked by their net social benefits, allowing comparisons within and across program categories. Programs where benefits are less than costs would be candidates for elimination or modification.
A more nuanced approach is needed when assessing social programs and other measures with a fairness goal for several reasons. Their economic impact is ambiguous, and a negative economic impact is not a sufficient reason to eliminate a program. In addition, support for an income redistribution program depends on who benefits from it. As a result, evaluations of social programs should be more descriptive than prescriptive. They should present information on the economic impacts of measures, their fiscal cost, including administration expenses, and a discussion of who benefits from the program and how they benefit. Evaluations should also assess how the program fits into other measures providing support to the target population. This information will allow elected officials and, since all evaluations would be made public, Canadians, generally, to form an evidence-based opinion on the value for money of social programs.
A thorough assessment of government programs through a value-for-money lens may not identify enough wasteful spending to achieve deficit and debt targets. If so, tax increases should be used to achieve the objectives.
Adopting and achieving the debt target will require a political commitment that currently does not exist. The task for policy analysts is to help build a consensus on a more prudent approach to fiscal policy and a revamped expenditure management system. According to Lester, this consensus should be ratified by legislation setting out general principles for sound fiscal policy, supplemented with non-legislated operational rules to guide annual policy and monitor progress. This approach would impose discipline on fiscal policy while allowing flexibility to address unexpected developments. Legislation would strengthen the consensus on fiscal prudence and help prevent backsliding by future politicians.
Conclusion
The evidence presented at the conference confirmed that Canada has a debt problem. Existing debt levels are not prudent, and they raise concerns about generational fairness. Prudence requires that Canada’s public debt be reduced by about 10 percentage points of GDP before the decade’s end. This would require increasing the combined federal-provincial primary balance by 1.4 percent of GDP, or $43 billion, starting in 2025/26.
Tax increases harm economic performance, so elimination of public spending that does not provide enough benefits to offset this damage should be the first step in reducing deficits and debt. Identifying wasteful spending will require comprehensive value-for-money assessments. Governments must not take the easy way out by implementing across-the-board spending cuts. Successful expenditure restraint will also require setting binding multi-year expenditure ceilings to prevent governments from spending revenue windfalls or from increasing spending to improve chances of electoral success.
Canada’s public debt is imposing a burden on future generations. A comparison of the lifetime tax burden on the recently born with distant future generations reveals only a small generational transfer in favour of the recently born. However, burden shifting is much larger from currently living generations to persons born shortly after the pandemic-induced recession. The $430 billion in pandemic-related debt should be paid down by the people that benefited from the income stabilization measures. Achieving this fairness objective would require more fiscal consolidation than needed to ensure sustainability of the debt. For the Silo, Alexandre Laurin/John Lester via C.D. Howe Institute.
Appendix: Assumptions and Methods for the Sustainability Analysis
References
Aiyagari, S. Rao, and Ellen R. McGrattan. 1998. “The Optimum Quantity of Debt.” Journal of Monetary Economics 42 (3): 447–69.
Ambler, Steve, and Craig Alexander. 2015. “One Percent? For Real? Insights from Modern Growth Theory about Future Investment Returns.” E-Brief. Toronto: C.D. Howe Institute. October.
Burgess, David F. 1996. “Fiscal Deficits and Intergenerational Welfare in Almost Small Open Economies.” Canadian Journal of Economics, 885–909.
Canada. 2024. “Budget 2024.” Department of Finance Canada. April.
Checherita-Westphal, Cristina D., and Marcel Stechert. 2021. “Household Saving and Fiscal Policy: Evidence for the Euro Area from a Thick Modelling Perspective.” Available at: https://papers.ssrn.com/sol3/papers.cfm?abstract_id=3992188.
Conklin, David, and Thomas Courchene. 1983. “Deficits: How Big and How Bad?” Special Research Report. Toronto: Ontario Economic Council.
Grady, Patrick, and Richard W. Phidd. 1993. “Budget Envelopes, Policy Making and Accountability.” Government and Competitiveness Project, School of Policy Studies, Queen’s University. http://global-economics.ca/budgetenvelopes.pdf.
International Monetary Fund (IMF). 2022. “Staff Guidance Note on the Sovereign Risk and Debt Sustainability Framework for Market Access Countries.” 2022–039. IMF Policy Papers.
James, Steven, and Philippe Karam. 2001. “The Role of Government Debt in a World of Incomplete Financial Markets.” Department of Finance, Economic and Fiscal Policy Branch.
Jenkins, Glenn, and Chun-Yan Kuo. 2007. “The Economic Opportunity Cost of Capital for Canada-an Empirical Update.” Queen’s Economics Department Working Paper. Available at: https://www.econstor.eu/handle/10419/189409.
Kim, Junghum, and Sean Dougherty (eds.) 2020. “Adaptability, accountability and sustainability: Intergovernmental fiscal arrangements in Canada,” in Ageing and Fiscal Challenges across Levels of Government, OECD Publishing, Paris.
Mahboubi, Parisa. 2019. Intergenerational Fairness: Will Our Kids Live Better than We Do? Commentary 529. Toronto: C.D. Howe Institute. January.
McDavid, Jim, Astrid Brousselle, Robert P. Shepherd, and David Zussman. 2018. “Linking Evaluation and Spending Reviews: Challenges and Prospects.” Canadian Journal of Program Evaluation 32 (3): 297–304. https://doi.org/10.3138/cjpe.43176.
Modigliani, Franco. 1983. “Government Deficits, Inflation and Future Generations.” In Deficits: How Big and How Bad, pp. 55–71.
Nakajima, Tomoyuki, and Shuhei Takahashi. 2017. “The Optimum Quantity of Debt for Japan.” Journal of the Japanese and International Economies 46:17–26.
Okamoto, Akira. 2024. “The Optimum Quantity of Debt for an Aging Japan: Welfare and Demographic Dynamics.” The Japanese Economic Review. May. Available at: https://doi.org/10.1007/s42973-024-00156-7.
Panizza, Ugo, Richard Varghese, and Yi Huang. 2019. “Public debt and private investment.” Centre for Economic Policy Research. VOXEU Column. December 4.
Reinhart, Carmen M., and Kenneth S. Rogoff. 2010. “Growth in a Time of Debt.” American Economic Review 100 (2): 573–78. https://doi.org/10.1257/aer.100.2.573.
Robson, William, and Parisa Mahboubi. 2024. Another Day Older and Deeper in Debt: The Fiscal Implications of Demographic Change for Ottawa and the Provinces. Commentary 665. Toronto: C.D. Howe Institute. August.
Robson, William, and William Scarth. 1994. Deficit Reduction – What Pain, What Gain? (Policy Study 23). Toronto: C.D. Howe Institute.
Canadian consumers and businesses pay more than $80 billion a year in property & casualty insurance premiums with an upward trend consistently in excess of our anemic GDP growth rate. The total cost is now more than 3 percent of GDP. … But how does Canada benchmark relative to its global peers?
• Canadians pay higher premiums for property and casualty insurance than citizens in many, if not most, other developed nations. This Commentary uses OECD data and private industry data to compare the national P&C insurance sector’s premiums as a percentage of Gross Domestic Product with its international peers and is an update of the findings of the author’s 2021 edition of this report.
• The Commentary focuses on liability, property and auto insurance to compare costs across nations. Then, it takes a deeper dive into the Canadian data to compare personal property and auto insurance among all provinces and territories.
• When it comes to costs for property insurance, the study finds Canada is in the top ranks, paying 1.23 percent of GDP in premiums, almost double the 0.66 percent average of other G7 peers and even higher than the 0.52 percent OECD average.For automobile insurance (which here includes both personal and commercial), Canadians appear to be paying, on average, the highest premiums in the world, relative to GDP.
• Within Canada, inter-provincial benchmarking for personal property insurance shows the higher average premiums paid in Canada – relative to the rest of the developed world – appear to be shared equally by most provinces. However, province-by-province comparisons of personal auto insurance show that there are substantial differences among provinces, with four jurisdictions producing higher-than-average results. Two of the four (Saskatchewan and Manitoba) are government-monopoly jurisdictions – in fact, these are the two highest in terms of costs. The two other outliers (Ontario and Alberta) are served by a competitive private sector, but Alberta has chosen until very recently to maintain a costly tort environment and Ontario mandates particularly generous accident benefits and has experienced a plague of auto theft.
• In the case of automobile insurance, just a handful of provinces need to think harder about how to improve car insurance premiums. But to reduce the cost of living for homeowners, the solutions required must be national in scope and include public/private partnerships to share the rapidly increasing risk-transfer price of natural catastrophe events.
Read the full article by Alister Campbell via this PDF.
Key Canadian trade laws do not refer to national security as a factor that allows Canada to counter threats from imports of goods or services. Given the tense geopolitical situation, I propose ways to close this “national security gap.”
The gap is particularly worrisome in two key import-governing legislation: (1) the Customs Tariff Act and (2) the Export and Import Permits Act.
I will show why the omission of the national security element in these and possibly other statutes needs to be remedied.
National Security & Chinese Exports
The Americans imposed surcharges on Chinese EVs, steel, aluminum, semiconductors and other products in May 2024 in response to heavily subsidized Chinese imports that were said to have breached international trade rules.
The EU started applying countervailing duties on Chinese EVs in July this year, using a more standard trade remedy process to counter the injurious impact of subsidized imports on the European automotive industry.
The danger posed by Chinese EVs, steel and aluminum imports, plus these actions by Canada’s major trading partners, led the Canadian government to apply comparable tariff surcharges. The strategic threat posed by China’s state-subsidized exports made for the right response by Canada.
While existing laws allowed the federal cabinet to take action in this case, it also brought home the fact that there is an absence of any reference to “national security” in some of Canada’s major trade law statutes.
Section 53 – Canada’s Rapid Response Mechanism
In the United States, Section 232 of the 1962 Trade Expansion Act, along with Section 301 of the 1974 Trade Act, authorize the president to increase tariffs on imports if the quantity or circumstances surrounding those imports are deemed to threaten national security.1
Section 232 was used by the Trump administration in 2018 to apply surcharges to a range of imports from numerous countries, including Canada. However, these tariffs were ultimately dropped in the face of threats by Canada to retaliate against American goods exported to Canada.
Unlike the US, Canada lacks the legislative means to impose import surcharges on the basis of national security. The closest we have is Section 53 of the Customs Tariff Act, which focuses on the enforcement of Canada’s rights under trade agreements and responses to practices that negatively affect Canadian trade. It was Section 53 that was used in the August decision on Chinese EVs, etc., referred to earlier.
Indeed, there are similarities between Section 301 of the US Trade Act of 1974 and Section 53 of the Customs Tariff Act.But while existing laws allowed the federal cabinet to act in this case, the case brought home the fact that there is an absence of any reference to “national security” in some of Canada’s major trade law statutes.
Governments have shied away from using Section 53 as a policy tool over the years. It was used only once before its present deployment, in response to the Trump administration’s surcharges on Canadian steel and aluminum in 2018 and 2020.2
The surcharges were ultimately withdrawn when the US tariffs were terminated.Section 53 comes under Division 4 of the Actentitled “Special Measures, Emergency Measures and Safeguards,” giving the government broad powers to apply unilateral tariff measures on the joint recommendation of the ministers of Finance and Global Affairs:
…for the purpose of enforcing Canada’s rights
under a trade agreement in relation to a country
or of responding to acts, policies or practices of
the government of a country that adversely affect,
or lead directly or indirectly to adverse effects on,
trade in goods or services of Canada…
There is no requirement for public consultations or input under this provision. Although the government held a round of stakeholder consultations before moving on Chinese imports in August, it was not legally obliged to do so. While the ministerial recommendations must be fact-based and supported by credible data, the law is effective in that nothing inhibits rapid action by the federal cabinet. In this respect, it is a superior tool to Section 232 of the American legislation.3
The critical shortcoming, on the other hand, is that while allowing the government to protect Canadian trade interests in a fairly rapid fashion, Section 53 does not allow action on imports found to be threatening national security, whether it be economic, military or other. There is clearly a need to repair this omission, not only here but in Canada’s other trade laws.
In my view, we need a national security component in Section 53 as the Canadian counterpart to Section 232 of the US Trade Expansion Act.
Import Controls and National Security
Together with tariff measures, Canada can control imports under the Export and Import Permits Act(EIPA) through the creation of import (and export) control lists designed to achieve particular strategic, security and economic objectives. These lists are established by orders-in-council,
requiring listed goods and technology to have a permit in order to be imported or exported. These permits are issued by the Trade Controls and Technical Barriers Bureau in Global Affairs Canada (GAC). Without a permit, imports of controlled items are illegal.
While Section 5(1) of EIPA provides for the creation of import control lists covering arms, ammunition and military items, it fails to provide for imports of goods or technology to be controlled for national security reasons. The Act could not have been used, for example, to deal with the effects on national security of imports of Chinese EVs, steel, aluminum or any other goods or technology. EIPA is thus deficient in this regard.
There is a related issue when it comes to export controls. Section 3(1) of EIPA authorizes the establishment of export control lists, among other reasons:
“(a)…to ensure that arms, ammunition,
implements or munitions of war, etc. … otherwise
having a strategic nature or value will not be made
available to any destination where their use might
be detrimental to the security of Canada.”
The reference to the “security of Canada” under paragraph (a) is the only such reference in the statute and is confined to the security aspects of imports of arms, ammunition, munitions of war, etc. While not as significant as the problems regarding import controls, it is nonetheless a serious omission.
The result is that as EIPA is currently drafted, the federal government lacks the legal authority to create import or export controls designed to protect or safeguard Canadian security. EIPA needs to be amended to add this authority on the part of the government.
Indeed, it may be desirable to re-consider much of the architecture of EIPA from the viewpoint of safeguarding Canada’s security interests on both the export and import side.
Controlling Imports Through Sanctions
Canada’s sanctions laws are found in the Justice for Victims of Corrupt Foreign Officials Act (JVCFOA), the United Nations Act, and, notably, the Special Economic Measures Act (SEMA). Each of these statutes allows the federal cabinet to issue sanctions through regulations
applicable to specific countries and/or jurisdictions and prohibiting transactions in specific items of goods or technology. None of these laws allow sanctions for matters related to Canadian security.
SEMA is Canada’s most widely used sanctions legislation. Section 4 is the only part of the Act that uses the term “security,” but only in instances when, among other matters:
(b) a grave breach of international peace and
security has occurred that has resulted in or is likely
to result in a serious international crisis.
Because of the restrictions on international peace and security, the government lacks the authority to issue sanctions dealing with national security interests.4
For example, Canada’s sanctions on Russia are directed at countering actions that “constitute a grave breach of international peace and security that has resulted or is likely to result in a serious international crisis,” with no reference to Canadian national security interests.
SEMA should be amended to allow prohibitions of any transaction or dealings of any kind where Canada’s national security is at risk.
Trade Remedies and National Security
In accordance with the GATT/WTO Agreement, antidumping and countervailing (AD/CV) duties can be applied to dumped or subsidized imports when a domestic industry is injured or threatened with injury from exactly the same imports as that industry produces. In Canada, these are provided for under the Special Import Measures Act (SIMA).
SIMA actions are driven by complaints filed by domestic producers who make exactly the same or directly competitive products as the imported items. It means, for example, that in the absence of a Canadian industry threatened with injury or actually injured by the same type of Chinese EVs, aluminum or steel imports as those producers make, AD/CV duty remedies would not be available. SIMA makes no reference to national security as a factor in the application of these duties.
In short, because the SIMA process is geared to provide protection to domestic producers and private sector industries, it is inappropriate as a vehicle for dealing with national economic security concerns that range well beyond those private interests.
The same is true in the case of safeguards, another kind of trade action allowed under the World Trade Organization (WTO) Agreement to counter floods of imports that are not dumped or subsidized but, because of their volume, cause or threaten serious injury to domestic producers of the same product.
In Canada, safeguard measures come under the Canadian International Trade Tribunal Act, where an inquiry takes place and, if recommended by the Tribunal, are applied under the Customs Tariff Act.
As in the case of dumped or subsidized imports, safeguard measures are designed to protect specific domestic industries and not to deal with overarching national security issues.
Again, because the objective of these remedial measures in international and Canadian trade law is to protect a domestic industry from financial harm due to imports and not to deal with broader questions of national security, the absence of reference to “security” in these various statutes does not seem to be a significant issue.
National Security under International Trade Law
Article XXI of the 1947 General Agreement on Tariffs & Trade (GATT) is the only provision in the entire WTO package that deals with national security. That article (entitled “Security Exceptions”) allows departures from normal trade rules to permit unilateral trade-restrictive measures that a contracting party “considers necessary for the protection of its essential security interests…taken in time of war or other emergency in international relations.”
The drafting of GATT Article XXI dates back to the post-World War II Bretton Woods era. What was considered an international emergency at that time was war, regional armed conflict or a global pandemic like the Asian flu of 1918-1920. The same broad view of international emergency conditions was applied when the Uruguay Round negotiations took place (1991-1994) leading to the conclusion of the WTO Agreement.
With recent cataclysmic changes in the world, whatever the WTO-administered multilateral system might prescribe, governments are moving to protect a range of national (and economic) security concerns by means of unilateral measures in ways that were not envisaged when the Bretton Woods architecture was devised in the late 1940s.
For decades, there was little recourse to Article XXI exceptions. However, their use emerged in the last number of years with the unilateral surcharges imposed by Trump.
The situation is different – and materially different – in the case of Chinese exports, not only EVs, steel or aluminum but also in technologically advanced or other critical items. These are goods that, by abundant evidence, are heavily subsidized, with massive overcapacity, exported to global markets as part of the Chinese government’s strategy to enhance its geopolitical position – facts uncovered in the EV situation through detailed investigations by the EU and the US.5
Thus, aggressive actions by China and possibly other countries in strategically sensitive areas take the issue beyond the WTO ruling in the US-Section 232 case and raise these to the level of an “emergency in international relations.”
In summary, the concept of an international emergency is much changed in today’s digitized, cyber-intensified world, including the aggressive and destabilizing policies of Chinese state capitalism and other bad actors. The application of GATT/WTO rules drafted in 1947 and updated in the 1990s must be adapted to deal with today’s realities if they are to provide governments with meaningful recourse.
Conclusions
In conclusion, Canada has a panoply of criminal, investment, intelligence gathering and other laws that address national security concerns. However, there is a notable absence of the term “national security” in Canada’s core trade law statutes.
This absence is of concern in the Customs Tariff Act and the Export and Import Permits Act, two important statutes that give the government authority to act to counter injurious imports threatening Canada’s national security.
Given the state of world affairs and the challenges Canada faces from aggressive players like China, Russia, Iran and others, the omissions in these statutes need to be remedied. This should be acted on immediately. There is also a lack of reference to national security in Canada’s sanctions legislation, notably the Special Economic Measures Act (SEMA), the main Canadian sanctions statute.
Amendments should be made to make security concerns a ground for imposing sanctions here as well. The findings of EU agencies on Chinese BEV after a detailed investigation support the view that Chinese state capitalism and its centrally planned industrial capacity are geared toward dominating world markets in critical goods, part of that country’s geopolitical strategy. These and other similar governmental actions can be said to meet the “emergency in international relations” threshold under the WTO Agreement.
Given the state of affairs at the WTO, including the paralysis of its dispute settlement system, amendments to or reinterpretation of the GATT rules are difficult, if not impossible. The result is that governments will be resorting to unilateral application of the Article XXI exclusion in their own national security measures. While the situation may evolve at the WTO, and without diminishing Canada’s support for the multilateral rules-based system, the federal government should bring forth measures to add reference to national security interests in the above statutes. For the Silo, Lawrence L. Herman/ C.D. Howe Institute.
International Economic Policy Council Members
Co-Chairs: Marta Morgan, Pierre S. Pettigrew Members: Ari Van Assche Stephen Beatty Stuart Bergman Dan Ciuriak Catherine Cobden John Curtis Robert Dimitrieff Rick Ekstein Carolina Gallo Victor Gomez Peter Hall Lawrence Herman Caroline Hughes Jim Keon Jean-Marc Leclerc Meredith Lilly Michael McAdoo Marcella Munro Jeanette Patell Representative, Amazon Canada Joanne Pitkin Rob Stewart Aaron Sydor Daniel Trefle
1 The Trade Expansion Act of 1962 (Pub. L. 87–794, 76 Stat. 872, enacted October 11, 1962, codified at 19 U.S.C. ch. 7); The Trade Act of 1974 (Pub. L. 93–618, 88 Stat. 1978, enacted January 3, 1975, codified at 19 U.S.C. ch. 12).
2 The government announced it was applying these “to encourage a prompt end to the U.S. tariffs, which negatively affect Canadian workers and businesses and threaten to undermine the integrity of the global trading system.” See: “United States Surtax Order (Steel and Aluminum),” Government of Canada, June 28, 2018, https://gazette.gc.ca/rp-pr/p2/2018/2018-07-11/html/sordors152-eng.html.
3 Section 232 of the Trade Expansion Act allows the president to impose import restrictions – but these must be based on an investigation and affirmative determination by the Department of Commerce that certain imports threaten to impair US national security.
4 The array of Canada’s sanctions can be found on the GAC website at: https://www.international.gc.ca/world-monde/international_relations-relations_internationales/sanctions/current-actuelles.aspx?lang=eng.
5 The EU measures followed a countervailing duty approach, as opposed to direct action in the case of Canada and the US. In its extremely detailed investigation, EU agencies found, on the basis of massive evidence, that: “ . . . the BEV [battery electric vehicle] industry is thus regarded as a key/strategic industry, whose development is actively pursued by the GOC as a policy objective. The BEV sector is shown to be of paramount importance for the GOC and receives political support for its accelerated development. Including from vital inputs to the end product. On the basis of the policy documents referred to in this section, the Commission concluded that the GOC intervenes in the BEV industry to implement the related policies and interferes with the free play of market forces in the BEV sector, notably by promoting and supporting the sector through various means and key steps in their production and sale.”See: “Commission Implementing Regulation (EU) 2024/1866,” European Union, July 3, 2024, at para. 253, https://eur-lex.europa.eu/eli/reg_impl/2024/1866/oj
The Pakistani national who allegedly plotted to travel to New York to murder Jews was seeking refugee status in Canada, according to an immigration consultant.
Muhammad Shahzeb Khan, who came to Canada in June 2023 on a student visa, was arrested on Sept. 4 by the RCMP for allegedly intending to carry out a mass shooting targeting Jews in New York City. He was charged by U.S. authorities with attempting to provide material support and resources to a designated foreign terrorist organization, the Islamic State of Iraq and al-Sham (ISIS), and the United States is seeking to have him extradited.
Fazal Qadeer, an immigration consultant who had worked with Khan, said Khan was applying for refugee status on the basis of sexual orientation, saying he is gay, CBC reported on Oct. 7.
It is not known what Khan’s refugee claim status was when he was arrested, but Qadeer said Khan had recently had a lengthy interview with Immigration, Refugee and Citizenship Canada (IRCC).
Immigration Minister Marc Miller said in September that Khan entered Canada on a student visa.
According to a U.S. criminal complaint that was unsealed in September 2024, Khan repeatedly expressed his support for ISIS and his intention to carry out a terrorist attack around November 2023.
That month, he began interacting online with an undercover FBI agent, and explained his plan to attack Jewish religious centres in the United States around the time of the one-year anniversary of Hamas’s Oct. 7 terrorist attack against Israel.
In a statement, IRCC said it would not comment on individual cases, but that all asylum claimants receive an “independent and fair assessment on the individual merits of their claim,” which included whether they fear persecution based on race, religion, political opinion, nationality, or if they are LGBT.
Minister ‘Confident’ in Screening System
Khan’s arrest came months after a father and son were arrested by the RCMP in Richmond Hill, Ont., for allegedly being in the “advanced stages of planning a serious, violent attack in Toronto.” The two are facing nine terrorism charges, including conspiracy to commit murder on behalf of ISIS.
Ahmed Eldidi had been admitted into Canada in 2019 and later given citizenship, while Mostafa Eldidi was granted refugee status, according to documents provided by IRCC.
Miller defended Ottawa’s immigration system when appearing before the House of Commons public safety committee in September, saying the government remains “confident in the way our biometric system works in the progressive screening that operates in our country.”
Miller told the committee that Ahmed Eldidi had his initial temporary resident visa application refused because of concerns he would not leave Canada at the end of his authorized stay, but his second application was approved after an officer was satisfied he merely intended to visit Canada. He was given a favourable recommendation, Miller said, and officers found no issues that made him inadmissible to Canada.
Conservative MPs on the committee questioned screening procedures and accused the Liberal government of removing the mandatory requirement for police background checks for arrivals from some countries including Pakistan in 2018.
The IRCC’s website currently states that those applying for permanent residence, citizenship, or the International Experience Canada program “may need to provide a police certificate for any other programs” if they have a prior criminal record, but does not specifically mention Pakistan. For the Silo, Matthew Horwood.
Featured image- RCMP logo is seen outside the force’s ‘E’ division headquarters in Surrey, B.C., on March 16, 2023. The Canadian Press/Darryl Dyck.
OPP officers stand near the scene of a shooting where one Ontario Provincial Police officer was killed and two others were injured in the town of Bourget, Ont. on May 11, 2023. The Canadian Press/Patrick Doyle
Violent crime is surging in some of Canada’s major cities, with sexual assault rates showing the largest increase over the short and long term, according to a new report.
Sexual assault cases climbed in eight of nine major cities over the past seven years, with Ottawa being the exception to the trend, according to a study [read the full report at the end of this post] by the Macdonald Laurier Institute (MLI). The incidence of sexual assault has risen since 2016 in Vancouver, Calgary, Edmonton, Winnipeg, Toronto, Montreal, Peel, Ont., and York, Ont., with the last nearly doubling from 2016 to 2023.
“In recent years there has been a surge in violent crime across Canada as a whole,” says the report authored by Dave Snow and Rickard Audas, senior fellows at MLI. “We found that violent crime was increasing in many cities in the short-term, most notably for sexual assaults and robberies.”
Winnipeg and Edmonton recorded the highest number of sexual assault cases during the seven-year period. In 2023, Edmonton had a sexual assault rate of 108.64 cases per 100,000 people, while Winnipeg saw a rate of 107.76. Toronto followed at 97.8 cases.
The rate in Peel, on the other hand, was 52.15 cases last year, the lowest among all major cities.
The study’s goal was to analyze crime trends at a local level. To do so, the authors looked at 10 years of police-reported violent crime records from nine major cities, which they say account for one-third of the Canadian population.
They considered four crime categories: homicide, aggravated assault, sexual assault, and robbery. They did not include Vancouver data on sexual assault because of differences in how it reports the crime, they noted.
Winnipeg: Highest Robbery Rates
The robbery rate in Manitoba’s capital last year was nearly triple that of every other major city, at 305.82 cases per 100,000 population, according to the report. The rate has increased by more than 50 percent since 2016, decreasing slightly from 2019 to 2021, and reaching a peak in 2023.
The authors noted the rate decline coincides with the years of pandemic lockdowns.
The second highest robbery rate last year was in Edmonton, which had less than half that of Winnipeg, at 106.01 cases per 100,000 population. Alberta’s capital city had the second highest rate for the entire period, while Montreal and Toronto have followed closely in recent years.
By contrast, York reported the lowest robbery rates since 2016 among all major cities, with 31.66 cases last year. Ottawa and Peel also reported lower rates than other cities.
Edmonton: Highest Rates of Aggravated Assault
Edmonton’s aggravated assault rate in 2023 was more than four times that of any other major Canadian city except Winnipeg, said the report, at 38.72 incidents per 100,000 population compared to Winnipeg’s 22.81.
Aggravated assault refers to injuring, maiming, disfiguring, or endangering someone’s life, according to the Criminal Code of Canada.
The aggravated assault rate from 2016 to 2023 was highest in Edmonton, where it’s been rising steadily over the last decade, according to the study. Winnipeg had the second highest rates in the study period.
The authors said that despite being Canada’s largest city, Toronto has experienced “a considerable decline” in its aggravated assault rate over the last decade, with 8.29 cases in 2023.
York had the lowest rates since 2016, followed by Peel and Montreal. For The Silo, Carolina Avendano/The Epoch Times.
Let’s Hope for Solid Hit from the PBO’s Third Swing at Carbon Tax Analysis
The “corrected” analysis by the Parliamentary Budget Office of the carbon tax and rebates is due soon. One hopes it will get more things right in this third crack at evaluating the government of Canada’s assurance that most Canadians will receive enough from the carbon tax rebates to cover their cost of paying the tax.
Reporting in 2022 and in an update last year, the PBO analysis confirmed the government assertion so long as induced economic effects from the carbon levy are not included. However, once the economic damage from the levy is included, the PBO concluded that the rebates fall short of keeping family budgets whole.
The PBO’s conclusion was seized on by Conservative politicians and others to justify calls to revoke the carbon tax. Now, more knives have come out. The NDP says it would scrap the tax on households and put the burden on large emitters, but it does not yet explain how it would square that with the current big-emitter carbon tax. And BC, where carbon taxing began in Canada, has said it would drop the tax if Ottawa removed the legal requirement.
Much is at stake with this third PBO swing.
After the second report, the PBO admitted that its analysis had included, in addition to the carbon tax on households, the tax on large emitters as well. The economic impacts had been taken from work passed over to the PBO by Environment and Climate Change Canada (ECCC), which included the effects of the tax as applied to both industrial and household payers. The budget officer said the error was small and had little consequence for the analysis and promised a corrected version this fall.
The Canadian Climate Institute estimates that 20-48 percent of the emissions reduction by 2030 will come from the levy on large emitters compared to 8-14 percent from households. Given the scale of the large emitters tax, it is likely that it has significant economic effects on any forecast. Fixing this should not, however, be the most consequential revision to its analysis.
The PBO’s first two efforts had an analytical asymmetry. It measured the economic cost originating in the tax, exaggerated as it turned out, but did not attempt to capture the economic benefits (not to mention any health gains) from the effects of the household carbon levy in mitigating climate change. Put differently, their work was, in effect, based upon the faulty premise that climate change brings no economic damage. The massive and growing costs of cleaning up fire and flood damage and adapting to the many other consequences of global warming bear evidence of such costs. The PBO could and should do its own analysis of those climate change costs and, hence, the benefits of mitigation. Or it could more easily tap into the substantial body of available literature.
Lowering Canada’s Gross Domestic Product
In Damage Control, the Canadian Climate Institute estimated climate change would lower the Gross Domestic Product by $35 billion from what it would otherwise have been in 2030; the impact would rise to $80 to $103 billion by 2055. Through cutting emissions, the household carbon tax will reduce this cost. International literature is rich, and the PBO could review it for applicability to Canada. As but one example, Howard and Sterner’s (2017) meta-analysis on the impacts of climate change concluded most studies underestimated them. Their preferred estimate points to a GDP hit of between 7 and 8 percent of GDP if there are no catastrophic damages and 9 to 10 percent if there are. Conceptual thinking is also advancing. Consideration is being given to there being “tipping points” where a certain degree of climate change may have much more non-linear dramatic economic effects. Some, like Stern and Stigliz, even question the worth of comparing an economic outlook with mitigation action against a status quo baseline as the PBO has done. They argue that without mitigation, there may not be a sustainable economic outcome.
Finally, those still inclined to think that a corrected Fall 2024 PBO report will provide ammunition to “axe the tax” need to ask themselves two questions.
First, is there value in the emissions reduction resulting from the household carbon tax? The Canadian Climate Institute concludes that the 8-14 percent contribution to emissions reduction by 2030 will grow in later years. Even with the tax and all the other policies announced to date, there is a 42-megatonne gap in Canada’s 2030 emissions reduction target. More than 200 Canadian economists signed an open letter asserting that “carbon pricing is the lowest cost approach because it gives each person and business the flexibility to choose the best way to reduce their carbon footprints. Other methods, such as direct regulations, tend to be more intrusive and inflexible, and cost more.” If not the household carbon tax, then what else?
Don Drummond is the Stauffer-Dunning Fellow in Global Public Policy and Adjunct Professor at the School of Policy Studies at Queen’s University and a Fellow-In-Residence at the C.D. Howe Institute.
Several individuals in the UK have been sentenced to prison for posts they made online as authorities crack down on recent protests that led to race-motivated crimes. The laws that were used for the arrests in the UK compare as strikingly similar to Canadian laws dealing with online speech, including both existing legislation and the proposed Bill C-63. Why It Matters: Bill C-63, which has received second reading, significantly changes the laws governing online content in Canada.
“It’s alarming that the bill [C-63] enables individuals to anonymously file complaints with the Canadian Human Rights Commission against those they deem to be posting hate speech. If found guilty, the Canadian Human Rights Tribunal can impose fines of up to $70,000 cad and issue takedown orders for the content in question.
“If the courts believe you are likely to commit a ‘hate crime’ or disseminate ‘hate propaganda’ (not defined), you can be placed under house arrest and your ability to communicate with others restricted.” revolver.news
Via eurocanadians.ca/ The People’s Choice by Sean Adl-Tabatabai: The Trudeau government has introduced a potentially Orwellian new law called the Online Harms Bill C-63, which will give police the power to retroactively search the Internet for ‘hate speech’ violations and arrest offenders, even if the offence occurred before the law existed. This new bill is aimed at safeguarding the masses from so-called “hate speech”.
Revolver.news reports: The real shocker in this bill is the alarming retroactive aspect.
Essentially, whatever you’ve said in the past can now be weaponized against you by today’s draconian standards. Historian Dr. Muriel Blaive has weighed in on this draconian law, labeling it outright “mad.” She points out how it literally spits in the face of all Western legal traditions, especially the one about only being punished if you infringed on a law that was valid at the time of committing a crime.
The Canadian law proposal is outright mad. It is retroactive, which goes against all our Western legal tradition, according to which you can be punished only if you infringed a law that was valid at the time when you committed a crime: “And it isn’t just stuff you’ve posted after the new law comes into force you can get into trouble for – oh, no – but anything you’ve posted, ever, dating back to the dawn of the internet. In other words, it’s a gold-embossed invitation to offence archaeologists to do their worst, with the prospect of a $20,000 cad reward if they hit paydirt. The only way to protect yourself is to go through all your social media accounts and painstakingly delete anything remotely controversial you’ve ever said.”
“Although, that won’t protect you from another clause in the bill – and this is where it trips over into as yet unimagined dystopian territory. If the courts believe you are likely to commit a ‘hate crime’ or disseminate ‘hate propaganda’ (not defined), you can be placed under house arrest and your ability to communicate with others restricted. That is, a court can force you to wear an ankle bracelet, prevent you using any of your communication devices and then instruct you not to leave the house. If the court believes there’s a risk you may get drunk or high and start tweeting under the influence – although how is unclear, given you can’t use your phone or a PC – it can order you to submit regular urine samples to the authorities. Anyone who refuses to comply with these diktats can be sent to prison.”
By externalizing the defense of free speech to the right and extreme right and by endorsing repression, the liberal left is playing a very dangerous game here. For those of us who are NOT on the right and extreme right, this is rather disheartening… The left is actually shooting itself in the foot and will come back whining, ‘amazed’ that ordinary people are so ‘ungrateful.’ Indeed it seems to have forgotten that the rule of law implies to solve disagreements in the voting booth rather than by silencing those who disagree with us. How can it hope to get the support of the public for this insanity?
An online X user recently shared that his wife wrote a letter to every Canadian MP concerning this chilling bill, and only one MP responded. He posted MP Rachel Thomas’s reply, which many are now calling one of the most insightful and well-crafted summaries on this alarming issue.
My wife wrote to all Canadian MP’s about our opposition to the Online Harms Bill C-63. MP Rachael Thomas of Lethbridge is the only one who wrote back … It is the best written summary of issues I have seen yet. Long, but here it is…
“Thank you for writing to me regarding Bill C-63, the Liberal’s latest rendition of their online harms legislation.
While the federal government has touted this bill as an initiative to protect children, it does little to accomplish this noble cause, and a great deal to inhibit freedom of speech. Permit me to outline the bill in more detail.
There are four key parts to the bill: Part 1 creates the Online Harms Act; Part 2 amends the Criminal Code; Part 3 amends the Canadian Human Rights Act, and Part 4 amends An Act respecting the mandatory reporting of Internet child pornography by persons who provide an Internet service. I will focus on the first three parts of the bill in the rest of the letter.
Part 1: The bureaucratic arm will consist of three entities: the Digital Safety Commission, Digital Safety Ombudsperson, and Digital Safety Office. These new offices are made up almost entirely of Cabinet appointees and are given powers to receive and investigate complaints concerning harmful content, collect data, and develop more regulations. The Chairperson of the Digital Safety Commission would be voted on by Parliament. The Digital Safety Commission may investigate complaints and hold hearings regarding violations of the Act. The commission may act with the power of the federal court and may authorize any person to investigate compliance and non-compliance.
Penalties for violating an order of the commission or hindering anyone they authorize depend on whether a regulated service or individual commits the violation. The maximum penalty for a violation is not more than 8% of the gross global revenue of the person that is believed to have committed the violation or $25 million, whichever is greater. Cabinet and the Digital Safety Commission can make further regulations concerning the Commission’s powers and financial enforcement (fines).
Setting up a bureaucratic arm will do little-to-nothing to protect children. The last thing our system can handle right now is a stack of new complaints. It can’t even handle the existing ones.
Part 2: Bill C-63 creates a new hate crime offence that will make any offence under the Criminal Code, or any Act of Parliament, an indictable offence and punishable to life in prison if the offence was motivated by hatred. A definition of ‘hatred’ is introduced in s. 319(7), which is defined to mean ‘the emotion that involves detestation or vilification and that is stronger than disdain or dislike.’ s. 319 (8) includes the clarification that the communication of a statement does not incite or promote hatred, for the purposes of this section, solely because it discredits, humiliates, hurts or offends.
Furthermore, the bill increases the punishment for an offence in s. 318 (1), advocating genocide, to imprisonment for life. The current punishment is up to 5 years. The bill also increases the punishments for offences in s. 319 (public incitement of hatred, wilful promotion of hatred, wilful promotion of antisemitism) from up to 2 years to not more than 5 years.
Alarmingly, a peace bond is created for ‘fear of hate propaganda offence or hate crime.’ This will allow a person to seek a court-ordered peace bond if they reasonably fear that someone will commit a hate propaganda offence or hate crime against them in the future. If you’ve watched the movie “Minority Report” you know how scary this is.
Part 3: The bill reinstates Section 13 of the Canadian Human Rights Act, which empowers officials at the Canadian Human Rights Commission and Canadian Human Rights Tribunal to make subjective determinations as to what forms of expression constitute hate speech, and they may also decide on remedies including fines. This will allow any individual or group in Canada to file complaints with the Canadian Human Rights Commission against users who post ‘hate speech’ online, with an accused facing fines of up to $50,000.
The legislation defines hate speech as content that is “likely to foment detestation or vilification of an individual or group of individuals on the basis of such a prohibited ground.” In other words, the content doesn’t necessarily have to directly express vilification; it only needs to be assessed as “likely to” vilify someone by a human rights tribunal. Section 13 is a punitive regime that lacks procedural safeguards and rights of the accused that exist in criminal law. Truth is no defence, and the standard of proof that will apply to Section 13 is “balance of probabilities,” not “beyond reasonable doubt,” as exists in a criminal case.
As you have rightly pointed out, Parts 2 and 3 of this bill are a direct attack on freedom of speech and will have a significant chilling effect as people fear the possibility of house arrest or life in prison. Margaret Atwood has gone so far as to say that C-63 invites the possibility of revenge accusations and the risk of “thoughtcrime.”
Furthermore, its alarming that the bill enables individuals to anonymously file complaints with the Canadian Human Rights Commission against those they deem to be posting hate speech. If found guilty, the Canadian Human Rights Tribunal can impose fines of up to $70,000 and issue takedown orders for the content in question. Additionally, the tribunal is granted the authority to shield the identities of complainants and prohibit defendants from disclosing this information if uncovered. In essence, accusers of hate speech will have their identities safeguarded, while those accused face significant financial penalties.
Common-sense Conservatives believe that we should criminalize and enforce laws against sexually victimizing a child or revictimizing a survivor online, bullying a child online, inducing a child to harm themselves or inciting violence. Criminal bans on intimate content communicated without consent, including deepfakes, must be enforced and expanded. Conservatives believe that these serious acts should be criminalized, investigated by police, tried in court, and punished with jail, not pushed off to a new bureaucratic entity that does nothing to prevent crimes and provides no justice to victims. We will bring forward changes to the Criminal Code that will actually protect children without infringing on free speech.
Thank you again for writing to me, and please accept my best wishes.
Warmest regards,
Rachael Thomas Member of Parliament for Lethbridge”
On her fridge door, along with numerous family pictures, Danielle Brandt has a handwritten quote by Dr. John Trainer: “Children are not a distraction from more important work. They are the most important work.”
A proud Calgary mother of three boys (Aiden, 10, Theodore, 4, and Silas, 2), Mrs. Brandt is a homemaker. Her husband, Adam Brandt, is the breadwinner. At the core of their parenting philosophy is the belief that strong families make strong societies, Mrs. Brandt says.
She was a music teacher before becoming a stay-at-home mom, but when she returned to work shortly after giving birth to her first child, she says she realized she wanted to be fully involved in raising her children.
“The idea that your identity is found at home with your family and not out in the world with your peers, and that your parents and your family are what matters first … that’s the reason I wanted to be home with my children.”
While Mrs. Brandt persists in adhering to her traditional role in the family, there is declining interest among young Canadian women to pursue the same path.
Canadians are “increasingly less likely” to form families, and if they do, they are choosing to have fewer children, if any at all, according to a May 2024 report jointly published by the Macdonald-Laurier Institute (MLI) and the Centre for the Study of Living Standards.
The same report, based on evidence from existing data and literature, found that traditional families enjoy more prosperity and better health.
Adults who are in a couple tend to earn more money per person than singles of the same age and, if married, they tend to live longer, have healthier lifestyles, and are less stressed. Similarly, children benefit from being raised by their two biological parents in a stable marriage, appearing to have a higher standard of living and educational attainment, and being less likely to engage in risky behaviour, the report found.
But a significant fraction of Canadian children will see their families break up by the time they are 14, and more than a quarter live in one-parent families, the report said. The author, Tim Sargent, deputy executive director of the Centre for the Study of Living Standards, concluded that the rates of family dissolution in Canada are higher than those in the United States and the UK, culturally comparable countries.
Janice Fiamengo, a retired University of Ottawa English professor who now gives talks on the role of women in society, says the downward trends in family formation are largely due to how women’s priorities are being redefined in Canada.
“Their primary goal in life is to be independent, to have a career, and to regard marriage and childbearing as secondary, if not undesirable in general,” Ms. Fiamengo told The Epoch Times, describing the trends and messages aimed at young women today.
Trends Among Canadian Women
Women are now taking longer to complete their higher education. From 2000–2022, the participation in education of women aged 20 to 24 rose by 12 percent (to 51 percent), according to Statistics Canada.
Only 37 percent of men in the same age range participated in education in 2022, and that rate grew by just four percentage points since 2000. Similar trends are seen among men and women aged 25 to 29.
Women’s participation in the labour market has also increased dramatically in recent decades, with fewer and fewer women choosing to be stay-at-home moms.
Employment among women aged 25 to 54 has almost doubled from 40 percent in 1976 to about 80 percent as of May 2024, according to Statistics Canada. Employment rates for women in general remain higher than they were prior to the pandemic in 2017 and 2019.
In addition, more women aged 25 to 34 now delay living with their partner. The proportion of those who live with their parents increased by 3.3 percentage points, from 12.8 percent in 2011 to 16.1 percent in 2021.
Marriage rates are on the decline while divorce rates are increasing, and women are waiting until later to have children.
At the same time, Canada’s fertility rate has been declining persistently for the past 15 years, with the national rate hitting an all-time low in 2022 at 1.3 children per woman.
A study by the think tank Cardus found that the top factors that diminish a woman’s desire to be a mother are wanting to grow as a person, wanting to save money, focusing on a career, and believing that kids require intense care.
“Any woman who decides that what she primarily wants to do is to marry and to have children, that woman is seen as having failed, having let down other women, and having failed herself,” says Ms. Fiamengo.
She says the prevalence of feminism in Canada has played a role in shaping these views.
Changing Views on Traditional Family Roles
It wasn’t until the second-wave feminism of the 1980s that an idea with communist roots took hold—the dissolution of the traditional family structure, Ms. Fiamengo says.
Feminism takes many forms and contains different ideas—in the 19th century, it was about women’s suffrage. The idea that the traditional family is at odds with gender equality and women’s fulfilment has its origins in communist ideology.
In his 1884 book titled “The Origin of the Family, Private Property and the State,” Friedrich Engels, based on notes by Karl Marx, made the first allusion to the monogamous family as “the world historical defeat of the female sex,” in which the woman was reduced to servitude and turned into an instrument for the production of children.
He thus advocated for the liberation of the wife, the abolishment of the family, and for the care and education of the children to become a public affair.
“[Engels] explicitly makes that connection, that the man—the patriarch—is the capitalist oppressor. The woman is in the situation of being the oppressed worker or the sex slave in the family,” says Ms. Fiamengo.
“He saw no distinction between prostitution, in which a woman is bought by a man to have her body used for the man’s pleasure, and the situation of a woman in a marriage.”
Betty Friedan’s 1963 book “The Feminine Mystique,” a precursor of feminism as a struggle between genders, urged women to break free from the domestic sphere and find their own identity outside the home. Friedan promulgated that fulfillment could not be found through marriage and motherhood alone.
Ms. Fiamengo says feminism’s lack of encouragement for women to start a family makes them miss out on what she thinks is one of the greatest joys of human life—childbearing.
“The fact that our government doesn’t encourage marriage … or encourage couples to stay together for the good of their children, is doing a terrible disservice to the future generations,” she says.
Peter Jon Mitchell, program director for Cardus Family, says the prevalent view of marriage in Canada is that “it’s nice, but unnecessary.”
“We don’t really talk a lot about marriage and the benefits of marriage in our culture.” Mr. Mitchell also that, compared to the United States, where the two-parent privilege—the fact that children fare better in two-parent rather than single-parent households—and the benefits of marriage are part of the public discourse, Canada lags behind.
The May MLI report cites some studies showing that children in two-parent households fare better. One published by the National Library of Medicine in 2014 found such children do better physically, emotionally, and academically.
Likewise, in a 2015 research paper, David Ribar, honorary professor at the University of Melbourne, found that children who grow up with married parents enjoy more economic and family stability. Mr. Ribar argues that the benefits of marriage for children’s wellbeing are hard to replicate through policy interventions other than those that support marriage itself.
Consequences of Putting Family Role Second
Sociologist Brigitte Berger noted in her book “The Emerging Role of Women” that work is important for both sexes. Yet liberation through work means different things to different people.
To the working-class women and the poor, for whom work is a necessity, liberation means freedom from financial burden and the freedom to devote time to things that matter outside of work, such as family, community, and hobbies. Among women for whom work is not a necessity, modern thinking has led them to find identity and liberation through paid labour.
According to a 2021 survey by the Canadian Women’s Foundation, 28 percent of mothers reported difficulty keeping up with work demands, and half of mothers felt exhausted trying to balance work and childcare responsibilities.
“I think most mothers would prefer to be part-time,” says Mrs. Brandt. “They don’t actually want to leave their kids 100 percent of the time with someone else.”
She says the widespread notion that women can do it all is not realistic and can lead many to burnout. “I can’t fully parent my children well and fully do another job [outside the home], at least not the way I want to,” she says. “Something has to give; there’s not enough of me.”
Mrs. Brandt says she is not worried about her chances of returning to work at some stage.
“We live a long time nowadays. You can’t always have kids, you can’t always be with your kids when they’re young or get that time back when they’re young,” she adds. “But you could do a career later, and that’s the amazing thing about our culture, too.”
Last year, a study by the think tank Cardus found that half of Canadian women are not having as many children as they would like, and that this group reported lower life satisfaction than women who achieved their fertility goals.
Cardus senior fellow Lyman Stone noted low fertility rates are not because women want few kids, but the timeline most of them follow for school, work, self-development, and marriage leaves too few economically stable years to achieve the families they want.
One of the most striking findings of the May MLI report is that Canada has seen a marked deterioration in the mental health of young women over the last decade.
More than three-quarters of women aged 15 to 30 reported excellent or very good mental health between 2009 and 2010. Throughout the following nine years, that figure dropped 22.5 percentage points, to 54 percent. For women aged 31 to 46, mental well-being also declined, but only by 10.1 percentage points.
Source: Canadian Community Health Survey, 2003 to 2019. (Chart: Carolina Avendano/The Epoch Times)
Motherhood and Women’s Happiness
A Cardus 2023 study concluded that women’s happiness and fertility are linked. The think tank surveyed 2,700 women aged 18 to 44 about family and fertility, and found that mothers are happier than non-mothers everywhere (except when they are under 25 or living in poverty).
“The role of the mother really is to nurture and to develop children,” says Mrs. Brandt. “My husband is a wonderful nurturer, he’s fantastic at it, but my boys, even the ones that have the closest relationship with him, they still need mom … I’m still the safe place.
“I am not saying that men can’t do it, but sometimes women are built for it, and there’s nothing wrong with that.”
Danielle Brandt with her youngest son, Silas, at her Calgary home on June 1, 2024. Mrs. Brandt homeschools her oldest son, Aiden, because she saw he was falling behind in class. Seeing the positive response, she now plans to also homeschool her other two children. (Carolina Avendano/The Epoch Times)
She draws inspiration from her mother, who was also a teacher turned homemaker. Mrs. Brandt says her mother was always available for her and her three siblings, and would show up at their most important moments, including sporting events, school functions or field trips. “We felt like we were the priority because we were,” she says.
But being a stay-at-home mom is also demanding, Mrs. Brandt adds. Although it’s rewarding, she says the challenge is that there is no time off. “But at the end of the day, when I look at my children and see them peacefully sleeping, [I think to myself] ‘That’s it, that’s what this is about,’” she says. “They are the future generation. I want to pour into that, and there is no more valuable work than that.” For the Silo, Carolina Avendano.
Featured image- Danielle and Adam Brandt with their sons Silas (L), Aiden (C), and Theodore at their home in Calgary on June 1, 2024. (Carolina Avendano/The Epoch Times)
About 14 percent of Canadians aged 12 and older – approximately 4.6 million people – did not have a regular health-care provider in 2022, according to Statistics Canada. Even more alarming, about 6.6 million Canadians rely on family doctors aged 65 and over, meaning that even more people could soon find themselves adrift as their physician retires.
Canada has the highest number of general practitioners per capita among comparator countries, yet ranks worst in terms of having a doctor or a regular place for medical care (only 86.2 percent of surveyed Canadians had one in 2023).
What is happening?
Several factors are at play.
First, it’s no secret that the physician workforce, much like the rest of our population, is aging. There aren’t enough new graduates to replace retiring physicians and meet the needs of a growing population. [Canada currently has one of the highest Immigration rates in the world with rates growing steadily and currently sit at around 1.2% population increase each year. CP]
Moreover, physicians have been spending fewer hours on direct patient care. Administrative tasks, such as paperwork for insurance claims, sick notes, and duplicate form requests from different organizations, consume approximately 18.5 million hours of physician time annually in Canada, equivalent to 55.6 million patient visits. Economic and cultural factors are also steering medical trainees towards specialties rather than general family practice. Without changes, the gap between the supply and demand for family physicians will only widen.
My recent C.D. Howe Institute analysis shows that under a normal retirement scenario – where 57 percent of family physicians aged 75 and over retire – the projected supply of family physicians in 2032 will meet 90 percent of the demand. If all family physicians aged 75 and over were to retire, only 78 percent of projected demand would be met, leaving us 13,845 family physicians short.
This means that about 9.6 million Canadians could be without a family physician in the next decade. The consequences of this shortage could be dire, leading to delayed or inadequate care, increased costs, and a strain on other parts of the healthcare system.
With only about 1,550 family physicians completing residency in 2022, the current pipeline of graduates is insufficient. What needs to be done?
Increasing numbers is essential, but will not suffice to meet the demands of a growing and aging population. We need a comprehensive strategy, and five well-established strategies can help.
First, we need to increase the number of training positions for prospective family doctors and accelerate pathways for international medical graduates to enter family medicine, whether direct-to-practice or through residency positions.
Second, administrative processes need to be streamlined to reduce family physicians’ unnecessary workload, freeing more time for direct patient care.
Another strategy is to introduce payment models such as capitation or bundled payments that better support family physicians, making family practice more attractive and encouraging more patient enrolment and after-hours care.
As well, allowing other primary-care providers, such as nurse practitioners and pharmacists, to take on a broader range of responsibilities could assist with sharing the workload and improving patient access.
Finally, developing and expanding team-based models of care that bring together health-care professionals to provide comprehensive and continuous patient care could also benefit Canadians.
The good news is that some of these steps are starting in some provinces.
Nova Scotia is advancing on all fronts; creating a new designated pathway to residency for international medical graduates; committed to reducing physician red tape by 80 percent by 2024; is a leader in paying family physicians with alternate payment; introduced pharmacist-delivered primary care for 31 minor ailments; and expanded team-based care at new and existing locations. Similarly, British Columbia and Ontario have made notable advancements in several of the five strategies.
Improving primary-care access is a nationwide challenge that requires concerted efforts and innovative solutions. By learning from the policies and experiences of different provinces, Canada can develop and implement effective strategies to ensure every Canadian has access to a family physician and the primary care they need. Canada’s health-care system – and the health of its people – depends on it.
For the Silo, Tingting Zhang -Junior Policy Analyst at the C.D. Howe Institute.
June,2024 – Lengthy delays and regulatory uncertainty is deterring investment in major infrastructure projects in Canada, according to a new report from the C.D. Howe Institute. In “Smoothing the Path: How Canada Can Make Faster Major-Project Decisions”, authors Charles DeLand and Brad Gilmour find that Canada’s regulatory approval process is creating high costs for investors and preventing critical projects in hydrocarbon production, mining, electricity generation, electricity transmission, ports and other infrastructure from being built.
Sectors that have historically driven business investment and productivity in Canada—mining, oil and gas—are most affected by complex regulatory procedures.
While investments in these sectors have supported high incomes for workers and high revenues for government in the past, they are now trending downwards. “Canada is struggling to complete large infrastructure projects in a reasonable time frame and at a reasonable price and the proposed amendments to the Impact Assessment Act (IAA) are insufficient,” says Gilmour.
Canadians have been debating whether Canada’s regulatory and permitting processes strike the right balance between attracting investments in major resource projects and mitigating potential harm from those investments.
These regulatory processes typically apply to complex and expensive projects, such as mines, large hydrocarbon production projects (oil sands, liquefied natural gas [LNG], offshore oil), electricity generation (hydroelectric dams, nuclear), electricity transmission (wires), ports and oil or natural gas pipelines. These projects often involve multiple levels of jurisdiction and can prove particularly slow to gain government approval.
Canada struggles to complete large infrastructure projects, let alone cheaply and quickly. We propose improving major project approval processes by: (a) ensuring that provincial and federal governments respect jurisdictional boundaries; (b) leaving the decision-making to the expert, politically independent tribunals that are best positioned to assess the overall public interest of an activity; (c) drafting legislation with precision that focuses review on matters that are relevant to the particular project being assessed; and (d) confirming the need to rely on the regulatory review process and the approvals granted for the construction and operation of the project.
Did you know that Canada’s five biggest banks are among the 20 largest fossil fuel financiers in the world?
Since the Paris Agreement was signed in 2015, they have invested over$900 billion into the fossil fuel industry. This means that your hard-earned dollars are being invested in projects that make it impossible to meet Canada’s climate targets. While not well known, the financial sector is the missing piece in ensuring a climate-safe future.
Last week, the CEOs of Canada’s top 5 banks were in Ottawa testifying about their role in the climate crisis. Environmental Defence was on the front line of this critical moment. We were invited to testify in this important study and use our expertise to advise policy solutions to align our financial system with climate action.
Canada can only keep a safer climate if finance aligns with climate action, and new rules from the government would help make that happen. And, we are creating public awareness of the issue and mobilizing Canadians to speak up by writing letters and attending rallies- increasing the pressure on the federal government to take action.
At a time when climate-fueled disasters (such as wildfires, droughts and floods) are rising, it’s ludicrous that Canadian banks are allowed to fund oil and gas industries at a rate of over $100 billion per year. We will be watching future proceedings closely. And, we will continue to push the federal government to ensure that Canadian banks are helping, not hindering our climate goals. For The Silo, Alex Walker. Program Manager, Climate Finance for Environmental Defence.
Many people are surprised to learn that for seventy-five years and counting, Russian aircraft regularly enter Canada territory. For example, on September 11, 2022, the North American Aerospace Defense Command (NORAD) detected, tracked and positively identified two Russian maritime patrol aircraft entering and operating within the Alaskan and Canadian Air Defense Identification Zones (ADIZ).
photo: DND
NORAD and USNORTHCOM are Canadian and the American bi-national military commands charged with three missions in the defense of North America: aerospace warning, aerospace control, and maritime warning.
The Russian aircraft remained in international airspace and did not enter American nor Canadian sovereign airspace.
Contrary to how you may feel about it, Russian activity in the North American ADIZ (Air Defense Identification Zone) is not seen as a threat nor is the activity seen as provocative. NORAD tracks and positively identifies foreign military aircraft that enter the ADIZ, and routinely monitors foreign aircraft movements and as required, escorts them from the ADIZ.
THULE AIR BASE, Greenland —Thule’s ballistic missile early warning radar
The radar is operated by the 12th Space Warning Squadron, a geographically-separated unit of the 21st Space Wing. This upgrade completes another step toward a fully-operational missile defense system for the United States and Canada and friends and allies.
NORAD employs a layered defense network of satellites, ground-based radars, airborne radar and fighter aircraft to track and identify aircraft and inform appropriate actions. We remain ready to employ a number of response options in the defense of North America and Arctic sovereignty.
Canada’s North Warning System Radar Sites. image:cbc
Aside from Thule Air Base, Greenland, and other Alaskan air bases, defensive operations are also based out of Canadian Forces Station Alert, Nunavut; Whitehorse, Yukon; Yellowknife, Northwest Territories; 17 Wing/Canadian Forces Base Winnipeg, Manitoba; 22 Wing North Bay, Ontario and 5 Wing Goose Bay, Newfoundland and Labrador.
The expanded Canadian Air Defence Identification Zone (CADIZ).
Another operation saw Canadian CF-18 fighters operating from northern airfields to intercept aircraft role-playing as threats. Fighter aircraft were supported by Royal Canadian Air Force and United States Air Force KC-135 air-to-air refuelers.
The monitoring and control of North American airspace remains a primary mission focus area for NORAD. The command maintains robust air defense capabilities to execute the airspace mission over the continental U.S., Alaska and Canada.
General Glen VanHerck
“Exercising in the Arctic allows us to demonstrate our resiliency and advance our operational capabilities that are critical for integrated deterrence and layered defense,” said General Glen VanHerck, NORAD/USNORTHCOM commander. “The men and women of NORAD, in Canada and the United States, remain steadfast in our sacred obligation of deterring threats, and if required, defending North America.”
An increasing number of Canadians can’t afford a house or find a decent-paying job. Some can’t find a date or are fed up with the bitter politics, while others are in search of adventure, are sick of the cold winters, or simply miss the feeling of ‘being home’.
The solution they seek? Leave Canada.
The rising cost of living, record-high immigration, a stagnating economy, and political tensions are prompting rising numbers of Canadians—both native and naturalized—to leave the country.
Canada is increasingly becoming a country of emigrants, as well as a country of immigrants, experts say.
“We’re definitely seeing a lot more interest from people wanting to leave Canada,” Michael Rosmer, founder of Offshore Citizen, a Dubai-based company that offers relocation services to people around the globe. “This is disproportionate to their numbers overall.”
He said many of his clients are motivated by the increasing ability to work from anywhere, plus political tensions within Canada accompanied by a feeling of lost freedoms. Also a factor is the rising standard of living of many countries that were once far below Canada in terms of health care, education, and other services.
While Canada was once considered among the best places in the world to live, “it’s like the world has flipped,” Mr. Rosmer said. “The alternatives have gotten meaningfully better. Today if you go to Kuala Lumpur you’re going to find that it is arguably better than any Canadian city.”
Some 94,576 people emigrated from Canada from mid-2022 to mid-2023, an increase of 1.8 percent from 92,876 in the year-earlier period, and up sharply from 66,627 in the period from mid-2020 to mid-2021, which fell during the pandemic lockdowns, according to data from Statistics Canada.
A study released last year by the immigration advocacy group Institute for Canadian Citizenship (ICC) showed immigrants are also increasingly reluctant to stay, with the proportion who stick around to obtain full citizenship within 10 years of receiving permanent resident status plunging to 45.7 percent in 2021 from 60 percent in 2016 and 75.1 percent in 2001.
Cameron MacDonald, a 29-year-old from the Niagara Falls region of Ontario who left Canada in March for Japan, cited the high cost of living as the main reason for his move, which uprooted him from friends, family, and a job as an anti-fraud analyst with a major Canadian bank. He is now studying Japanese and looking for a job with a foreign firm, while living in Tokyo, which has a population density of 6,363 people per square kilometre compared to Toronto’s 4,427.8 per square kilometre.
“Here in Tokyo, the world’s biggest city, I pay $650 a month for a room that I would have had to pay $2,000 for in Toronto.” I had a routine and a cushy bank job and I was even living with my dad after a while but I still couldn’t get ahead financially.”
He said the high cost of housing in Toronto means that all of his friends of a similar age in Canada are still living with their parents and, as many of them consider starting families, they are watching his move with the thought of moving abroad themselves.
“My five-year goal includes a wife, a house, and kids and there’s no way I could afford that in Canada,” Mr. MacDonald said. “You can’t really date and find a wife when you’re living with your dad.”
“In Japan, I wake up with a smile on my face every day,” he said. “It’s like I have found a new passion—I can start a family here.
High Immigration
Like many people, Mr. MacDonald blames Canada’s rapid pace of immigration for driving up the cost of living and forcing him to move abroad.
As of Oct. 1, 2023, Canada’s population was estimated at 40,528,396, a record increase of 430,635 people in the previous three months alone, according to Statistics Canada. That growth rate, at 1.1 percent in a quarter, was the highest since 1957, amid Canada’s baby boom plus an immigration surge fueled by a refugee crisis in Hungary at the time.
In just the first nine months of last year, Canada’s population grew by 1,030,378 people, more than any other year dating back to confederation in 1867, the statistics show. And 96 percent of that growth came from immigration. Overall, the population grew 30 percent since it reached the 30 million figure in 1997.
Canada’s Plan to Welcome 500000 Immigrants by 2025. ascenda.com
Indeed, rapid population growth has outstripped economic growth in recent years, lowering the standard of living in Canada as more people compete for less housing space and place greater strains on health care, education, and other services, according to a study published in May by the Fraser Institute. The study shows Canada’s real gross domestic product per person dropped 3 percent between April 2019 and the end of last year, from $59,905 to $58,111. The only steeper drops in the 40 years covered by the study were from 1989 to 1994, with a decline of 5.3 percent, and the financial crisis of 2008 to 2009, when it dropped 5.2 percent.
Another factor propelling emigration may be the aging of the baby boomer generation. As more Canadians reach retirement age, emigration to the United States, particularly to sunny states such as Florida, is accelerating.
A study by Statistics Canada also shows that high immigration tends to push up emigration because some immigrants move back to their home country. The study showed that 15 percent of the people who immigrated to Canada between 1982 and 2017 returned within 20 years of admission.
Whatever the root cause, the interest in leaving Canada has caught the attention of the global industry of specialists offering services to wealthier emigrants around the world.
Videos created by people seeking to offer second-passport services and other relocation help are growing in popularity. “Nine Steps to Escape Canada,” a YouTube video watched 362,000 times, “5 Reasons to Leave Canada in 2024,“ watched by 261,000 and ”Canada is Dying!,” with 531,000 viewers are some of the most popular.
Jay Suresh, the founder of Goodlife Investor, which offers emigration services to people around the world looking to obtain second passports, foreign tax advantages, and other benefits, says the number of Canadians looking for dual citizenship jumped after the Canadian government banned unvaccinated people from flying or travelling by train in late 2021 until the summer of 2022.
“This was an eye-opener for a lot of people. They got frustrated with just that one citizenship and they wanted multiple citizenships,” he said in a video promoting his company. Now, he says, Canadians are nearly tied with U.S. citizens in searches for second passports, even though the United States has 10 times Canada’s population. For the Silo, Adam Brown.
Featured image: People line up to go through security screening at Pearson International Airport in Toronto on Aug. 5, 2022. (The Canadian Press/Nathan Denette)
With the Canadian government’s high debt-to-GDP ratios, such as a ratio of debt to nominal GDP sitting at 68 percent in March 2023, economists warn that government debt could become unsustainably high if Ottawa fails to reduce spending, increase productivity, and re-establish business confidence.
“We’re not growing our income per capita, which means that we’re not going to get the tax revenues that we need, plus we’re getting a lot of people retiring. So the situation could end up becoming quite unmanageable if we keep our pace that we’re going,” said Jack Mintz, president’s fellow at the University of Calgary’s School of Public Policy.
The federal government has run back-to-back budget deficits since the 2008 financial recession, with government spending spiking during the COVID-19 pandemic. As a result, Canada’s debt as a percentage of nominal GDP rose from around 51 percent in 2009 to 74 percent by 2021, for example. Nominal refers to the current value for the particular year without taking inflation into account.
The two previous federal budgets have attempted to lower government spending, but the federal government will still post a $40 billion deficit in 2023–24, which they project will shrink to a $20 billion deficit by 2028–29.
The Liberal government’s response to criticism by the opposition that Canada’s debt could lead the country into a financial crisis has been that Canada has among the best debt-to-GDP ratios in the G7.
According to Mr. Mintz, while Canada’s debt situation is not as bad as it once was, it doesn’t mean that it may not impact Canada’s prosperity prospects.
Mr. Mintz points out that Canada’s debt situation is not nearly as bad as in 1996. The government’s ratio of debt to nominal GDP ratio reached 83 percent that year.
Mr. Mintz also noted that Canada continues to have a triple-A credit rating according to the world’s leading credit agencies, meaning the country’s debt is not yet seen as problematic.
“We’re still viewed as having a much better credit line compared to a number of other countries. … But at some point, the credit agencies might look at that gross debt number and start asking the question, ‘Is it starting to become unsustainable?’” he said.
Lower Productivity Hampering Debt Payments
The federal government’s ability to pay off its debt could be hampered by low productivity, according to Steve Ambler, professor emeritus of economics at Université du Québec à Montréal.
“The thing that worries me in terms of federal government debt is we are currently in a period of extremely low productivity growth and low overall growth,” he said.
In March, the Bank of Canada’s senior deputy governor Carolyn Rogers warned that Canada’s poor productivity had reached emergency levels.
Although Statistics Canada said the country’s labour productivity showed a small gain at the end of 2023, that came after six consecutive quarters of productivity decline.
The right honourable Jean Chrétien.
Mr. Ambler said an appropriate way to lower the debt-to-GDP ratio is to keep government spending from increasing while also raising productivity to increase tax revenues. He said this was the strategy of Prime Minister Jean Chrétien, whose Liberal government established a budget surplus in three years by growing the economy and keeping government spending stagnant.
To lower Canada’s debt-to-GDP ratio, Mr. Ambler said the government should focus on increasing worker productivity, allowing its resource sector to grow, and easing back on discretionary spending.
He also cited a November 2023 C.D. Howe paper showing that business investment per worker in Canada has shrunk relative to the United States since 2015. Investments such as better tools for workers would increase productivity, while productivity growth would in turn create opportunities and competitive threats that spur businesses to invest, the paper said.
“Re-establishing business confidence would be almost the number one priority, especially in the resource sector,” Mr. Ambler said, adding that a future government might also be wise to lower the feds’ “wildly extravagant subsidy programs” for the electric vehicle (EV) sector.
The Liberal government has given tens of billions of dollars in subsidies for EV manufacturing projects in Canada since 2020, saying the factories will eventually create thousands of new jobs.
‘No Cushion’ to Mitigate Debt Issue
Joseph Barbuto, director of research at the Economic Longwave Research Group, has a more pessimistic view of Canada’s debt. He says that while federal debt is at levels similar to the 1990s, the crisis will be “larger” because the government does not have the “fiscal room to mitigate the downturn.”
Mr. Barbuto said that while the Canadian government was able to help alleviate its debt issues in the 1930s and 1990s by lowering its interest rates, it does not have that same luxury in 2024. The Bank of Canada lowered its key policy rate from 1.25 percent to 0.25 percent in 2020, and was forced to raise it to 5 percent by 2023 in response to rising inflation.
“There’s no interest rate cushion on the other side. Interest rates can only fall back to zero,” Mr. Barbuto said, noting that higher interest rates make it more difficult for governments to service their debt.
“The problem with the monetary system is there’s no fiscal discipline that is pushed on governments, unlike [individuals] or corporations,” he said.
“There will be a point where because of the accumulated interest with rising interest rates, eventually it’s going to overwhelm the government and then people will not lend the government any kind of capital.”
Mr. Barbuto also expressed concern over Canada’s private debt-to-GDP ratio. Private debt refers to debt owed by private, non-financial entities such as businesses and households, as opposed to public debt owed by governments and banks. Canada’s ratio of private debt to nominal GDP sat at 217 percent in December 2023 compared to 124 percent in 1995.
Mr. Barbuto said Canada’s private debt-to-GDP ratio is higher than that of Japan’s in the 1990s, and pointed out that the Japanese economy had stagnated after the country’s asset price bubble burst in 1992.
The research director believes the Canadian economy will eventually see a debt crisis and collapse in real estate that will result in austerity measures, a shrinkage in the size of government, and the “creative destruction” of the old political and economic system. He said this would be the continuation of an economic cycle that has repeatedly happened throughout history.
“[It’s] inevitable and necessary. A debt detox or deleveraging is the same thing as a drug detox. Nobody likes it, … but it’s a necessary part of the cycle for it then to go back up,” he said.
Paul Jenkins – The West and a Workable New World Order?
From: Paul Jenkins
To: Global governance observers
Date: May 2, 2024
Re: The West and a Workable New World Order?
One can describe the so-called liberal world order as a set of ideas for organizing world democracies. While openness and trade, rules and institutions, and co-operative security have been the principles that have shaped the liberal order, it also required sovereign nation states to provide the foundation for the creation and development of a system of intergovernmental organizations, or system of global governance.
In the aftermath of the Second World War, the system was designed primarily for the advancement, economically and politically, of Europe and the United States. Yet since 1945 the liberal world order has evolved, giving impetus to the steady increase in global economic integration to the benefit of many nations and people.
Advances in science and technology have been critical to the evolution of the liberal order, but there has also been a need for the structures of global governance to evolve and keep pace.
On the economic front, for example, the collapse of the Bretton Woods system of fixed exchange rates, following Richard Nixon’s 1971 decision to abandon the dollar’s link to gold, gave rise to the creation of the G7. And the Asian Crisis of 1999 led to the creation of the G20.
Throughout the entire postwar period, however, tensions inherent between the sovereign authority of the nation-state and the need for collective global governance increasingly challenged the liberal order.
Indeed, the advent of the Cold War led to the liberal world order becoming hegemonic, organized around the economic and political strength of the United States with its dominance of global governance through the various institutions making up the global governance system.
But over the years, pushback took hold. As the benefits of global economic integration spread and the United States was no longer the singular engine of growth, both democratic and autocratic countries found voice and began to resist the principles that shaped the liberal order. Even core nations of the liberal order began to voice their concerns in the aftermath of the Global Financial Crisis as the market-based financial system failed to self-regulate (as had been advertised), and as the liberal order proved unable to provide social protection for those adversely affected by globalization.
Effectively, a new world order began to unfold, with the resulting slowing and even fragmentation [DS1][PJ2] of global economic integration.
At the same time though, virtually all nations, regardless of regime or stage of development, are facing the same challenges: Financial instabilities, rising inequality, weak productivity growth, climate change, spread of infectious disease, AI, cyber security and on and on.
These vulnerabilities represent global risks that can only be tackled and minimized through collective action. This in turn requires a new world order that treats the world as it is, not how we wish it to be.
What does this mean for the West, and in particular the United States and Canada?
The unique advantages of the United States are its open society, fair and law-based market economy, and allure for talent from around the world. To sustain these advantages, maintaining its wealth and its position as the centre of the free world, it cannot close its doors to further global economic integration.
Geopolitically, what might this look like?
John Ikenberry argues that the answer can be found in the principles of sovereignty, territorial integrity, and non-intervention of the Westphalian system, the 1648 treaties that ended the Thirty Years’ War and established the modern nation state. The key insight of the Westphalian system is that all countries are vulnerable to the same global risks. The leap forward in mindset that is required is the acceptance that states are the rightful political units of legitimate rule.
For the West, and the United States in particular, this implies the need to accept these new realities, and in so doing, the need to work together to build a new world order that preserves their liberal democratic values, and those of its allies, while at the same time recognizing that the economic challenges they face are not unique to them.
The unfolding relationship between the United States and China will define whether we achieve a workable new world order.
The economic incentives are there for this to happen.
For China, the incentive is further progress in closing both its internal income gap as well as the gap between itself and the developed world. The payoff would be setting in place the foundation for a sustained rise in living standards for all its citizens.
For the United States, the incentive is in preserving its strength as an open society and its vision of the world that has considered the interests of others. In many respects, it remains uniquely capable of playing the central role in sustaining the global economic system.
The challenge in re-imagining such a new world order is geopolitical. The task is to renew global governance with today’s realities in sharp focus.
Paul Jenkins. Mister Jenkins is a former senior deputy governor of the Bank of Canada and a senior fellow at the C.D. Howe Institute.
May, 2024 – Many of the federal government’s recent reforms in competition law sensibly strengthen the enforcement powers of the Competition Bureau and private actors seeking redress for allegedly anti-competitive behavior. However, amendments to the Competition Act that simply make it easier to meet legal tests for orders against allegedly anti-competitive conduct are over-reach, says a new report by our friends at the C.D. Howe Institute.
In “Uncertainty and the Burden of Proof in Canadian Competition Law,” author Edward M. Iacobucci, a professor in corporate and competition law at the University of Toronto and Competition Policy Scholar at the C.D. Howe Institute, says that while strengthening the enforcement powers of the Competition Bureau is welcome, other amendments to the Competition Act imply more profound changes to the fundamental posture of competition law.
Specifically, there is a family of amendments and proposals to move away from the bedrock principle that the burden rests with the Bureau to prove, on a balance of responsibilities, that a merger or practice by a dominant firm is likely to be or is anti-competitive.
For example, the author argues that lowering the burden of proof in mergers cases to “appreciable risk” of anti-competitive effects or something analogous would be a mistake.
“The overwhelming problem with this standard is that it is too easy to meet and fails to distinguish anti-competitive from benign conduct,” he states. He also disagrees with proposals to rely on market shares rather than competitive assessments in mergers cases. He objects in addition to abolishing the requirement to analyze anti-competitive effects in abuse of dominant position cases – recent amendments imply that pro-competitive conduct could be treated as an abuse of dominance.
Aside from competition law reform, the author notes that there are other policy reforms that could promote competition.
“Assuming competition has worsened in Canada, there are several remedial policies that I suspect would be far more important than competition law reform,” he says. “The OECD ranks Canada near the worst internationally in establishing regulatory barriers to competition.”
Regulation, internal trade barriers, restrictions on international competition and ownership, and other policies are all important contributors to reducing competition in Canada and, certainly in their collective impact, are more important than competition law, he argues.
Nevertheless, there are good reasons to take stock of Canadian competition law.
“The vulnerability of digital markets to market power stemming from network externalities and scale economies encourages reflection on whether the Competition Act continues to be suitable for present times.”
“I am skeptical of the narrative that the law requires sweeping reform to address the digital economy or to reverse a strong, secular decline in competition caused by competition law,” Iacobucci added. “But I am not skeptical that there is room for improvement. I encourage the government to focus on strengthening enforcement and to resist and even reverse recent reforms to the burden of proof.”
For The Silo, Edward M. Iacobucci, TSE Chair in Capital Markets, Faculty of Law, University of Toronto and C.D. Howe Competition Policy Scholar.
• There are good reasons to take stock of Canadian competition law. The vulnerability of digital markets to market power stemming from network externalities and scale economies encourages reflection on whether the Competition Act continues to be suitable for present times.
• Recently, a number of statutory amendments have been proposed to amend the Act, some have been tabled in Parliament and still others already adopted. The federal government recently passed consequential amendments that grant the Minister of Innovation, Science and Economic Development (ISED) the power to initiate market studies, to include scrutiny of vertical agreements as possibly anti-competitive collaborations, to repeal the efficiencies defence to mergers, and to lower the burden of proof in abuse of dominance cases.
• Many of the government’s actions to date sensibly strengthen the enforcement powers of the Competition Bureau and make it easier for private actors seeking redress for allegedly anti-competitive behaviour.
• There are, however, other actual and proposed amendments that imply profound changes to the fundamental posture of Canadian competition law. In particular there are actual and proposed amendments that move away from the bedrock principle that the burden rests with the Bureau to prove, on a balance of probabilities, that a merger or practice by a dominant firm is likely to be or is anti-competitive.
• While enhancing enforcement is welcome, legislative amendments that lower the burden of proof are a mistake.
Spring means fresh flowers and sunny days, but it also brings seasonal health issues as the weather gets warmer: from Rosacea to Lyme disease.
Most likely, you or someone you know has been affected by Lyme disease, the most common tick-borne illness in North America with more than 300,000 cases diagnosed each year. In a timely new book, Conquering Lyme Disease(Columbia University Press), Columbia University Medical Center physicians Brian A. Fallon and Jennifer Sotsky reveal that despite the challenges to find a cure for this complex, debilitating disease, precision medicine and biotechnology are accelerating the discovery of new tools with which doctors will be able to diagnose it and treat patients.
“Through rapid genetic sequencing, scientists can identify many different strains of Borrelia burgdorferi as well as new tick-borne microbial infections, such as Borrelia miyamotoi, Borrelia mayonii, and the Heartland virus.” — Brian Fallon
Could groundbreaking technologies that rapidly increase our understanding and open up new pathways mean a cure for Lyme disease one day soon? The Global Search for Education is pleased to welcome Dr. Brian Fallon to find out how tech is tackling the ticks.
“Modern technology using Next-Generation Sequencing (NGS) allows one to discover with great rapidity all microbes that may be present within a sample of fluid.” — Brian Fallon
Brian, how has technology improved the research process for tick borne diseases?
Consider the difference in price of genome sequencing between 20 years ago and today. In 2003, it had taken the Human Genome Project about 4 years and costs estimated between $500 million to 1 billion…by 2006 the cost for sequencing a single human genome had dropped to 14 million……today a whole human genome can be sequenced within days for less than $1,000. This is a tremendous advance.
Why is genome sequencing so important? Let’s look at human tick-borne diseases. When two different people are infected with Borrelia burgdorferi (the microbe that causes Lyme disease), one will resolve the disease quickly after a course of antibiotics while the other may develop a chronic relapsing remitting illness. Why? Because one person might have gotten a more persistent strain, while the other received a less invasive strain that stays localized to the skin. Additionally, the genetic differences in the human determines how the immune system responds to the invading microbe. Understanding the genetics of the infection and of the human host allows scientists to unravel the mysteries of tick-borne illnesses.
Through rapid genetic sequencing, scientists can identify many different strains of Borrelia burgdorferi as well as new tick-borne microbial infections, such as Borrelia miyamotoi, Borrelia mayonii, and the Heartland virus. When the genome of a microbe is sequenced, it provides a starting point for the study of pathogenesis, vaccine development, and treatment. Discovery of these new microbes inside ticks has been enormously helpful. A patient who has had typical symptoms of Lyme disease after a tick bite but has tested negative on the blood tests for Lyme disease might puzzle clinicians. They may criticize the insensitivity of the Lyme disease tests. However, when this same patient is tested for the newly discovered tick-borne infection, Borrelia miyamotoi, the diagnosis is then clear. Yes, the patient had a Lyme-like illness, but it wasn’t Lyme disease: it was Borrelia Miyamotoi disease.
Modern technology using Next-Generation Sequencing (NGS) allows one to discover with great rapidity all microbes that may be present within a sample of fluid. This “discovery based” approach using “unbiased next generation sequencing” enabled a 14 year old boy to be rescued from a fatal infection within 48 hours (Wilson et al, NEJM, 2014). This boy had endured 3 hospitalizations over 4 months, had over 100 diagnostic tests, spent 44 days in an ICU for encephalitis of unknown etiology, had a brain biopsy, and had to be put into a medically induced coma to prevent damage from his ongoing seizures.
Eventually Dr. Charles Chiu at U.C.S.F. employed NGS analysis of more than 8 million sequences with a bioinformatics pipeline (SURPI) for the detection of all known pathogens. The cause of the boy’s meningoencephalitis was revealed as Leptospira santarosai. He had likely acquired it in Puerto Rico, as it is not present in the continental United States. He received the appropriate antibiotics and was discharged 2 weeks later to rehab. This same approach is especially useful for uncommon infections as they might not be suspected; for example, rare tick-borne viruses such as Powassan Virus or Heartland Virus can be rapidly detected using this discovery approach.
DNA Double Helix
How has big data impacted the way advocacy groups support research?
A patient-generated source of Big Data is LymeDisease.org. This California based organization developed a survey called “My Lyme Data” that patients could fill out on the web about their clinical history and lab tests and treatments. In a short period of time, they had data on 10,000 patients whom they track over time. With this information, they provide a more comprehensive clinical view of the bulk of patients who are diagnosed with persistent symptoms despite treatment for Lyme Disease (aka Chronic Lyme Disease).
“In geographic areas where medical professionals are scarce, AI technologies will play an increasing role in improving patient care by allowing differential diagnoses to be generated and treatment options suggested through AI-based systems accessed through the internet.” — Brian Fallon
Jobs in all professions are being automated. Do you believe AI technologies will only assist doctors or will they replace physicians in some tasks? What does this mean for doctors, nurses, and the future of medicine?
Borrelia
While AI technologies will go a long way to assist health care providers to provide better care, its application to medical care is still just beginning. One can anticipate, however, that in geographic areas where medical professionals are scarce, AI technologies will play an increasing role in improving patient care by allowing differential diagnoses to be generated and treatment options suggested through AI-based systems accessed through the internet.
The general public has more access to information than ever before about Lyme disease from websites, medical organizations, articles and social media. Everyone can be their own “expert” or even their own “doctor.” Can you speak about the pros and cons of online health data in the era of fake news?
This obviously is a huge area of concern. Individuals used to turn to their physician or to the medical information books, such as the Merck Manual. Now, they turn to the web.
In a recent survey of patients who used the web to obtain health information (Doherty-Torstrick 2016), we learned that more than half of the 730 patients reported they experienced increased distress as a result of checking the web. We also learned from this survey that individuals who did not have a health education were more likely to spend more time on the web and were thus prone to develop more anxiety than those who were better educated from a health perspective. While some of the information they find may be accurate, other information may be well-intentioned but ill-informed, misleading, and even harmful.
“Researchers can rapidly screen thousands of drugs to determine which agents have the strongest ability to kill Borrelia spirochetes. This is possible because of the development of high throughput assays, which have proven more effective than the standard agents in eradicating both the stationary phase Borrelia and its more drug-tolerant persister-forms.” — Brian Fallon
Look into the future. What are the technologies you are most excited about in terms of helping to find cures for Lyme disease and improve patients quality of life?
Researchers can rapidly screen thousands of drugs to determine which agents have the strongest ability to kill Borrelia spirochetes (Feng 2014). This is possible because of the development of high throughput assays, which have identified new antibiotics that have proven more effective than the standard agents (doxycycline, amoxicillin) in eradicating both the stationary phase Borrelia and its more drug-tolerant persister-forms. While it cannot be assumed that what is true in the lab setting will translate to efficacy in humans, biotechnology advances have enabled the identification of new therapeutic agents, offering much hope for a wider array of treatment options for patients in the future.
Another major advance is “big data” conducted by biomedical information engineers trained in biostatistics and computer science. Internet search engine queries are being monitored to predict outbreaks of infectious disease. Unanticipated side effects of drugs and their interactions can be detected through analyzing millions of digital medical records from patients who have taken a particular drug. One can examine whether patients given an antibiotic did better when treated for longer or shorter periods, or whether patients with a pre-existing autoimmune disease are more likely to develop complications from a new onset Tick-borne infection than those without a history of autoimmune problems.
2005 James Gathany; William Nicholson The blacklegged ticks, I. pacificus, (depicted here), and I. scapularis, are known vectors for the zoonotic spirochetal bacteria Borrelia burgdorferi, which is the pathogenic bacteria responsible for causing Lyme disease. The ticks, inoculated with the bacterium when they bite infected mice, squirrels and other small animals, subsequently pass the pathogens to their human victims when they obtain a blood meal.B. burgdorferi bacteria can infect several parts of the body, producing different symptoms at different times. Not all patients with Lyme disease will have all symptoms, and many of the symptoms can occur with other diseases as well. If you believe you may have Lyme disease, it is important that you consult your health care provider for proper diagnosis. The first sign of infection is usually a circular rash called “erythema migrans”, or EM. This rash occurs in approximately 70-80% of infected persons and begins at the site of a tick bite after a delay of 3-30 days. A distinctive feature of the rash is that it gradually expands over a period of several days, reaching up to 12 inches (30 cm) across. The center of the rash may clear as it enlarges, resulting in a bull’s-eye appearance. It may be warm but is not usually painful. Some patients develop additional EM lesions in other areas of the body after several days. Patients also experience symptoms of fatigue, chills, fever, headache, and muscle and joint aches, and swollen lymph nodes. In some cases, these may be the only symptoms of infection.
Our Lyme and Tick-borne Diseases Research Center, located at the Columbia University Irving Medical Center (CUIMC) in New York City, is right next door to an international data resource. CUIMC is the coordinating center of a public health information initiative which includes medical records from approximately 400 million people drawn from eighty health-care organizations from around the world. This represents a unique opportunity to ask questions, generate hypotheses and get answers about Tick-borne diseases. When discovery is optimized, medical care is enhanced.
Brian Fallon, MD, MPH is the Director of the Lyme and Tick-Borne Diseases Research Center at the Columbia University Irving Medical Center and the author with Jennifer Sotsky of Conquering Lyme Disease: Science Bridges the Great Divide, published in 2018 by Columbia University Press.
The article below (Furthering the Benefits of Global Economic Integration through Institution Building: Canada as 2024 Chair of CPTPP) was first published by the C.D. Howe Institute by Paul Jenkins and Mark Kruger.
Introduction
Over the last 10 to 15 years, the global economy has become fragmented. There are many reasons for this fragmentation – both economic and geopolitical. A particularly important factor has been the inability of the institutions that provide the governance framework for international trade and finance to adapt to the changing realities of the global economy.
This erosion is reflected in the cycles of outcome-based measures of globalization, such as trade-to-GDP ratios. Research indicates that the development of institutions that promote global integration is highly correlated with more rapid economic growth. To secure the benefits of economic integration, the international community should re-commit to a set of common rules. This should involve the renewal of existing institutions in line with current economic realities.
But institutional renewal alone is not sufficient. Nurturing and growing new institutions are also critical, especially ones reflecting the realities of today’s global economy. Most promising in this regard is the Comprehensive and Progressive Agreement for Trans-Pacific Partnership (CPTPP).
The CPTPP is seen as a “next generation” trade agreement. It takes World Trade Organization (WTO) rules further in several key areas, such as electronic commerce, intellectual property, and state-owned enterprises. Expansion of CPTPP represents a unique opportunity to strengthen global trade rules, deepen global economic cooperation on trade and sustain an open global trading system. The benefits for Canada of an expanded CPTPP are further diversification of its export markets and deepened ties with countries in the Indo-Pacific region.
Trusted Policy Intelligence
The challenge to enabling broad-based accession to CPTPP is geopolitical, reflecting the rising aspirations of the developing world, the associated heightened contest between democracy and autocracy, and the prioritization of security. Indeed, for many, today’s security concerns are at the forefront, trumping economic issues. We argue that recognition of the economic benefits of global economic integration must also remain at the forefront, and that research presented in this paper shows that institutional building is at the core of securing such benefits.
As 2024 Chair of the CPTPP Commission, Canada has an opportunity to play a leadership role, as it did in the creation of the Bretton Woods institutions 80 years ago, by again promoting global institution building, this time through the successful accession of countries to the CPTPP, both this year and over the long run.
Cycles in Global Economic Integration Former US Fed Chair Bernanke points out that the process of global economic integration has been going on for centuries. New technologies have been a major force in linking economies and markets but the process has not been a smooth and steady one. Rather, there have been waves of integration, dis-integration, and re-integration. Before World War I, the global economy was connected by extensive international trade, investment, and financial flows. Improved transportation – steamships, railways and canals – and communication – international mail and the telegraph – facilitated this “first era of globalization.” The gold standard linked countries financially and promoted currency stability. Trade barriers were reduced by the adoption of standardized customs procedures and trade regulations. The movement of goods, capital, and people was relatively unrestricted. The outbreak of World War I frayed global economic ties and set the stage for a more fragmented interwar period. The Treaty of Versailles imposed punitive measures on Germany, exacerbating economic hardships. Protectionist policies, such as high tariffs and competitive devaluations, became widespread as countries prioritized domestic interests. The collapse of the gold standard further destabilized international finance. In contrast to the cooperation seen before the war, countries pursued economic nationalism and isolationism. Protectionism increased in the 1930s as a result of the dislocation caused by the Great Depression. In an attempt to shield domestic industries from foreign competition and address soaring unemployment, many countries imposed tariffs and trade barriers. The Smoot-Hawley Tariff Act in the United States exemplified this trend, triggering a series of beggar-thy-neighbour policies. These protectionist policies exacerbated the downturn and contributed to a contraction in international trade that worsened the severity and duration of the Great Depression. Mindful of the lessons of the 1930s, a more liberal economic order was established in the aftermath of World War II. The creation of the Bretton Woods Institutions – the International Monetary Fund (IMF), the World Bank and the General Agreement on Tariffs and Trade (GATT) – provided the principal mechanisms for managing and governing the global economy over the second half of the 20th century. Building on the GATT, the formation of the World Trade Organization in 1995 provided the institutional framework for overseeing international trade and settling disputes. China became the 143rd member of the WTO in 2001 and almost all global trade became subject to a common set of rules. The rise and fall of international economic governance are reflected in the cycles of outcome-based measures of globalization. Looking at trade openness, i.e., the sum of exports and imports as a percentage of GDP, the IMF divides the process of global integration into five periods: (i) the industrialization era, (ii) the interwar era, (iii) the Bretton Woods era, (iv) the liberalization era, and (v) “slowbalization” (Figure 1). Many factors have contributed to the plateauing of trade openness in the last 10 to 15 years. The fallout from the Global Financial Crisis was severe and the recovery was tepid. Brexit, with its inward-looking perspective, has disengaged the UK from Europe. Populist protectionism has led to “re-shoring” in an effort to address rising inequalities and labour’s falling share of national income. There has been far-reaching cyclical and structural fallout from COVID-19. And while the AI revolution portends significant opportunities, uncertainties over labour displacement abound. Geopolitics has also played a critical role. Security concerns have become more important, trumping economic issues in the eyes of many. This has led to multiple sanctions, along with export and investment controls, being imposed to protect national security interests. The IMF has carried out several modelling exercises that estimate the consequences of fragmentation if further trade and technology barriers were to be imposed. The studies employ a variety of assumptions regarding trade restrictions and technology de-coupling. In summary, the cost of further fragmentation ranges from 1.5 to 6.9 percent of global GDP. As with all modelling exercises, a degree of caution is warranted. At the same time, these studies should not be viewed as upper-bound estimates because they disregard many other transmission channels of global economic integration.
De Jure and De Facto Globalization In assessing the evolution of globalization, however, it would be misleading to focus too narrowly on outcome-based measures such as the trade-to-GDP ratio depicted in Figure 1. The data compiled by KOF, a Swiss research institute, provide a more nuanced view of global economic integration. KOF constructs globalization indices that measure integration across economic, social, and political dimensions. Its globalization indices are among the most widely used in academic literature. KOF’s data set covers 203 countries over the period 1970 to 2021. Our focus here is on KOF’s economic indices. In terms of economic globalization, KOF looks at the evolution of finance as well as trade. Moreover, one of the unique aspects of KOF’s work is that it examines globalization on both de facto and de jure bases. KOF’s de facto globalization indices measure actual international flows and activities. In terms of trade, it includes cross-border goods and services flows and trading partner diversity. For financial globalization, its indices measure stocks of international assets and liabilities as well as cross-border payments and receipts. KOF’s de jure globalization indices try to capture the policies and conditions that, in principle, foster these flows and activities. For trade globalization, these include income from taxes on trade, non-tariff barriers, tariffs, and trade agreements. De jure financial globalization is designed to measure the institutional openness of a country to international financial flows and investments. Variables to measure capital account openness, investment restrictions and international agreements and treaties with investment provisions are included in these indices. The trends in KOF’s de facto and de jure economic globalization indices are shown in Figure 2. Both globalization measures increased rapidly from 1990 until the Global Financial Crisis. Both measures subsequently plateaued. In 2020, as the global pandemic took hold, the de facto index plunged to its lowest level since 2011. In 2021, it recovered half of the distance it lost the previous year. The de jure index has essentially been flat for the last decade. There has been a sharp divergence between KOF’s de facto and de jure trade globalization measures in the last five years (Figure 3). By 2020, de facto trade globalization had dropped to a 25-year low. Although it recovered somewhat in 2021, it remains well below the average of the last decade. In contrast, de jure trade globalization levelled off after the Global Financial Crisis. It reached a modest new high in 2019 and has essentially remained there since then. The trends in financial globalization are almost the reverse of those of trade globalization. De facto financial globalization continued to increase through 2020 and dipped slightly in 2021. De jure financial globalization has been essentially flat over the last two decades (Figure 4). The KOF researchers provide convincing econometric evidence that economic globalization supports per capita GDP growth. Importantly, their analysis shows that institutions matter. They demonstrate that the positive impact on growth from trade and financial globalization comes from institutional liberalization rather than greater economic flows. Through a series of panel regressions, the researchers show that it is the de jure trade and financial globalization indices that are correlated with more rapid per capita GDP growth. In contrast, there is no significant relationship between growth and the de facto indices. KOF’s conclusions are consistent with the work of Rodrik, Subramanian and Trebbi who examine the contributions of institutions, geography, and trade in determining relative income levels around the world. They find that institutional quality “trumps everything else.” Once institutions are controlled for, conventional measures of geography have weak effects on incomes and the contribution of trade is generally not significant. Thus, to recapture the economic benefits of free trade and open markets, countries need to recommit to finding ways to further de jure globalization; that is, putting in place the institutional building blocks in support of enhanced trade and financial integration.
Geopolitical Realities Institutional reform, however, requires trust and mutual respect among partners. Many would argue that such trust and respect is in limited supply today, especially between the United States and China. The United States is willing to endure the costs of heightened protectionism to purportedly strengthen the resilience of its economy and secure greater political security. This has resulted in multiple sanctions, particularly in areas of digital technologies. In response, China, amongst other measures, has imposed export controls on critical minerals used in advanced technology in defence of its geopolitical goals. Yet, as discussed by Fareed Zakaria in a Foreign Affairs article, The Self-Doubting Superpower, China has become the second largest economy in the world richer and more powerful within an integrated global economic system; a system that if overturned would result in severely negative consequences for China. For the United States, its inherent strength has been its commitment to open markets and its vision of the world that has considered the interests of others. In many respects, it remains uniquely capable of playing the central role in sustaining the global economic system. Following a recent trip to China, Treasury Secretary Yellen stated that “the relationship between the United States and China is one of the most consequential of our time,” and that it “is possible to achieve an economic relationship that is mutually beneficial in the long-run – one that supports growth and innovation on both sides.” This means that the United States would need to accommodate China’s legitimate efforts to sustain a rising standard of living for its citizens, while deterring illegitimate ones. For China, it would mean a clear and abiding commitment to an open, rules-based global economic system. It appears that there is currently no clear path forward for this change in mindset, given what many see as insurmountable geopolitics in both the United States and China. Yet, history shows that achieving and sustaining long-term economic growth is in every country’s best interest, and that such growth is best secured through ongoing global economic integration.
A Way Forward Recent discussions at the IMF’s Annual Meeting in Marrakech about IMF quota reform, including quota increases and realignment in quota shares to better reflect members’ relative positions in the global economy, are important signals of possible renewal. Similarly, calls to revamp the World Bank’s mandate, operational model, and ability to finance global public goods, such as climate transition, reflect a growing consensus that the Bretton Woods Institutions must change in the face of today’s realities. But institutional renewal alone is insufficient. Broad-based accession to the CPTPP represents a unique opportunity to strengthen global governance overall, and to address common challenges in ways that benefit both countries as well as the global economy. The CPTPP sets a high bar, requiring countries to:
eliminate or substantially reduce tariffs and other trade barriers;
make strong commitments to opening their markets;
abide by strict rules on competition, government procurement, state-owned enterprises, and protection of foreign companies; and
operate within, as well as help promote, a predictable, comprehensive framework in the critical area of digital trade flows. The United Kingdom formally agreed to join the CPTPP in July 2023. Once its Parliament ratifies the Agreement, the UK will join Australia, Brunei Darussalam, Canada, Chile, Japan, Malaysia, Mexico, New Zealand, Peru, Singapore, and Vietnam in the trading block. Such a diverse membership clearly demonstrates that countries do not have to be geographically close to form an effective trading block. A half-dozen other countries have also applied to join the CPTPP, with China’s application having been the earliest received. Petri and Plummer estimate that joining the CPTPP would yield large economic benefits for China and the global economy. For the latter, the boost to global GDP would be in the order of $600 billion annually. The United States in joining would gain preferential access to rapidly growing Pacific Rim markets. Much of the additional market access would come from China’s opening of its service sector. Industrial policy and state-owned enterprises, however, will continue to play a much larger role in China than they do in Western economies. The key for China is to demonstrate that a socialist market economy (i.e., one that has a mixed capitalist market and government-controlled economy) can be consistent with fair trade. The process of China joining the CPTPP will undoubtedly be time-consuming. It took 15 years of negotiations before China joined the WTO in 2001. This was five more years, on average, than it took those countries that joined after 1995. The challenge for Canada, and subsequent chairs, is to ensure that China’s entry maintains the high standards CPTPP members have met so far. Broad based accession to the CPTPP, including the United States and China, however, is best viewed Page 8 Verbatim Trusted Policy Intelligence as a long-term goal. China would need to undertake unprecedented reforms, involving complex political challenges, including Taiwan’s potential accession. For its part, the United States would need to step well back from its current mercantilist mind set, which risks worsening.
Canada as Chair in 2024
While efforts to renew existing global institutions to better reflect current economic realities are important, we see promoting broad accession to the CPTPP as the best means to turn today’s global economic fragmentation around. At the heart of the global economic system is the open trading framework put in place at Bretton Woods in 1944. Many would see today’s fragmentation as becoming more acute, rather than getting better, due to geopolitical divisions. But further fragmentation is no way to save the open, rules-based global trading system that has served so many countries so well for so long.
While restrictions reflecting legitimate security concerns are inevitable, an open, competitive trading system remains in the best interests of all countries. As 2024 Chair of the CPTPP Commission, Canada has an opportunity to contribute to turning around the fragmentation of today’s global trading system and moving the global economy back along a path towards a more open, rules-based trading system.
An important goal for Canada’s chairmanship would be to clarify the rules of accession. This would be a big step forward in sustaining expansion of CPTPP. While today’s geopolitical realities surrounding the applications of both China and Taiwan represent a particularly challenging area to advance, significant progress in other areas must be made. It should accelerate inclusion of Costa Rica, Uruguay, Ecuador, and Ukraine, all of whom have applied. And it should help move forward discussions with South Korea, Indonesia, Philippines, and Thailand, who have expressed interest in joining.
Over and above all that, however, at a more strategic level, Canada should also champion discussion and understanding of why building towards the long-run goal of broad accession to CPTPP is important. Open and inclusive institutions are at the core of providing the benefits of global economic integration to all countries.
Canada will also be Chair of the G7 Summit in 2025. This, along with the various ministerial and officials’ meetings leading up to the Summit, offers another critical avenue for Canada to take a leadership role in sustaining and promoting an open, rules-based global trading system.
So if you are a relentless adventure junkie, which countries should be on your radar this year?
Our friends at BestCasinoSites.net evaluated factors including the number of roller coasters, casinos, rock climbing opportunities, mountain bike routes, hiking trails, and off-road trails in 61 countries, to compile a global index ranking the best countries to visit for thrill-seekers.
Canada among top 15 countries for adventure lovers
From biking the Gulf Islands to ziplining over Niagara Falls, Canada ranks 12th best country to get that adrenaline fix, earning a notable final score of 6.87/10. With 60,300 hiking trails and 5,980 mountain biking routes, Canada boasts a geographically diverse landscape and is home to North America’s second-highest peak, Mount Logan, topping out at 5,959 meters.
Mount Logan is a whopping 6KM in elevation and ranks sixth in the world for most prominent peak.
Adrenaline checklist in Canada: Experience Niagara Falls on a zipline, Rock or ice climb in the Rocky Mountains, Jump over the Cheakamus River with Whistler Bungee.
Whistler Bungee: offering a 160 foot jump over the glacially fed River below.
France reigns as the adventure capital of the world
According to the study, France is the world’s adventure capital, boasting an overall adrenaline score of 8.86/10. Prized for its stunning mountain ranges from the Pyrenees, Alps to Chamonix, the country offers over 720,000 hiking trails. Test your limits by conquering Europe’s highest peak, the Mont Blanc ranges, towering at 4,810 metres, or by jumping on one of France’s 227 thrilling roller coaster rides!
Adrenaline checklist in France:Cliff Jumping from the Calanques, Rock climbing overhanging limestone in Provence, Cycling on a glacier.
Trailing behind in second is Mexico, achieving a final score of 8.56/10. Your journey to this Latin American gem can be incredibly action-packed as you scale Mexico’s iconic snow-capped cone, Pico de Orizaba, with a peak of 5,636 metres above sea level; tackle one of the world’s biggest sport climbing areas at El Potrero Chico; or indulge in the thrill of games at any of the 364 casinos* Mexico boasts.
Adrenaline checklist in Mexico:Extreme urban downhill biking in Taxco; Bungee jumping at Los Cabos, Zip-lining in the Jungles of Yucatan.
The land of paella and sangria ranks as the third must-visit destination for adventurous souls, scoring 8.41/10. Spain offers an enticing array of outdoorsy pursuits, boasting the highest number of thrill-seeking trails – from rock climbing (10,600), mountain biking (6,430,000), to hiking (10,300,000) – among all cities studied. Spain’s pristine landscape appears tailor-made for adventure enthusiasts.
Adrenaline checklist in Spain:Rock climbing In Picos De Europa; Canyoning at Junta de los Rios; Andalucía, Walking the El Caminito del Rey.
Argentina takes fourth place, earning an impressive final score of 8.34/10. Home to the third highest peak (6,960 metres) in the study, The Aconcagua attracts over 3,000 mountaineers annually, despite being nicknamed the ‘Mountain of Death’. With a whopping 172 casinos*, including South America’s largest casino complex, the Trilenium, Argentina offers ample opportunities for both seasoned risk-takers and casual players alike.
Adrenaline checklist in Argentina: Mountain biking in Bariloche; Ice trek on top of Perito Moreno Glacier, Paragliding with Condors in Córdoba.
From kayaking down the Grand Canyon to cliff camping in Colorado, the United States rounds off the top five adrenaline hotspots, earning an impressive final score of 8.16/10. With the highest density of casinos in the study totalling 2,937 across the country, and over 900 roller coasters – including the world’s second-fastest roller coaster, Kingda Ka – America is a must-visit if you crave the rush of adrenaline.
Adrenaline checklist in the US: Rafting in the Grand Canyon, Mountain biking the Grand Staircase in Utah, Rock Climbing in Yosemite National Park.
For the Silo, Alasdair Lindsay.
Methodology
The experts at BestCasinoSites.net compiled a global index ranking the best countries for thrill-seekers by considering seven factors, including: (i) Number of casinos (ii) Number of roller coasters (iii) Number of rock climbing trails (iv) Number of mountain bike trails (v) Number of hiking trails (vi) Number of off road trails and (vii) Highest peak height in each country.
Note: Countries with more than two missing values were omitted, resulting in 61 countries in the final dataset.
The experts collected the data from the below sources:
Note: In countries where gambling is illegal, the average number of casinos of all countries was taken (excluding US because of being a huge outlier) to ensure fairness and avoid penalising any specific country.
A press photographer works next to the logo of the World Economic Forum (WEF) at the opening of their annual meeting in Davos on Jan. 15, 2024. (Fabrice Coffrini/AFP via Getty Images)
Close interactions between Canadian cabinet ministers and the World Economic Forum are well-documented, but a newly revealed letter suggests forum staff may have been doing more work with the federal government than previously disclosed.
In an undated letter to a WEF official, former Finance Minister Bill Morneau praised the organization and its collaboration to achieve “common” objectives.
“I would also like to take this opportunity to express my sincere appreciation to the WEF staff, for the support provided to the Government of Canada,” wrote Mr. Morneau in the letter obtained through the access-to-information regime.
Neither the WEF nor the Canadian government typically advertise what support the forum provides. The finance department has not replied to a request for information about the date of the letter and details of how WEF staff helped the government.
The letter was addressed to Philipp Rösler, a former German politician who served as a WEF manager and head of its Centre for Regional Strategies.
The federal government is known to have been involved in at least two WEF policy initiatives: the Known Traveller Digital Identification (KTDI) project and the Agile Nations network.
KTDI was a pilot project between Canada, the Netherlands, and private sector interests to develop a system of digital credentials for airplane travel between countries. Agile Nations is a group of countries working to streamline regulations to usher in the WEF-promoted “Fourth Industrial Revolution” that includes gene editing and artificial intelligence.
KTDI began in 2018, and Canada signed onto Agile Nations in November 2020, a few months after Mr. Morneau resigned during the WeCharity scandal. Both projects were worked on while Mr. Morneau was finance minister from 2015 to 2020.
Since both these projects fell outside of Mr. Morneau’s portfolio as finance minister, it seems to suggest that his letter of appreciation to the WEF was referring to other joint collaborations.
Canada’s then-minister of Finance Bill Morneau speaks to the Canadian Club of Canada in Toronto, on March 6, 2020. (Cole Burston/The Canadian Press)
The WEF’s mission statement says it is dedicated to “improving the state of the world.” It gathers leaders in the fields of politics, business, and activism to promote progressive policies on issues like climate change and making capitalism more “inclusive.” As is routine with the organization, it did not respond to requests for comment.
Critics of the WEF, which gathers world elites to shape global policies, often disagree with its progressive agenda and warn about its influence on countries.
“No staff, no ministers, no MPs in my caucus will be involved whatsoever in that organization,” Conservative Party Leader Pierre Poilievre said in January.
He added that officials who attend the forum’s annual meeting in Davos are “high flying, high tax, high carbon hypocrites” who travel in private jets while telling average citizens not to “heat their homes or drive their pickup trucks.”
Alberta Premier Danielle Smith has also criticized the WEF, saying in 2022 she finds it “distasteful when billionaires brag about how much control they have over political leaders, as the head of that organization has.”
Ms. Smith was likely referring to comments made by WEF founder and chairman Klaus Schwab in 2017, when he said said he was “very proud” to “penetrate the cabinets” of world governments, including that of Prime Minister Justin Trudeau.
“I know that half of his cabinet or even more than half of his cabinet are actually Young Global Leaders of the World Economic Forum,” Mr. Schwab told an audience at Harvard University.
WEF founder Klaus Schwab delivers a speech during the “Crystal Award” ceremony at the World Economic Forum annual meeting in Davos, on Jan. 16, 2023. (Fabrice Coffrini/AFP via Getty Images)
Davos Links
Mr. Morneau’s letter to the WEF comes from internal Finance Department records and is the only document in the release package that pertains to Mr. Morneau. It consists mostly of praise for the organization.
“As a Steward of Economic Growth and Social Inclusion, I have had the privilege of observing first-hand and benefiting from the WEF’s important contributions to foster public and private collaboration towards developing concrete solutions for strong, broad-based economic growth,” he wrote, adding that WEF analysis of different topics such as “structural reform priorities” was “helpful to develop substantive policy measures.”
He wrote that “as we enter another ambitious year for the WEF, I look forward to a continued fruitful collaboration to pursue our common objective of achieving stronger, sustainable and more inclusive growth.”
Other department records relate to current Finance Minister Chrystia Freeland and her involvement with the WEF. She is a board member of the forum and also an alumnus of the Young Global Leaders program that Mr. Schwab referenced.
Mr. Morneau, who resigned as minister in 2020, is listed on the WEF website as an “agenda contributor“ and a ”digital member.” He was a regular participant at the group’s annual meetings in Davos, Switzerland, while he was in office.
During those years, the Finance Department’s media relations office wasn’t shy about advertising ministerial trips to Davos.
“Canada’s strong presence at the Forum underscores the importance of this meeting for shaping the international agenda and advancing economic opportunities for Canadians,” read a January 2020 press release from the department announcing Mr. Morneau’s trip.
The Finance Department has not returned inquiries in recent years pertaining to Ms. Freeland’s involvement with the WEF, nor has it issued press releases referencing her involvement.
Some have questioned whether Ms. Freeland’s role as deputy prime minister and finance minister as well as a forum board member constitutes a conflict of interest. The Office of the Conflict of Interest and Ethics Commissioner said in its 2022 annual report it received more than 1,000 requests in a two-month period from members of the public to investigate the participation of MPs and ministers in the WEF.
The office said the requests “did not provide sufficient information to warrant an investigation.” Ms. Freeland’s leadership position with the WEF has been declared to the office and has therefore been cleared.
Canada’s immigration point system is designed to select skilled immigrants who have the potential to contribute to the country’s economic growth and meet its evolving skills needs. However, Canada faces challenges in fully leveraging increased immigration levels to enhance the well-being of Canadians due to weaknesses in capital investment and a quantity/quality trade-off in selecting economic immigrants. Furthermore, recent reforms may work at cross purposes to this goal. They include category-based selection that targets low-paying occupations, which can discourage capital investment, and a recent surge in the number of temporary residents in low-wage jobs that also may have adverse effects on the quality of potential candidates for permanent residency.
This study compares skilled immigration selection policy in Canada, Australia, New Zealand, and the UK, with the objective of identifying key areas for improvement in Canadian policy. The skilled immigration point systems in Canada and Australia share some similarities, with both prioritizing a two-step immigration process, placing an emphasis on English proficiency and workforce age, and requiring pre-migration credential and English proficiency assessments. However, the two countries differ mainly in their strictness of criteria and their emphasis on occupational and language skills. Furthermore, Australia has shown more agility and creativity in its skilled migration reforms. Reforms in the UK and New Zealand have also put them ahead in the competition for talent.
Based on this international comparison, the author makes recommendations for improvement. They include: 1) Setting a Minimum Points Threshold for Eligibility. As it is, Canada imposes no minimum points threshold for eligibility in its Express Entry points-based system. 2) Considering a Pre-admission Earnings Factor. Studies show the importance of pre-immigration earnings in predicting immigrants’ outcomes after arrival. The UK, New Zealand and Australia include this factor. 3) Boosting Standards under the Language Requirement. Official language skills are as important in predicting the initial earnings of principal applicants admitted under Canada’s Express Entry system as pre-immigration Canadian work experience, and even more important than educational level and age at the time of immigration. 4) Raising Business Immigration Numbers. Canada faces the challenge of weak business investment but is failing to select business immigrants with entrepreneurial skills, putting it at a disadvantage compared to competitors like Australia and the UK.
The author thanks Tingting Zhang, Charles DeLand, Rosalie Wyonch, Charles Beach, Jodi Kasten, Mikal Skuterud and anonymous reviewers for comments on an earlier draft. The author retains responsibility for any errors and the views expressed.
Parisa Mahboubi is a Senior Policy Analyst and leads the C.D. Howe Institute’s human capital policy program. Her research interest focuses on social policy with a concentration on demographic, skills, education, and labour market concerns. In addition to authoring research studies, she regularly writes a column for the Globe and Mail’s business section.
The Butchart Gardens, Canada, is the seventh most beautiful spring flower spot in the world, according to a new study.
#7 worldwide- Butchart Gardens, Victoria, British Columbia.
With springtime on the horizon, there are beautiful gardens all around the world filled with flowers getting ready to bloom. But which of these spots deserve a place on your travel bucket list?
Looking at flower locations across the globe, our friends and experts at Japan Rail Pass analyzed a variety of factors – including Google reviews and ratings, Instagram hashtags, and the vibrancy of the flowers in spring – to give an overall score and determine which flower spots you absolutely should not miss this spring.
The most beautiful spring flower spots around the world
According to the research, the most beautiful flower spot in the world is the Keukenhof Tulip Gardens of Lisse, Netherlands, which has exhibited spring flowers to the public since 1950.
The tulips in spring achieve an almost perfect vibrancy score of 9.96/10, proving just how bright and colourful these stunning gardens are.
Shinjuku Gyoen, Tokyo, Japan – 9.3/10
Credit – Sutterstock_Benny Marty
Next in the rankings, is the beautiful Shinjuku Gyoen in Tokyo, Japan. From the wide variety of cherry blossoms in the national garden, it is the Somei (Yoshino cherry) that bloom in spring.
The beautiful Japanese garden has over 856,000 Instagram hashtags, more than any other spot in the top 10, with people all over the world travelling to view the cherry blossoms.
Royal Botanic Gardens, Kew, London, UK – 9.2/10
Credit – Sutterstock_Charles Bowman
The third most beautiful spring flower spot according to the study is in London, England: The Royal Botanic Gardens, Kew.
With almost as many Instagram hashtags as Shinjuku Gyoen (764,996) and 44,465 reviews, it is clear that the flowers found here,cherry blossom, bluebells, and magnolias to name a few, are beloved by many.
Nabana no Sato, Mie, Japan – 9.0/10
Credit – Sutterstock_martinho Smart
In fourth place is the Nabana no Sato flower park, located in the Nagashima resort in Mie, Japan.
The spot is known for its illuminations throughout the park in winter through to spring, as well as the blooming cherry blossoms and tulips which scored a 9.34/10 for vibrancy in the study.
Dubai Miracle Garden, UAE – 8.9/10
Credit – Sutterstock_Sergii Figurnyi
The fifth most beautiful spring flower spot in the study was found to be the Dubai Miracle Garden in the United Arab Emirates, which occupies over 72,000 square metres, making it the largest natural flower garden in the world.
With over 75,000 reviews since its opening in 2013, and a vibrancy score of 8.78/10, it is clear that this impressive garden deserves its place in the top five rankings.
Methodology:
1. Japan Rail Pass wanted to find out which are the best flower spots around the world to see in Spring.
2. To do this they collected data on 25 popular flower locations around the world including the following variables:
Google ratings and reviews.
Instagram hashtags (using all relevant hashtags including where applicable local language versions)
OTTAWA—Near the two-year anniversary of the federal government’s invocation of the Emergencies Act, hundreds of people gathered on Parliament Hill on Feb. 17 to celebrate the original Freedom Convoy protest and a recent victory in Federal Court.
People gather on Parliament Hill for the two-year anniversary of the Freedom Convoy protest, on Feb. 17, 2024. (Matthew Horwood/The Epoch Times)Protesters march in downtown Ottawa to mark the two-year anniversary of the Freedom Convoy protest, on Feb. 17, 2024. (Annie Wu/NTD)People gather on Parliament Hill in Ottawa to mark the two-year anniversary of the Freedom Convoy protest, on Feb. 17, 2024. (Annie Wu/NTD)
“This is like coming home again. It’s a big family reunion,” said Edward Vachon, who attended the original trucker protest in early 2022.
“The spirit that was there two years ago is still here. We still have the same convictions and we’re standing up.”
Hundreds of people, many of whom attended the original truckers’ Freedom Convoy protest in downtown Ottawa, gathered on Parliament Hill and on Wellington Street in front of the Hill, waving Canadian flags and holding signs against government overreach.
Dozens of vehicles drove by the protest honking and waving Canadian flags throughout the day, but the Ottawa Police Service ensured that none of them parked downtown. The police wanted to avoid a repeat of the original Freedom Convoy protest where trucks encamped in the downtown core for weeks.
Later in the afternoon, the crowd participated in a march through downtown Ottawa under the close watch of Ottawa police.
Protesters gather on Parliament Hill in Ottawa to mark the two-year anniversary of Freedom Convoy on Feb. 17, 2024. (Annie Wu/NTD)Protesters gather on Parliament Hill in Ottawa to mark the two-year anniversary of Freedom Convoy on Feb. 17, 2024. (Annie Wu/NTD)
Bethan Nodwell, who helped organize the original Freedom Convoy protest, said the 2022 event “changed the course of Canadian history.” She said many of the people attending this weekend’s event were “forever changed” by the convoy and will continue to meet every year to celebrate “the new Canada that was born in 2022.”
Genevieve Desmarais, wearing a Canadian flag draped around her back, told our friends at The Epoch Times that she came to the Freedom Convoy protest two years ago because she was upset by government overreach with its COVID-19 restrictions.
Louis Desmarais said he saw the day’s events not only as a commemoration of the anniversary of the trucker protest but also as a celebration of the recent victory in Federal Court.
On Jan. 24, Federal Court Justice Richard Mosley ruled that the Liberal government’s use of the Emergencies Act “was not justified in relation to the relevant factual and legal constraints that were required to be taken into consideration.”
“Finally, we got a federal judge to say ‘No, it was wrong to call the Emergencies Act, it wasn’t justified.’ That’s a big moment,” Mr. Desmarais said.
“Now the lawsuits are going to come out, that’s going to bring out the truth about all the lies, so that’s a step in the right direction.”
Protesters gather on Parliament Hill in Ottawa to mark the two-year anniversary of Freedom Convoy on Feb. 17, 2024. (Annie Wu/NTD)Protesters gather on Parliament Hill in Ottawa to mark the two-year anniversary of Freedom Convoy on Feb. 17, 2024. (Annie Wu/NTD)
Federal Court Justice Mosley found that invocation of the Emergencies Act infringed on Section 2(b) and Section 8 of the Canadian Charter of Rights and Freedoms. Section 2(b) deals with “freedom of thought, belief, opinion, and expression,” and Section 8 deals with the “right to be secure against unreasonable search seizure.”
The freezing of protesters’ bank accounts was also not “minimally impairing,” Justice Mosley said, as the directive was overly broad and there were “less impairing options available.”
Emboldened by the court ruling, the original organizers of the Freedom Convoy filed a $2 million lawsuit on Feb. 13 against the federal government for violating their charter rights when it invoked the Emergencies Act. On Feb. 14, a total of 20 people who had their bank accounts frozen under the act also filed a tort lawsuit against federal ministers and financial institutions behind the decision.
Justice Mosley’s ruling was in contrast with that of the Public Order Emergency Commission created after the Emergencies Act was invoked, tasked with evaluating whether its use was justified. Justice Paul Rouleau, who oversaw the commission, ultimately said the government was within its rights to invoke the act on Feb. 14, 2022, to clear the protests.
Deputy Prime Minister Chrystia Freeland said Ottawa will appeal Justice Mosley’s ruling, saying that the decision to invoke the act was done following “careful deliberation” and was “the necessary thing to do.”
Protesters gather on Parliament Hill in Ottawa to mark the two-year anniversary of Freedom Convoy on Feb. 17, 2024. (Annie Wu/NTD)