Tag Archives: C.D. Howe Institute

Canadians Paying More Insurance Premiums That Most Developed Nations

Canadian consumers and businesses pay more than $80 billion a year in property & casualty insurance premiums with an upward trend consistently in excess of our anemic GDP growth rate. The total cost is now more than 3 percent of GDP. … But how does Canada benchmark relative to its global peers?

• Canadians pay higher premiums for property and casualty insurance than citizens in many, if not most, other developed nations. This Commentary uses OECD data and private industry data to compare the national P&C insurance sector’s premiums as a percentage of Gross Domestic Product with its international peers and is an update of the findings of the author’s 2021 edition of this report.

• The Commentary focuses on liability, property and auto insurance to compare costs across nations. Then, it takes a deeper dive into the Canadian data to compare personal property and auto insurance among all provinces and territories.

When it comes to costs for property insurance, the study finds Canada is in the top ranks, paying 1.23 percent of GDP in premiums, almost double the 0.66 percent average of other G7 peers and even higher than the 0.52 percent OECD average. For automobile insurance (which here includes both personal and commercial), Canadians appear to be paying, on average, the highest premiums in the world, relative to GDP.

• Within Canada, inter-provincial benchmarking for personal property insurance shows the higher average premiums paid in Canada – relative to the rest of the developed world – appear to be shared equally by most provinces. However, province-by-province comparisons of personal auto insurance show that there are substantial differences among provinces, with four jurisdictions producing higher-than-average results. Two of the four (Saskatchewan and Manitoba) are government-monopoly jurisdictions – in fact, these are the two highest in terms of costs. The two other outliers (Ontario and Alberta) are served by a competitive private sector, but Alberta has chosen until very recently to maintain a costly tort environment and Ontario mandates particularly generous accident benefits and has experienced a plague of auto theft.

• In the case of automobile insurance, just a handful of provinces need to think harder about how to improve car insurance premiums. But to reduce the cost of living for homeowners, the solutions required must be national in scope and include public/private partnerships to share the rapidly increasing risk-transfer price of natural catastrophe events.

Read the full article by Alister Campbell via this PDF.

Strengthening Canada’s Trade Laws to Address Emerging Global Threat

Key Canadian trade laws do not refer to national security as a factor that allows Canada to counter threats from imports of goods or services. Given the tense geopolitical situation, I propose ways to close this “national security gap.” 

The gap is particularly worrisome in two key import-governing legislation: (1) the Customs Tariff Act and (2) the Export and Import Permits Act.

I will show why the omission of the national security element in these and possibly other statutes needs to be remedied.

National Security & Chinese Exports

The Americans imposed surcharges on Chinese EVs, steel, aluminum, semiconductors and other products in May 2024 in response to heavily subsidized Chinese imports that were said to have breached international trade rules. 

The EU started applying countervailing duties on Chinese EVs in July this year, using a more standard trade remedy process to counter the injurious impact of subsidized imports on the European automotive industry. 

The danger posed by Chinese EVs, steel and aluminum imports, plus these actions by Canada’s major trading partners, led the Canadian government to apply comparable tariff surcharges. The strategic threat posed by China’s state-subsidized exports made for the right response by Canada. 

While existing laws allowed the federal cabinet to take action in this case, it also brought home the fact that there is an absence of any reference to “national security” in some of Canada’s major trade law statutes.

Section 53 – Canada’s Rapid  Response Mechanism

In the United States, Section 232 of the 1962 Trade Expansion Act, along with Section 301 of the 1974 Trade Act, authorize the president to increase tariffs on imports if the quantity or circumstances surrounding those imports are deemed to threaten national security.1

Section 232 was used by the Trump administration in 2018 to apply surcharges to a range of imports from numerous countries, including Canada. However, these tariffs were ultimately dropped in the face of threats by Canada to retaliate against American goods exported to Canada.

Unlike the US, Canada lacks the legislative means to impose import surcharges on the basis of national security. The closest we have is Section 53 of the Customs Tariff Act, which focuses on the enforcement of Canada’s rights under trade agreements and responses to practices that negatively affect Canadian trade. It was Section 53 that was used in the August decision on Chinese EVs, etc., referred to earlier.

Indeed, there are similarities between Section 301 of the US Trade Act of 1974 and Section 53 of the Customs Tariff Act.But while existing laws allowed the federal cabinet to act in this case, the case brought home the fact that there is an absence of any reference to “national security” in some of Canada’s major trade law statutes.

Governments have shied away from using Section 53 as a policy tool over the years. It was used only once before its present deployment, in response to the Trump administration’s surcharges on Canadian steel and aluminum in 2018 and 2020.2

 The surcharges were ultimately withdrawn when the US tariffs were terminated.Section 53 comes under Division 4 of the Actentitled “Special Measures, Emergency Measures and Safeguards,” giving the government broad powers to apply unilateral tariff measures on the joint recommendation of the ministers of Finance and Global Affairs:

…for the purpose of enforcing Canada’s rights 

under a trade agreement in relation to a country 

or of responding to acts, policies or practices of 

the government of a country that adversely affect, 

or lead directly or indirectly to adverse effects on, 

trade in goods or services of Canada…

There is no requirement for public consultations or input under this provision. Although the government held a round of stakeholder consultations before moving on Chinese imports in August, it was not legally obliged to do so. While the ministerial recommendations must be fact-based and supported by credible data, the law is effective in that nothing inhibits rapid action by the federal cabinet. In this respect, it is a superior tool to Section 232 of the American legislation.3

The critical shortcoming, on the other hand, is that while allowing the government to protect Canadian trade interests in a fairly rapid fashion, Section 53 does not allow action on imports found to be threatening national security, whether it be economic, military or other. There is clearly a need to repair this omission, not only here but in Canada’s other trade laws.

In my view, we need a national security component in Section 53 as the Canadian counterpart to Section 232 of the US Trade Expansion Act.

Import Controls and National Security

Together with tariff measures, Canada can control imports under the Export and Import Permits Act(EIPA) through the creation of import (and export) control lists designed to achieve particular strategic, security and economic objectives. These lists are established by orders-in-council, 

requiring listed goods and technology to have a permit in order to be imported or exported. These permits are issued by the Trade Controls and Technical Barriers Bureau in Global Affairs Canada (GAC). Without a permit, imports of controlled items are illegal.

While Section 5(1) of EIPA provides for the creation of import control lists covering arms, ammunition and military items, it fails to provide for imports of goods or technology to be controlled for national security reasons. The Act could not have been used, for example, to deal with the effects on national security of imports of Chinese EVs, steel, aluminum or any other goods or technology. EIPA is thus deficient in this regard.

There is a related issue when it comes to export controls. Section 3(1) of EIPA authorizes the establishment of export control lists, among other reasons:

“(a)…to ensure that arms, ammunition, 

implements or munitions of war, etc. … otherwise 

having a strategic nature or value will not be made 

available to any destination where their use might 

be detrimental to the security of Canada.”

The reference to the “security of Canada” under paragraph (a) is the only such reference in the statute and is confined to the security aspects of imports of arms, ammunition, munitions of war, etc. While not as significant as the problems regarding import controls, it is nonetheless a serious omission.

The result is that as EIPA is currently drafted, the federal government lacks the legal authority to create import or export controls designed to protect or safeguard Canadian security. EIPA needs to be amended to add this authority on the part of the government.

Indeed, it may be desirable to re-consider much of the architecture of EIPA from the viewpoint of safeguarding Canada’s security interests on both the export and import side.

Controlling Imports Through Sanctions

Canada’s sanctions laws are found in the Justice for Victims of Corrupt Foreign Officials Act (JVCFOA), the United Nations Act, and, notably, the Special Economic Measures Act (SEMA). Each of these statutes allows the federal cabinet to issue sanctions through regulations 

applicable to specific countries and/or jurisdictions and prohibiting transactions in specific items of goods or technology. None of these laws allow sanctions for matters related to Canadian security.

SEMA is Canada’s most widely used sanctions legislation. Section 4 is the only part of the Act that uses the term “security,” but only in instances when, among other matters:

(b) a grave breach of international peace and 

security has occurred that has resulted in or is likely 

to result in a serious international crisis.

Because of the restrictions on international peace and security, the government lacks the authority to issue sanctions dealing with national security interests.4

For example, Canada’s sanctions on Russia are directed at countering actions that “constitute a grave breach of international peace and security that has resulted or is likely to result in a serious international crisis,” with no reference to Canadian national security interests.

SEMA should be amended to allow prohibitions of any transaction or dealings of any kind where Canada’s national security is at risk.

Trade Remedies and National Security

In accordance with the GATT/WTO Agreement, antidumping and countervailing (AD/CV) duties can be applied to dumped or subsidized imports when a domestic industry is injured or threatened with injury from exactly the same imports as that industry produces. In Canada, these are provided for under the Special Import Measures Act (SIMA).

SIMA actions are driven by complaints filed by domestic producers who make exactly the same or directly competitive products as the imported items. It means, for example, that in the absence of a Canadian industry threatened with injury or actually injured by the same type of Chinese EVs, aluminum or steel imports as those producers make, AD/CV duty remedies would not be available. SIMA makes no reference to national security as a factor in the application of these duties.

In short, because the SIMA process is geared to provide protection to domestic producers and private sector industries, it is inappropriate as a vehicle for dealing with national economic security concerns that range well beyond those private interests.

The same is true in the case of safeguards, another kind of trade action allowed under the World Trade Organization (WTO) Agreement to counter floods of imports that are not dumped or subsidized but, because of their volume, cause or threaten serious injury to domestic producers of the same product.

In Canada, safeguard measures come under the Canadian International Trade Tribunal Act, where an inquiry takes place and, if recommended by the Tribunal, are applied under the Customs Tariff Act.

As in the case of dumped or subsidized imports, safeguard measures are designed to protect specific domestic industries and not to deal with overarching national security issues.

Again, because the objective of these remedial measures in international and Canadian trade law is to protect a domestic industry from financial harm due to imports and not to deal with broader questions of national security, the absence of reference to “security” in these various statutes does not seem to be a significant issue.

National Security under International Trade Law

Article XXI of the 1947 General Agreement on Tariffs & Trade (GATT) is the only provision in the entire WTO package that deals with national security. That article (entitled “Security Exceptions”) allows departures from normal trade rules to permit unilateral trade-restrictive measures that a contracting party “considers necessary for the protection of its essential security interests…taken in time of war or other emergency in international relations.”

The drafting of GATT Article XXI dates back to the post-World War II Bretton Woods era. What was considered an international emergency at that time was war, regional armed conflict or a global pandemic like the Asian flu of 1918-1920. The same broad view of international emergency conditions was applied when the Uruguay Round negotiations took place (1991-1994) leading to the conclusion of the WTO Agreement.

With recent cataclysmic changes in the world, whatever the WTO-administered multilateral system might prescribe, governments are moving to protect a range of national (and economic) security concerns by means of unilateral measures in ways that were not envisaged when the Bretton Woods architecture was devised in the late 1940s.

For decades, there was little recourse to Article XXI exceptions. However, their use emerged in the last number of years with the unilateral surcharges imposed by Trump. 

The situation is different – and materially different – in the case of Chinese exports, not only EVs, steel or aluminum but also in technologically advanced or other critical items. These are goods that, by abundant evidence, are heavily subsidized, with massive overcapacity, exported to global markets as part of the Chinese government’s strategy to enhance its geopolitical position – facts uncovered in the EV situation through detailed investigations by the EU and the US.5

Thus, aggressive actions by China and possibly other countries in strategically sensitive areas take the issue beyond the WTO ruling in the US-Section 232 case and raise these to the level of an “emergency in international relations.”

In summary, the concept of an international emergency is much changed in today’s digitized, cyber-intensified world, including the aggressive and destabilizing policies of Chinese state capitalism and other bad actors. The application of GATT/WTO rules drafted in 1947 and updated in the 1990s must be adapted to deal with today’s realities if they are to provide governments with meaningful recourse.

Conclusions

In conclusion, Canada has a panoply of criminal, investment, intelligence gathering and other laws that address national security concerns. However, there is a notable absence of the term “national security” in Canada’s core trade law statutes.

This absence is of concern in the Customs Tariff Act and the Export and Import Permits Act, two important statutes that give the government authority to act to counter injurious imports threatening Canada’s national security.

Given the state of world affairs and the challenges Canada faces from aggressive players like China, Russia, Iran and others, the omissions in these statutes need to be remedied. This should be acted on immediately. There is also a lack of reference to national security in Canada’s sanctions legislation, notably the Special Economic Measures Act (SEMA), the main Canadian sanctions statute. 

Amendments should be made to make security concerns a ground for imposing sanctions here as well. The findings of EU agencies on Chinese BEV after a detailed investigation support the view that Chinese state capitalism and its centrally planned industrial capacity are geared toward dominating world markets in critical goods, part of that country’s geopolitical strategy. These and other similar governmental actions can be said to meet the “emergency in international relations” threshold under the WTO Agreement. 

Given the state of affairs at the WTO, including the paralysis of its dispute settlement system, amendments to or reinterpretation of the GATT rules are difficult, if not impossible. The result is that governments will be resorting to unilateral application of the Article XXI exclusion in their own national security measures. While the situation may evolve at the WTO, and without diminishing Canada’s support for the multilateral rules-based system, the federal government should bring forth measures to add reference to national security interests in the above statutes.  For the Silo, Lawrence L. Herman/ C.D. Howe Institute.

International Economic Policy Council Members 

Co-Chairs: Marta Morgan, Pierre S. Pettigrew Members: Ari Van Assche Stephen Beatty Stuart Bergman Dan Ciuriak Catherine Cobden John Curtis Robert Dimitrieff Rick Ekstein Carolina Gallo Victor Gomez Peter Hall Lawrence Herman Caroline Hughes Jim Keon Jean-Marc Leclerc Meredith Lilly Michael McAdoo Marcella Munro Jeanette Patell Representative, Amazon Canada Joanne Pitkin Rob Stewart Aaron Sydor Daniel Trefle

1 The Trade Expansion Act of 1962 (Pub. L. 87–794, 76 Stat. 872, enacted October 11, 1962, codified at 19 U.S.C. ch. 7); The Trade Act of 1974 (Pub. L. 93–618, 88 Stat. 1978, enacted January 3, 1975, codified at 19 U.S.C. ch. 12).

2 The government announced it was applying these “to encourage a prompt end to the U.S. tariffs, which negatively affect Canadian workers and businesses and threaten to undermine the integrity of the global trading system.” See: “United States Surtax Order (Steel and Aluminum),” Government of Canada, June 28, 2018, https://gazette.gc.ca/rp-pr/p2/2018/2018-07-11/html/sordors152-eng.html. 

3 Section 232 of the Trade Expansion Act allows the president to impose import restrictions – but these must be based on an investigation and affirmative determination by the Department of Commerce that certain imports threaten to impair US national security.

4 The array of Canada’s sanctions can be found on the GAC website at: https://www.international.gc.ca/world-monde/international_relations-relations_internationales/sanctions/current-actuelles.aspx?lang=eng. 

5 The EU measures followed a countervailing duty approach, as opposed to direct action in the case of Canada and the US. In its extremely detailed investigation, EU agencies found, on the basis of massive evidence, that:
“ . . . the BEV [battery electric vehicle] industry is thus regarded as a key/strategic industry, whose development is actively pursued by the GOC as a policy objective. The BEV sector is shown to be of paramount importance for the GOC and receives political support for its accelerated development. Including from vital inputs to the end product. On the basis of the policy documents referred to in this section, the Commission concluded that the GOC intervenes in the BEV industry to implement the related policies and interferes with the free play of market forces in the BEV sector, notably by promoting and supporting the sector through various means and key steps in their production and sale.”See: “Commission Implementing Regulation (EU) 2024/1866,” European Union, July 3, 2024, at para. 253, https://eur-lex.europa.eu/eli/reg_impl/2024/1866/oj

Canada Should Embrace Trump Presidency Opportunities

From: Chris Christie
To: Nervous Canadians 
Date: November 6, 2024 
Re: Canada Should Embrace the Opportunities of a Second Trump Presidency

A second Donald Trump presidency, if approached strategically, offers Canada more opportunities than risks.

Donald Trump’s campaign rhetoric is often erratic, of that there is no doubt. And I, as you might have heard, am not a Donald Trump advocate.

But what happens in governance under Trump is a far cry from his provocative online posts or bombastic speeches, as I argued in the latest C.D. Howe Institute Regent Debate. His track record speaks for itself, and whether you choose to acknowledge it or not, Canada has already benefitted from Trump-era policies.

Let’s take the US-Mexico-Canada Agreement – CUSMA in the Canadian rendering – as a prime example. Trump’s renegotiation of NAFTA wasn’t just about putting “America first.” It was about reshaping trade relationships in North America to benefit all three countries. The agreement secured economic ties between the US, Canada, and Mexico in a way that ensures long-term growth for all parties involved.

Trump views that agreement as one of his crowning achievements, and rest assured, it’s not going anywhere. It is a durable platform for growth in North American trade.

Looking forward, the question isn’t whether Trump is unpredictable. It’s whether Canada can recognize and leverage the opportunities his policies present.

With Trump re-elected, his administration will continue to focus on policies that drive economic growth – lower taxes, reduced regulations, and energy independence. A booming US economy means a stronger Canada, as our two economies are deeply intertwined. When one prospers, the other stands to benefit through increased trade and investment.

Trump’s approach to trade – especially tariffs – has often been misunderstood. Yes, his speech-making is aggressive. But we need to separate rhetoric from reality. Trump’s actual policies were more measured than many anticipated. And they will be again. 

The real adversary for Donald Trump is China, not Canada. If Trump tightens the screws on China’s unfair trade practices, it could create space for Canadian companies to flourish on a more level playing field, particularly in sectors like technology and intellectual property, where China has been a major violator.

Trump’s economic philosophy – focused on cutting taxes and regulations to unleash private-sector growth – should also serve as a wake-up call for Canada. Under Prime Minister Trudeau, Canada has taken a ruinous policy road, with higher taxes and more government intervention in business.

But what if Canada aligned itself more closely with the pro-growth policies Trump advocates? 

Imagine the potential for Canadian businesses if they operated in an environment with fewer barriers to growth. A thriving private sector in Canada would strengthen the economy and create more opportunities for collaboration and trade with the US.

I won’t pretend that a second term comes without challenges. But instead of focusing on the personality occupying the Oval Office, Canada should focus on how to navigate the opportunities presented by our shared future as neighbours and trade partners.

It’s time to stop seeing Trump as an unpredictable threat and start recognizing the potential opportunities his policies can bring. Canada stands to benefit if it plays its cards right. For the Silo, Chris Christie.

Chris Christie was the 55th Governor of New Jersey and a participant in the C.D. Howe Institute’s recent Regent Debate. Send comments to Chris via this link.

Canada’s Digital Services Tax is in US Crosshairs 

From: Jon Johnson
To: Global Affairs Canada 

On August 30, the US requested consultations respecting Canada’s Digital Services Tax Act under the dispute settlement procedure set out in the Canada-US-Mexico Agreement (CUSMA). The US maintains that by imposing the tax, Canada has failed to provide US service providers and investors treatment no less favourable than it provides to Canadian service providers and investors. Given Canada’s unique trade relationship with the US, this could have major implications.

The essence of the complaint is that Canada is violating a specific CUSMA obligation to grant US firms terms that are no less favourable than its own companies receive.

This is called national treatment. The crux of the US argument is that the revenue and earnings thresholds are so high that no Canadian service provider would be subject to the tax, but at least some US providers would be. While the DST is not discriminatory on its face, its practical effect is discriminatory. 

Canada’s taxation of digital services has been an on-going contentious issue with the US. The new legislation entered into effect on June 20 and imposes a 3-percent levy – retroactive to January 1, 2022 – on revenue (not income) earned from digital services when certain thresholds are met. Annual gross revenues in a calendar year must exceed €750 million for the tax to apply. The taxpayer must also earn at least C$20 million in Canadian digital services revenue in a calendar year. Affected companies are to start paying the tax next June 30. 

On August 1, the Congressional Research Office released a paper outlining multiple concerns. It cites industry associations that maintain that Canada’s DST could “cost US exporters and the US tax base up to $2.3 billion annually and could directly result in the loss of thousands of full-time US jobs.” The paper also cites possible violations of CUSMA and WTO obligations. 

The paper also notes that the United States Trade Representative (USTR) has applied sanctions under Section 301 of the 1974 Trade Act against digital services taxes enacted by other countries. Section 301 is much broader in its application than either CUSMA or the WTO.

The CUSMA panel could decide for the US if the facts establish that only US companies meet the €750 million threshold for overall earnings and whose Canadian digital earnings exceed C$20,000,000. 

Aside from the possibility of an adverse panel decision and action by the US under Section 301, there are other factors that Global Affairs Canada should consider before the Canadian government commences with the retroactive portion of the tax.  

CUSMA is up for renegotiation on July 1, 2026. The process on the US side starts with a USTR report to Congress, due by the end of 2025, that will include an assessment of CUSMA’s operation, as well as a recommendation on CUSMA extension. As Canadian initiatives to impose digital taxes have been a US concern for years now, the recommendation will doubtless address the question of Canada’s DST regime. If that regime remains an open issue and US concerns are not satisfied, the stage could be set for the ultimate demise of CUSMA in 2036.

CUSMA Article 32.6 also provides that a party can withdraw from CUSMA upon giving six months’ notice to the other parties.  

Decision time for the Canadian government falls on June 30, 2025, and it has to decide whether to go ahead and start collecting its retroactive DST and face the inevitable hostile reaction of its largest trading partner. This has to be carefully managed, or this small issue could become a big one. For the Silo, Jon Johnson.

Jon Johnson is a former advisor to the Canadian government during NAFTA negotiations and is a Senior Fellow at the C.D. Howe Institute.

Third Swing At Canada Carbon Tax Analysis By PBO

Let’s Hope for Solid Hit from the PBO’s Third Swing at Carbon Tax Analysis

The “corrected” analysis by the Parliamentary Budget Office of the carbon tax and rebates is due soon. One hopes it will get more things right in this third crack at evaluating the government of Canada’s assurance that most Canadians will receive enough from the carbon tax rebates to cover their cost of paying the tax.

Reporting in 2022 and in an update last year, the PBO analysis confirmed the government assertion so long as induced economic effects from the carbon levy are not included. However, once the economic damage from the levy is included, the PBO concluded that the rebates fall short of keeping family budgets whole. 

The PBO’s conclusion was seized on by Conservative politicians and others to justify calls to revoke the carbon tax. Now, more knives have come out. The NDP says it would scrap the tax on households and put the burden on large emitters, but it does not yet explain how it would square that with the current big-emitter carbon tax. And BC, where carbon taxing began in Canada, has said it would drop the tax if Ottawa removed the legal requirement.

Much is at stake with this third PBO swing.

After the second report, the PBO admitted that its analysis had included, in addition to the carbon tax on households, the tax on large emitters as well. The economic impacts had been taken from work passed over to the PBO by Environment and Climate Change Canada (ECCC), which included the effects of the tax as applied to both industrial and household payers. The budget officer said the error was small and had little consequence for the analysis and promised a corrected version this fall. 

The Canadian Climate Institute estimates that 20-48 percent of the emissions reduction by 2030 will come from the levy on large emitters compared to 8-14 percent from households. Given the scale of the large emitters tax, it is likely that it has significant economic effects on any forecast. Fixing this should not, however, be the most consequential revision to its analysis. 

The PBO’s first two efforts had an analytical asymmetry. It measured the economic cost originating in the tax, exaggerated as it turned out, but did not attempt to capture the economic benefits (not to mention any health gains) from the effects of the household carbon levy in mitigating climate change. Put differently, their work was, in effect, based upon the faulty premise that climate change brings no economic damage. The massive and growing costs of cleaning up fire and flood damage and adapting to the many other consequences of global warming bear evidence of such costs. The PBO could and should do its own analysis of those climate change costs and, hence, the benefits of mitigation. Or it could more easily tap into the substantial body of available literature.

Lowering Canada’s Gross Domestic Product

In Damage Control, the Canadian Climate Institute estimated climate change would lower the Gross Domestic Product by $35 billion from what it would otherwise have been in 2030; the impact would rise to $80 to $103 billion by 2055. Through cutting emissions, the household carbon tax will reduce this cost. International literature is rich, and the PBO could review it for applicability to Canada. As but one example, Howard and Sterner’s (2017) meta-analysis on the impacts of climate change concluded most studies underestimated them. Their preferred estimate points to a GDP hit of between 7 and 8 percent of GDP if there are no catastrophic damages and 9 to 10 percent if there are. Conceptual thinking is also advancing. Consideration is being given to there being “tipping points” where a certain degree of climate change may have much more non-linear dramatic economic effects. Some, like Stern and Stigliz, even question the worth of comparing an economic outlook with mitigation action against a status quo baseline as the PBO has done. They argue that without mitigation, there may not be a sustainable economic outcome. 

Finally, those still inclined to think that a corrected Fall 2024 PBO report will provide ammunition to “axe the tax” need to ask themselves two questions.

First, is there value in the emissions reduction resulting from the household carbon tax? The Canadian Climate Institute concludes that the 8-14 percent contribution to emissions reduction by 2030 will grow in later years. Even with the tax and all the other policies announced to date, there is a 42-megatonne gap in Canada’s 2030 emissions reduction target. More than 200 Canadian economists signed an open letter asserting that “carbon pricing is the lowest cost approach because it gives each person and business the flexibility to choose the best way to reduce their carbon footprints. Other methods, such as direct regulations, tend to be more intrusive and inflexible, and cost more.” If not the household carbon tax, then what else?  

Let us hope the PBO’s third carbon tax report gives evidence to form a more balanced perspective. For The Silo, Don Drummond/C.D. Howe Institute.

Don Drummond is the Stauffer-Dunning Fellow in Global Public Policy and Adjunct Professor at the School of Policy Studies at Queen’s University and a Fellow-In-Residence at the C.D. Howe Institute.

Basic Living Standard Arithmetic For Ottawa And All Governments

September , 2024

To: Canadians concerned about prosperity 
From: Don Wright 
Date: September 4, 2024
Re: Some Basic Living Standard Arithmetic for Governments

Governments often talk about “creating jobs,” but what they really do is choose some jobs at the expense of others. With their myriad spending, taxing and regulatory decisions, all governments try to direct job growth to different sectors – public or private, services or goods, resources or non-resources, and so on.

We all hope governments choose wisely.

It would help if they started paying more explicit attention to one factor: The impact of their decisions on Canadians’ standard of living.

A country’s standard of living is largely determined by the wages and net government revenue its tradeable goods and services sector can pay while remaining competitive against international competitors. If a company or sector is uncompetitive, it will have to either lower its wages, pay less tax or go out of business. These pressures on companies are never-ending. They determine both the wages a sector can afford to pay, and, through the interconnectedness of labour markets, average wages across the economy.

Some industries are so productive they can pay relatively high wages and significant taxes and yet remain competitive.

Industries that aren’t as productive can only pay lower wages and less tax.

Governments whose policies have the effect of moving labour from one sector to another had better pay attention to such facts.

Canadians may not like it but many of the country’s best-paying and most tax-rich jobs are found in natural resources. I was head of British Columbia’s public service. For most of B.C.’s history the province’s economic base has been dominated by natural resource industries – forestry, mining, oil and gas, agriculture and fishing. For a variety of reasons, these industries face strong political headwinds. Many groups press to constrain them and diversify away from them. The alternatives proposed include technology, film and tourism.

A few years ago, I asked officials in the province’s finance ministry to assess the relative performance of these different industries along the two key dimensions of average wages and net government revenue. In 2019-20 B.C. spent approximately $11,700 per citizen. Half the population was employed that year. So, to “break even” (i.e., have a balanced budget), the province had to collect $23,400 per employed person. If you look at things this way, each industry’s “profit” or “loss” is simply its revenue per employee less $23,400.

No such calculation will be exact, of course.

Several assumptions have to be made to get to an average “profit” or “loss” per employee. But, with that caveat, the numbers the officials brought back were telling. The industry with the biggest return to the province was oil and gas, at $35,500 per employee. Forestry was next, at $32,900. Then mining, at $14,900, and technology, though only at $900.

By this measure of profit and loss, however, film was a money loser, at -$13,400, and so was tourism, at -$6,900.

The negative numbers for the film industry reflect the very significant subsidies that B.C. (like many other provinces) provides to this sector. The negative number for the tourism sector primarily reflects low average wages per employee, which translate into relatively low personal income tax, sales tax and other taxes paid by employees.

These “profit or loss” numbers are not in any way a judgment about workers in these sectors. People find the best employment available to them in the labour market. Relative demands in that market are determined by many factors, none of which workers control. That said, if governments consciously move resources from the “profit” industries to the “loss” industries, they had better be aware of the consequences for wages, taxes and the overall standard of living.

The numbers I’ve cited were for a single year in British Columbia. The same analysis for other provinces or for Canada as a whole would likely produce different numbers – though I’d be surprised if the overall pattern were much different. Voters will draw their own conclusions about the impact on British Columbians’ standard of living from constraining the resource industries and promoting other industries instead.

Unfortunately, this type of analysis is rarely done when Canadian governments make decisions about what types of jobs they want to give preference to through their taxation, spending and regulatory decisions. They should do more of it. Ultimately, if [they] care about Canadians’ standard of living, governments need to start paying attention to the basic arithmetic of that standard of living.

Don Wright, senior fellow at the C.D. Howe Institute and senior counsel at Global Public Affairs, previously served as deputy minister to B.C.’s premier, cabinet secretary and head of the public service.

Rethinking Canada Tariffs On China EVs

Via friends at C.D. Howe Institute. A version of this memo first appeared in the Financial Post.

To: Canadian trade watchers 
From: Ari Van Assche 
Date:  August, 2024
Re: Canada’s Electric Vehicle De-Risking Trilemma 

With the recent wrap-up of Ottawa’s month-long public consultation on levying tariffs on electrical vehicles (EVs) made in China, let’s paraphrase a story Nobel Prize-winner Paul Krugman once used to explain the often under-appreciated benefits of free trade:

Consider a Canadian entrepreneur who starts a new business that uses secret technology to transform Canadian lumber and canola into affordable EVs. She is lauded as a champion of industry for her innovative spirit and commitment to Net Zero. But a suspicious reporter discovers that what she is really doing is exporting Canadian-made lumber and canola and using the proceeds to purchase Chinese-made EVs. Sentiment turns sharply against her. On social media, she is widely denounced as a fraud who is destroying Canadian jobs and threatening national security. Parliament passes a unanimous resolution condemning her.

Going the other direction: China is Canada’s third largest destination for agricultural products.

This story underscores a critical dilemma that should have been central in the public consultations.

Those opposing tariffs argue that trade is a potent yet undervalued tool in our fight against climate change: It provides Canada access to low-emissions technologies at increasingly affordable prices, which is essential for transitioning society away from carbon-intensive energy sources. In contrast, those in favour are concerned about supply security, fearing excessive reliance on our biggest geopolitical rival for low-emissions technologies. They warn against swapping the West’s age-old energy insecurity in oil for insecurity in the supply of critical minerals and EV batteries.

The $70,000 cad Polestar 2 EV produced by Volvo. In 2010, Geely Holding Group a Chinese automotive group bought Volvo.

Copilot AI

“As of now, the Chinese electric vehicle (EV) market is making strides globally, but in Canada, the landscape is still evolving: Tesla Model Y and Polestar 2: While not exclusively Chinese, the Tesla Model Y (which is produced in China) and the Polestar 2 (a subsidiary of Volvo, which has Chinese ownership) are currently the most prominent Chinese-made EVs available in Canada. These models have gained attention due to their performance, range, and brand reputation1.”

I examined some of the national security issues that have surfaced in the discussion surrounding supply chains for low-emissions energy technologies like EV batteries in my recent C.D. Howe Institute report.

After examining the various de-risking policies governments have implemented, including their downsides and unintended consequences, I conclude Ottawa probably should develop de-risking policies.

But it needs to apply them judiciously, prudently and rarely. And it needs to justify them with credible, detailed evidence regarding concerns about supply security and whether domestic industry really would be able to compete if market conditions were fairer. This will be important in upholding Canada’s reputation as a leading proponent of the rules-based multilateral system.

China’s role in the supply chains of low-emissions energy technologies does raise real security concerns. China has established near monopolies in several critical minerals and other components of EV batteries, solar panels and wind turbines. No ready alternatives are produced in other countries. For example, 79 percent of global production capacity of polysilicon, which is key for solar cell production, is in China. The next biggest producers, Germany and the United States, have difficulty competing with China’s high-quality, ultra-cheap polysilicon.

China’s monopolies create chokepoints that could enable its government to manipulate production to pursue its own geopolitical ambitions.

Precedents exist: China blocked rare-earth exports to Japan in 2010 and banned exports of rare-earth processing technology in 2023.

Several countries have started adopting de-risking policies to reduce their reliance on these Chinese chokepoints, usually either onshoring or friendshoring. Canada’s recent Critical Minerals Strategy is typical. It was designed in part to reduce this country’s dependence on foreign-mined and processed critical raw materials by, among other things, allocating $1.5 billion to support Canadian critical minerals projects related to advanced manufacturing, processing and recycling.

But these de-risking policies come at a cost.

Ottawa needs to carefully navigate a “policy trilemma” as it strives to formulate a policy agenda that simultaneously targets three goals: Advancing security, promoting low-emissions energy adoption, and capturing the benefits of trade for consumers and businesses.

Proposed steep tariffs on Chinese EV imports provide a good example of the trilemma.

They may well safeguard security by protecting a domestic production base. But they could discourage the uptake of EVs, which are already experiencing a slowdown in sales. Moreover, such unilateral action against China could escalate geopolitical tensions, thereby generating new risks, including Chinese retaliation. The path to effective de-risking is clearly fraught with trade-offs and requires careful navigation.

There is scant evidence that China is on its way to becoming a near-monopoly in global EV production itself, but it may seek to benefit from its near-monopoly in key inputs. The ultimate question that the government should answer is, therefore, whether the security concerns regarding these chokepoints, and more generally China’s willingness to compete fairly under these conditions, justify the costs and risks of higher tariffs. The burden on Ottawa is to provide concrete evidence to that effect before imposing an inherently costly tariff on Canadians.

Ari Van Assche is a professor of international business at HEC Montréal and Fellow-in-Residence at the C.D. Howe Institute.

Making Sense Of Canada Doctor Shortage Paradox

Canadians are in a primary-care paradox.

About 14 percent of Canadians aged 12 and older – approximately 4.6 million people – did not have a regular health-care provider in 2022, according to Statistics Canada. Even more alarming, about 6.6 million Canadians rely on family doctors aged 65 and over, meaning that even more people could soon find themselves adrift as their physician retires.

Canada has the highest number of general practitioners per capita among comparator countries, yet ranks worst in terms of having a doctor or a regular place for medical care (only 86.2 percent of surveyed Canadians had one in 2023).

What is happening?

Several factors are at play.

First, it’s no secret that the physician workforce, much like the rest of our population, is aging. There aren’t enough new graduates to replace retiring physicians and meet the needs of a growing population. [Canada currently has one of the highest Immigration rates in the world with rates growing steadily and currently sit at around 1.2% population increase each year. CP]

Moreover, physicians have been spending fewer hours on direct patient care. Administrative tasks, such as paperwork for insurance claims, sick notes, and duplicate form requests from different organizations, consume approximately 18.5 million hours of physician time annually in Canada, equivalent to 55.6 million patient visits. Economic and cultural factors are also steering medical trainees towards specialties rather than general family practice. Without changes, the gap between the supply and demand for family physicians will only widen.

My recent C.D. Howe Institute analysis shows that under a normal retirement scenario – where 57 percent of family physicians aged 75 and over retire – the projected supply of family physicians in 2032 will meet 90 percent of the demand. If all family physicians aged 75 and over were to retire, only 78 percent of projected demand would be met, leaving us 13,845 family physicians short.

This means that about 9.6 million Canadians could be without a family physician in the next decade. The consequences of this shortage could be dire, leading to delayed or inadequate care, increased costs, and a strain on other parts of the healthcare system.

With only about 1,550 family physicians completing residency in 2022, the current pipeline of graduates is insufficient. What needs to be done?

Increasing numbers is essential, but will not suffice to meet the demands of a growing and aging population. We need a comprehensive strategy, and five well-established strategies can help.

First, we need to increase the number of training positions for prospective family doctors and accelerate pathways for international medical graduates to enter family medicine, whether direct-to-practice or through residency positions.

Second, administrative processes need to be streamlined to reduce family physicians’ unnecessary workload, freeing more time for direct patient care.

Another strategy is to introduce payment models such as capitation or bundled payments that better support family physicians, making family practice more attractive and encouraging more patient enrolment and after-hours care.

As well, allowing other primary-care providers, such as nurse practitioners and pharmacists, to take on a broader range of responsibilities could assist with sharing the workload and improving patient access.

Finally, developing and expanding team-based models of care that bring together health-care professionals to provide comprehensive and continuous patient care could also benefit Canadians.

The good news is that some of these steps are starting in some provinces.

Nova Scotia is advancing on all fronts; creating a new designated pathway to residency for international medical graduates; committed to reducing physician red tape by 80 percent  by 2024; is a leader in paying family physicians with alternate payment; introduced pharmacist-delivered primary care for 31 minor ailments; and expanded team-based care at new and existing locations. Similarly, British Columbia and Ontario have made notable advancements in several of the five strategies.

Improving primary-care access is a nationwide challenge that requires concerted efforts and innovative solutions. By learning from the policies and experiences of different provinces, Canada can develop and implement effective strategies to ensure every Canadian has access to a family physician and the primary care they need. Canada’s health-care system – and the health of its people – depends on it.

For the Silo, Tingting Zhang -Junior Policy Analyst at the C.D. Howe Institute.

Supplemental- Canada’s Lack Of Residencies For Foreign-Trained Doctors Fuelling Healthcare Labour Shortage

How Canada Can Make Faster Major Project Decisions

June,2024 – Lengthy delays and regulatory uncertainty is deterring investment in major infrastructure projects in Canada, according to a new report from the C.D. Howe Institute. In “Smoothing the Path: How Canada Can Make Faster Major-Project Decisions”, authors Charles DeLand and Brad Gilmour find that Canada’s regulatory approval process is creating high costs for investors and preventing critical projects in hydrocarbon production, mining, electricity generation, electricity transmission, ports and other infrastructure from being built.

Sectors that have historically driven business investment and productivity in Canada—mining, oil and gas—are most affected by complex regulatory procedures.

While investments in these sectors have supported high incomes for workers and high revenues for government in the past, they are now trending downwards. “Canada is struggling to complete large infrastructure projects in a reasonable time frame and at a reasonable price and the proposed amendments to the Impact Assessment Act (IAA) are insufficient,” says Gilmour.

  • Canadians have been debating whether Canada’s regulatory and permitting processes strike the right balance between attracting investments in major resource projects and mitigating potential harm from those investments.
  • These regulatory processes typically apply to complex and expensive projects, such as mines, large hydrocarbon production projects (oil sands, liquefied natural gas [LNG], offshore oil), electricity generation (hydroelectric dams, nuclear), electricity transmission (wires), ports and oil or natural gas pipelines. These projects often involve multiple levels of jurisdiction and can prove particularly slow to gain government approval.
  • Canada struggles to complete large infrastructure projects, let alone cheaply and quickly. We propose improving major project approval processes by: (a) ensuring that provincial and federal governments respect jurisdictional boundaries; (b) leaving the decision-making to the expert, politically independent tribunals that are best positioned to assess the overall public interest of an activity; (c) drafting legislation with precision that focuses review on matters that are relevant to the particular project being assessed; and (d) confirming the need to rely on the regulatory review process and the approvals granted for the construction and operation of the project.

The Full Report

Canada Debt Becoming Unmanageable Economists Warn

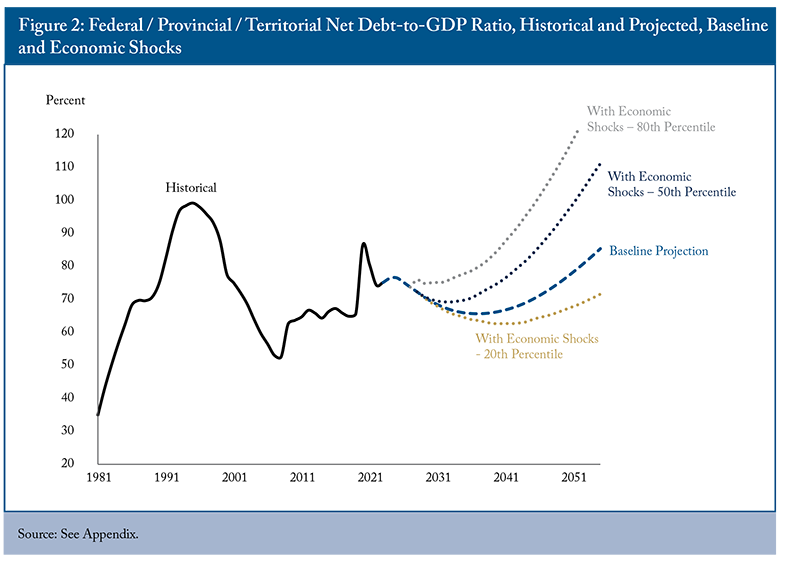
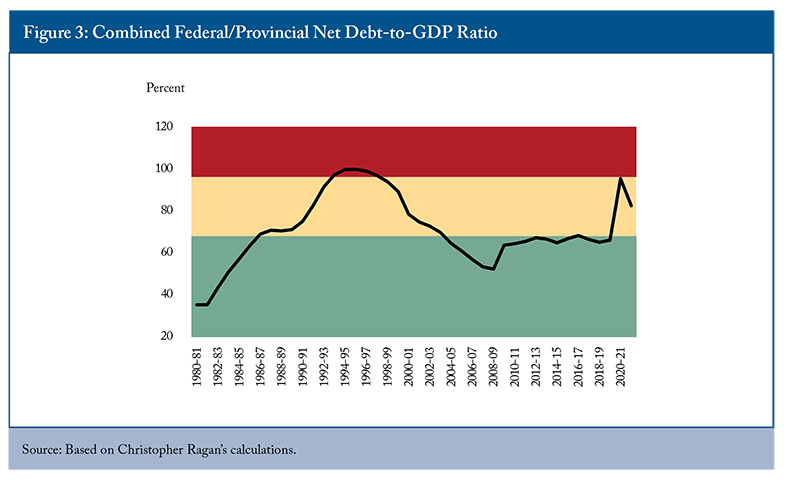
With the Canadian government’s high debt-to-GDP ratios, such as a ratio of debt to nominal GDP sitting at 68 percent in March 2023, economists warn that government debt could become unsustainably high if Ottawa fails to reduce spending, increase productivity, and re-establish business confidence.

“We’re not growing our income per capita, which means that we’re not going to get the tax revenues that we need, plus we’re getting a lot of people retiring. So the situation could end up becoming quite unmanageable if we keep our pace that we’re going,” said Jack Mintz, president’s fellow at the University of Calgary’s School of Public Policy.

The federal government has run back-to-back budget deficits since the 2008 financial recession, with government spending spiking during the COVID-19 pandemic. As a result, Canada’s debt as a percentage of nominal GDP rose from around 51 percent in 2009 to 74 percent by 2021, for example. Nominal refers to the current value for the particular year without taking inflation into account.

The two previous federal budgets have attempted to lower government spending, but the federal government will still post a $40 billion deficit in 2023–24, which they project will shrink to a $20 billion deficit by 2028–29.

The Liberal government’s response to criticism by the opposition that Canada’s debt could lead the country into a financial crisis has been that Canada has among the best debt-to-GDP ratios in the G7.

According to Mr. Mintz, while Canada’s debt situation is not as bad as it once was, it doesn’t mean that it may not impact Canada’s prosperity prospects.

Conrad Black: Budget 2024 Is an Assault on Canadian Investment

ANALYSIS: Higher Income Taxes Not Only for Wealthy in Budget 2024

Mr. Mintz points out that Canada’s debt situation is not nearly as bad as in 1996. The government’s ratio of debt to nominal GDP ratio reached 83 percent that year.

Mr. Mintz also noted that Canada continues to have a triple-A credit rating according to the world’s leading credit agencies, meaning the country’s debt is not yet seen as problematic.

“We’re still viewed as having a much better credit line compared to a number of other countries. … But at some point, the credit agencies might look at that gross debt number and start asking the question, ‘Is it starting to become unsustainable?’” he said.

Lower Productivity Hampering Debt Payments

The federal government’s ability to pay off its debt could be hampered by low productivity, according to Steve Ambler, professor emeritus of economics at Université du Québec à Montréal.

“The thing that worries me in terms of federal government debt is we are currently in a period of extremely low productivity growth and low overall growth,” he said.

In March, the Bank of Canada’s senior deputy governor Carolyn Rogers warned that Canada’s poor productivity had reached emergency levels.

Although Statistics Canada said the country’s labour productivity showed a small gain at the end of 2023, that came after six consecutive quarters of productivity decline.

The right honourable Jean Chrétien.

Mr. Ambler said an appropriate way to lower the debt-to-GDP ratio is to keep government spending from increasing while also raising productivity to increase tax revenues. He said this was the strategy of Prime Minister Jean Chrétien, whose Liberal government established a budget surplus in three years by growing the economy and keeping government spending stagnant.

To lower Canada’s debt-to-GDP ratio, Mr. Ambler said the government should focus on increasing worker productivity, allowing its resource sector to grow, and easing back on discretionary spending.

He also cited a November 2023 C.D. Howe paper showing that business investment per worker in Canada has shrunk relative to the United States since 2015. Investments such as better tools for workers would increase productivity, while productivity growth would in turn create opportunities and competitive threats that spur businesses to invest, the paper said.

“Re-establishing business confidence would be almost the number one priority, especially in the resource sector,” Mr. Ambler said, adding that a future government might also be wise to lower the feds’ “wildly extravagant subsidy programs” for the electric vehicle (EV) sector.

The Liberal government has given tens of billions of dollars in subsidies for EV manufacturing projects in Canada since 2020, saying the factories will eventually create thousands of new jobs.

‘No Cushion’ to Mitigate Debt Issue

Joseph Barbuto, director of research at the Economic Longwave Research Group, has a more pessimistic view of Canada’s debt. He says that while federal debt is at levels similar to the 1990s, the crisis will be “larger” because the government does not have the “fiscal room to mitigate the downturn.”

Mr. Barbuto said that while the Canadian government was able to help alleviate its debt issues in the 1930s and 1990s by lowering its interest rates, it does not have that same luxury in 2024. The Bank of Canada lowered its key policy rate from 1.25 percent to 0.25 percent in 2020, and was forced to raise it to 5 percent by 2023 in response to rising inflation.

“There’s no interest rate cushion on the other side. Interest rates can only fall back to zero,” Mr. Barbuto said, noting that higher interest rates make it more difficult for governments to service their debt.

“The problem with the monetary system is there’s no fiscal discipline that is pushed on governments, unlike [individuals] or corporations,” he said.

“There will be a point where because of the accumulated interest with rising interest rates, eventually it’s going to overwhelm the government and then people will not lend the government any kind of capital.”

Mr. Barbuto also expressed concern over Canada’s private debt-to-GDP ratio. Private debt refers to debt owed by private, non-financial entities such as businesses and households, as opposed to public debt owed by governments and banks. Canada’s ratio of private debt to nominal GDP sat at 217 percent in December 2023 compared to 124 percent in 1995.

Mr. Barbuto said Canada’s private debt-to-GDP ratio is higher than that of Japan’s in the 1990s, and pointed out that the Japanese economy had stagnated after the country’s asset price bubble burst in 1992.

The research director believes the Canadian economy will eventually see a debt crisis and collapse in real estate that will result in austerity measures, a shrinkage in the size of government, and the “creative destruction” of the old political and economic system. He said this would be the continuation of an economic cycle that has repeatedly happened throughout history.

“[It’s] inevitable and necessary. A debt detox or deleveraging is the same thing as a drug detox. Nobody likes it, … but it’s a necessary part of the cycle for it then to go back up,” he said.

For the Silo, Matthew Horwood/Epoch Times.

Beware Of Overreach In Canada Competition Law Reforms

May, 2024 – Many of the federal government’s recent reforms in competition law sensibly strengthen the enforcement powers of the Competition Bureau and private actors seeking redress for allegedly anti-competitive behavior. However, amendments to the Competition Act that simply make it easier to meet legal tests for orders against allegedly anti-competitive conduct are over-reach, says a new report by our friends at the C.D. Howe Institute.

In “Uncertainty and the Burden of Proof in Canadian Competition Law,” author Edward M. Iacobucci, a professor in corporate and competition law at the University of Toronto and Competition Policy Scholar at the C.D. Howe Institute, says that while strengthening the enforcement powers of the Competition Bureau is welcome, other amendments to the Competition Act imply more profound changes to the fundamental posture of competition law.

Specifically, there is a family of amendments and proposals to move away from the bedrock principle that the burden rests with the Bureau to prove, on a balance of responsibilities, that a merger or practice by a dominant firm is likely to be or is anti-competitive. 

For example, the author argues that lowering the burden of proof in mergers cases to “appreciable risk” of anti-competitive effects or something analogous would be a mistake.

“The overwhelming problem with this standard is that it is too easy to meet and fails to distinguish anti-competitive from benign conduct,” he states.  He also disagrees with proposals to rely on market shares rather than competitive assessments in mergers cases.  He objects in addition to abolishing the requirement to analyze anti-competitive effects in abuse of dominant position cases – recent amendments imply that pro-competitive conduct could be treated as an abuse of dominance.

Aside from competition law reform, the author notes that there are other policy reforms that could promote competition. 

 “Assuming competition has worsened in Canada, there are several remedial policies that I suspect would be far more important than competition law reform,” he says. “The OECD ranks Canada near the worst internationally in establishing regulatory barriers to competition.” 

 Regulation, internal trade barriers, restrictions on international competition and ownership, and other policies are all important contributors to reducing competition in Canada and, certainly in their collective impact, are more important than competition law, he argues.

Nevertheless, there are good reasons to take stock of Canadian competition law.

“The vulnerability of digital markets to market power stemming from network externalities and scale economies encourages reflection on whether the Competition Act continues to be suitable for present times.”

“I am skeptical of the narrative that the law requires sweeping reform to address the digital economy or to reverse a strong, secular decline in competition caused by competition law,” Iacobucci added. “But I am not skeptical that there is room for improvement. I encourage the government to focus on strengthening enforcement and to resist and even reverse recent reforms to the burden of proof.”

For The Silo, Edward M. Iacobucci, TSE Chair in Capital Markets, Faculty of Law, University of Toronto and C.D. Howe Competition Policy Scholar.

Read the full report here.

Study in Brief:

• There are good reasons to take stock of Canadian competition law. The vulnerability of digital markets to market power stemming from network externalities and scale economies encourages reflection on whether the Competition Act continues to be suitable for present times.

• Recently, a number of statutory amendments have been proposed to amend the Act, some have been tabled in Parliament and still others already adopted. The federal government recently passed consequential amendments that grant the Minister of Innovation, Science and Economic Development (ISED) the power to initiate market studies, to include scrutiny of vertical agreements as possibly anti-competitive collaborations, to repeal the efficiencies defence to mergers, and to lower the burden of proof in abuse of dominance cases.

• Many of the government’s actions to date sensibly strengthen the enforcement powers of the Competition Bureau and make it easier for private actors seeking redress for allegedly anti-competitive behaviour.

• There are, however, other actual and proposed amendments that imply profound changes to the fundamental posture of Canadian competition law. In particular there are actual and proposed amendments that move away from the bedrock principle that the burden rests with the Bureau to prove, on a balance of probabilities, that a merger or practice by a dominant firm is likely to be or is anti-competitive.

• While enhancing enforcement is welcome, legislative amendments that lower the burden of proof are a mistake.

Demand For Canada Seniors Care Is Critical

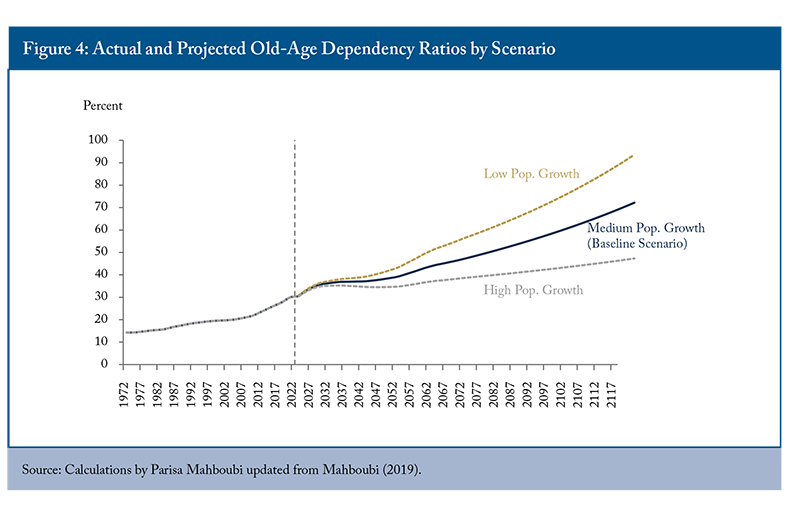
As Canada’s aging population continues to grow, there are concerns about the financial and physical capacity to meet its growing care needs.

Seniors’ need for housing and care is a complex issue involving many government policies and, therefore, government has many avenues for the exertion of control and adjustment over the issue. Much room for improvement is evident in the quality of, capacity for, and financial support for meeting these needs. This analysis provides a summary of the challenges and gaps in the current state of senior support policies and provides insights to inform future policy.

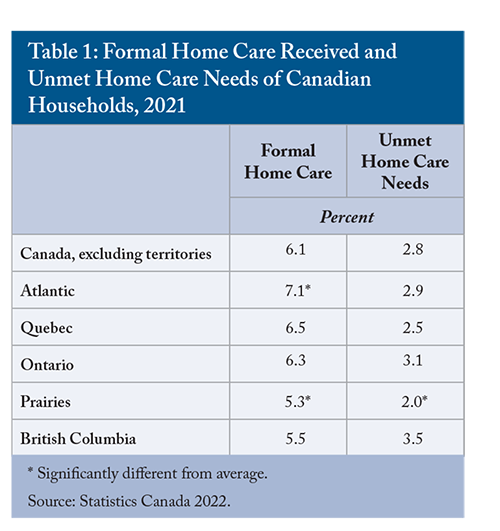
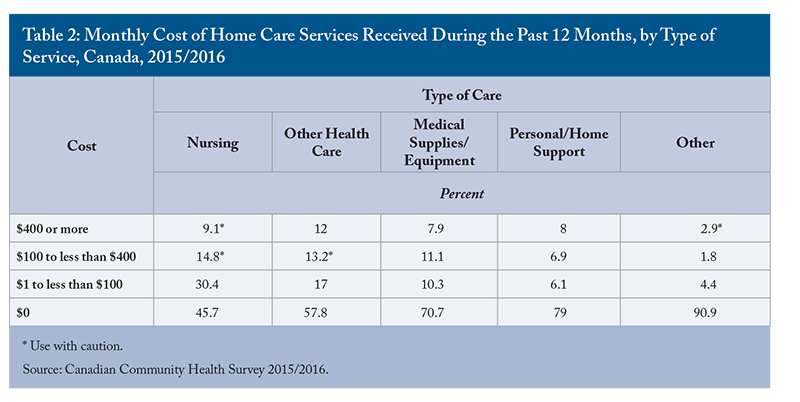
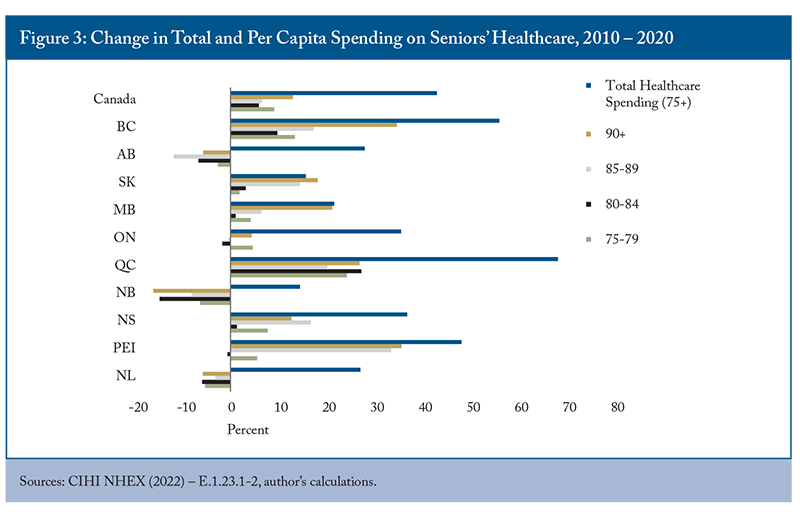
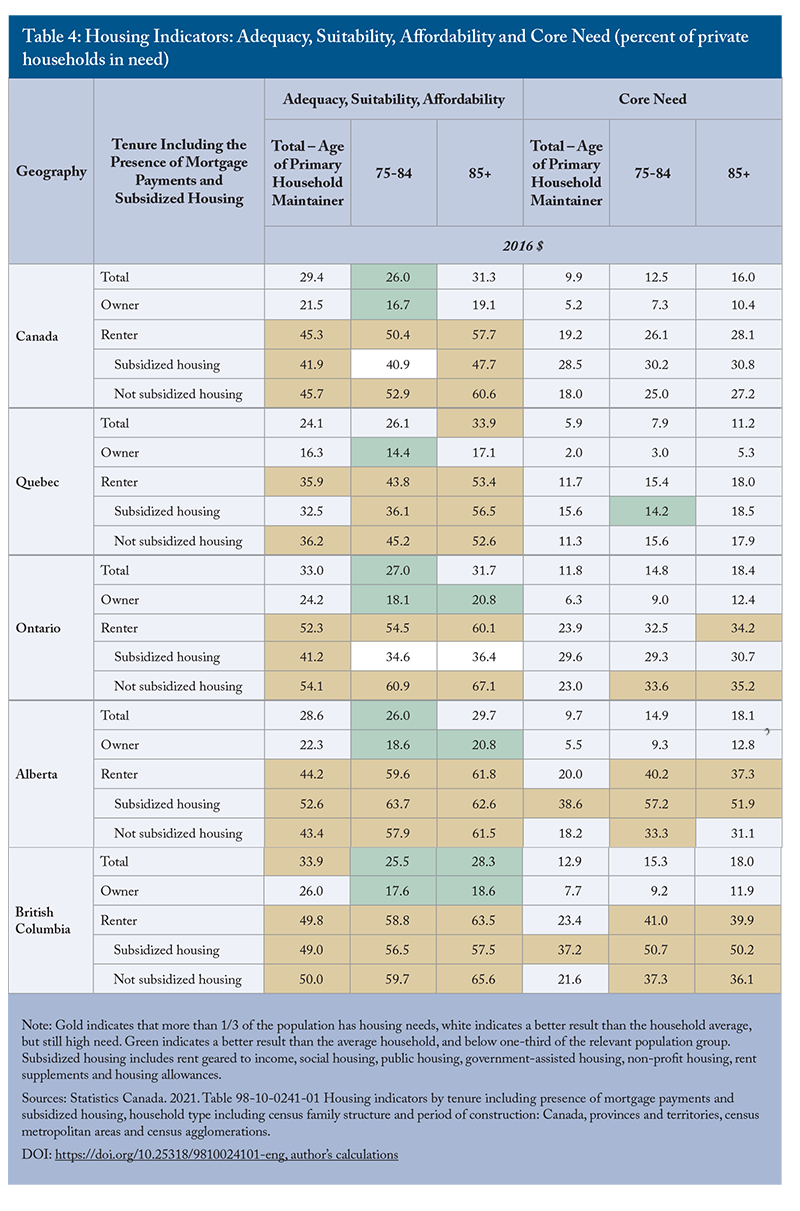
This Commentary examines the household spending patterns of seniors, the availability of different housing and care options, the costs of providing care in different settings, and government policies that subsidize support services in homes, retirement communities, and long-term care. The results show that the availability and costs of different services and types of care vary significantly across the country. In particular, seniors with below-median incomes face affordability challenges related to shelter costs, with these costs becoming a potential barrier to access to retirement homes and other support services if not publicly available. Further, there is unmet need for home care across Canada, which invests less in home and community care than other OECD countries.

To ensure there is adequate capacity to provide care for high-needs seniors, provinces should invest in expanding home and community care and prevention.

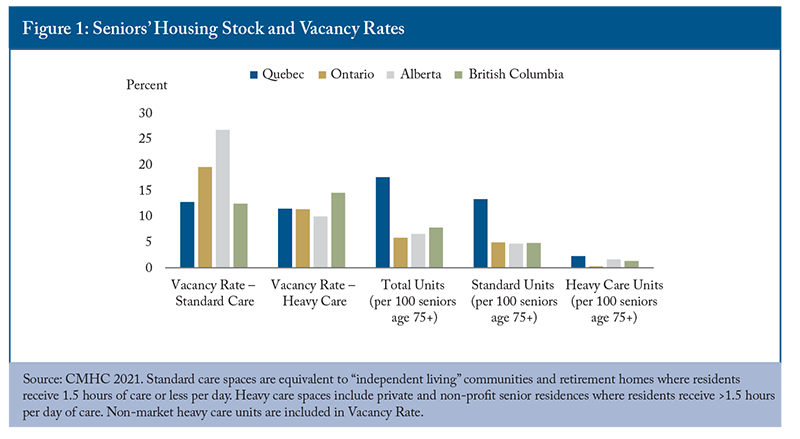
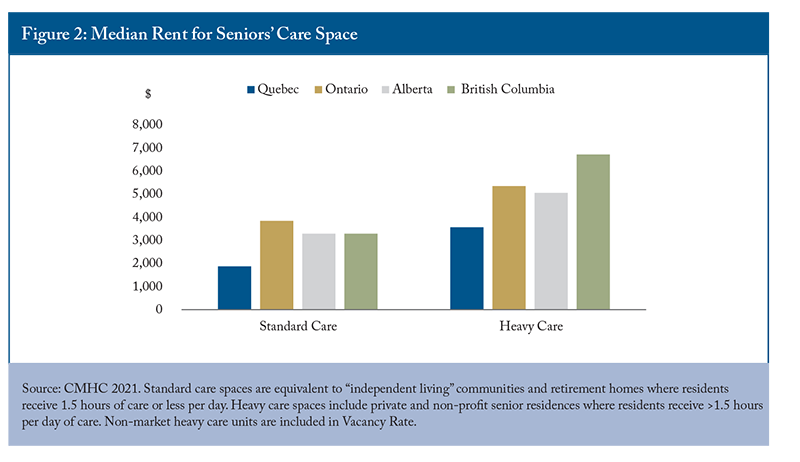
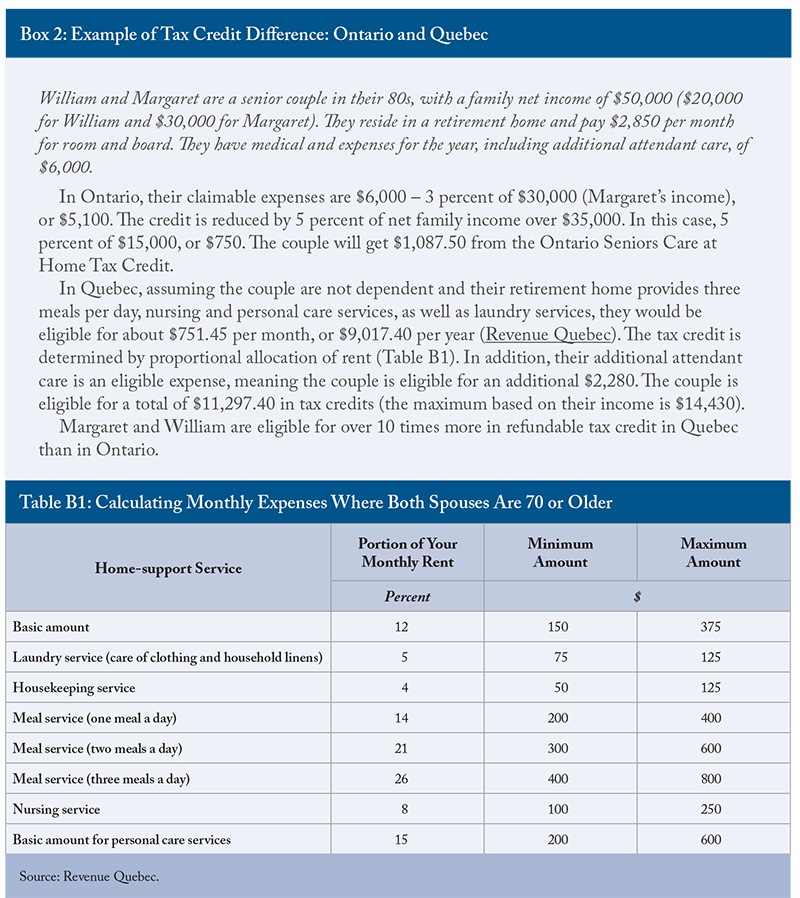
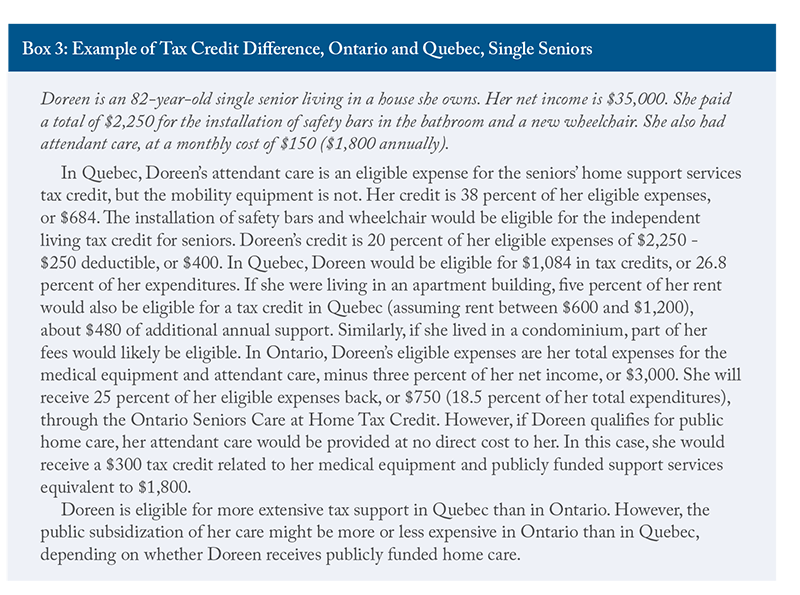
Previous research has shown that about 30 percent of entries to long-term care homes (LTC) could be delayed or prevented (CIHI 2017). Investing in expanded home and community support services and providing financial supports for low-income seniors to access the care they need where it is most appropriate, can reduce the demand for more intensive (and expensive) LTC or hospital care. There are waitlists for LTC, and “alternate level care” seniors occupying hospital beds, which contributes to higher costs, lower hospital capacity for other treatment, and lower quality of life and declining health for the affected seniors. In addition, a significant proportion of below-median-income seniors face housing affordability challenges. Ensuring housing needs are appropriately met can improve the quality of life of seniors and prevent premature entry into higher levels of care. Differences in the availability of services and how they are funded across the country can inform strategies to improve accessibility and capacity. Notably, Quebec has more seniors’ care spaces, lower vacancy rates and lower rent charges than other provinces, while providing comparatively more support to senior households through tax credits.

Overall, limited fiscal capacity, growing demand due to demographic aging, and the growing costs and complexity of care needs for aging seniors all present a significant conundrum for policymakers. There is a daunting challenge in determining the appropriate level of support, ensuring it is well targeted, and allowing for seniors to choose what is best for them. Government policies should encourage seniors to remain independent as long as possible, but also ensure they have adequate financial resources and access to support services if they are required.

Levels of Care Needs

There are multiple options for housing accommodations as seniors age, and the choice will depend on their preferences, families, level of need, and the affordability and accessibility of the various options. This section discusses the different care needs that seniors might have as they age. It also illustrates the continuum of care: seniors choosing assisted/supportive living accommodations or receiving home care will have a range of needs, and care must be flexible enough to suit an individual’s needs.

Activities of Daily Living (ADLs) are a set of essential everyday tasks and activities that individuals typically need to perform to live independently and maintain their overall well-being. These activities are often used in healthcare and long-term care settings to assess an individual’s functional abilities and to determine their level of independence. When someone experiences limitations in one or more of these areas, they may require varying degrees of assistance or care, ranging from minimal support to full-time care. Health professionals use ADL assessments to develop care plans and tailor assistance to meet an individual’s specific needs and promote their overall quality of life. The specific ADLs may vary slightly in different contexts, but the core activities are as follows.

  • Personal hygiene and grooming: including bathing/showering, caring for teeth, medication management, etc.
  • Dressing: choosing appropriate clothing and putting it on independently.
  • Eating: feeding oneself and preparing simple meals.
  • Mobility and transferring: being able to walk, get in and out of bed, or independent transferring from one surface to another (such as from a bed to a wheelchair).
  • Toileting and continence: The ability to get on and off the toilet, maintain personal hygiene, and manage incontinence, if necessary.
  • Medication management: the ability to follow medical care plans without the need for assistance or reminders to take necessary medications.
  • Instrumental Activities of Daily Living: activities that are not essential to basic self-care, but are crucial to independent living in a community such as managing finances, planning and preparing meals, doing laundry, going shopping for essential items, etc.

Notably, most of the ADLs have little to do with direct healthcare needs. Instead, they are a set of daily activities that could be provided by different types of support services including meal delivery, housekeeping, laundry services, and social activities. Seniors requiring support with some ADLs could benefit from one or more support services, even if they do not have advanced healthcare needs. Healthcare is an important component of supporting seniors to remain independent, however, many of the activities that are required for independence fall outside the traditional scope of healthcare.

The options for support available to seniors are directly related to their care needs. Those who are able to live independently can choose their accommodations based on lifestyle and preferences. Those requiring occasional or minimal assistance can remain in their homes and receive help from family, other informal caregivers, and possibly publicly funded home and personal care services, or they could choose to privately pay for some services such as regular housekeeping or food delivery services. They might also choose to move to a retirement home or community where meals and other services are provided, as well as ongoing opportunities for socialization. As care needs become more intensive, seniors may require ongoing or live-in support from a combination of public or private home and nursing care services, family, or an informal caregiver at home. In the retirement home setting, there are many options to address increasing care needs. However, as care needs become greater, affordability plays a factor in how long a senior might stay in a retirement home before moving to LTC where care needs are generally fully subsidized by government, and room and board charges are limited by regulations.1

At home, those requiring hands-on or total assistance require significant and ongoing care. At this stage, a caregiver must be available at all hours to assist with many basic ADLs, and the options for care become more limited. Those without an available caregiver in the home will likely be best served by residing in long-term care homes that have health providers on site at all times of day. Depending on their health conditions, hospice and palliative care might also be appropriate for end-of-life care. Increasing numbers of retirement homes are offering heavy care and dementia care services, and publicly funded home care can be accessed to supplement some of the costs. This still, however, presents a significant financial burden to seniors. Often, even though a retirement home can safely and appropriately meet the care needs of a senior, LTC becomes the preferred option. Most often, this is because of the cost differential between what the government will subsidize in a LTC setting versus the limited home-care services available to offset privately paid retirement home care costs.2

Availability and Options for Care Based on Needs

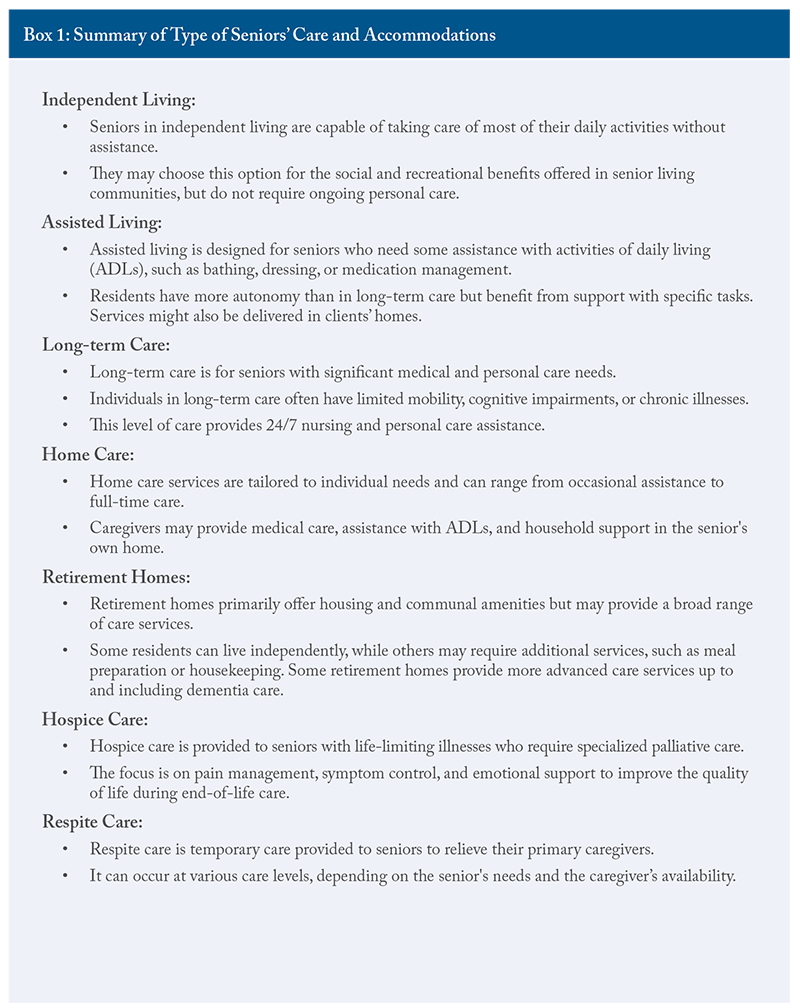
The options for care and assistance with ADLs reflect progressive levels of need. As care needs become more intense, the options become more limited (and/or costly). Those requiring ongoing care can choose to live in a long-term care home, or might be able to remain in a residential setting – home, retirement home, assisted living facility – if they and their families have the resources to supplement publicly provided services, and if the appropriate services are available privately. Of course, those that are independent have a full range of choices for where they might want to live, except those places reserved for people with higher care needs. More than three-quarters (78 percent to 91 percent) of Canadians would prefer to receive care while continuing to live in their homes as they age, but only one-quarter (26 percent) expect that they will be able to do so (Sinha 2020, March of Dimes 2021). The different types of seniors’ accommodations and short-term respite care programs are described in Box 1. It is important to note that there is overlap between many care options and levels of need – two seniors with similar care needs might use different combinations of services. This is particularly the case for people with minimal to moderate needs for support. Similarly, the options will vary in terms of availability and costs depending on the location, the ownership and operation models of the different residences, and the level of public coverage and involvement in different levels of care. The next section provides a summary of the availability and costs of various seniors’ living arrangements across the country, focusing on provinces with larger populations (BC, Alberta, Ontario and Quebec).

Long-term Care

There are 2,076 long-term care homes in Canada. At first glance, LTC in Canada appears to have a comparable amount of beds and financial resources in comparison to international peer countries. Canada has close to the average number of LTC beds relative to the size of the senior population, but still fewer than countries such as New Zealand, Finland, Germany, and Switzerland. It also has a comparable proportion of the senior population receiving LTC care and homecare, relative to international peers (Wyonch 2021). It spends more per capita than the OECD average on funding LTC but spends less than other OECD countries as a proportion of GDP. The GDP proportion of health spending for inpatient LTC is above average (Wyonch 2021).

Despite higher-than-average spending, there are long waitlists for LTC in many Canadian provinces. In Ontario, there were, as of Oct. 2022, almost 40,000 seniors waiting for LTC, and 76,000 receiving care; this means the waitlist currently exceeds 50 percent of care capacity (OLTCA).3

The median wait time was 130 days in 2021/22 (213 days for entrants from the community, and 80 days for hospital entrants) (HQO). In Quebec, the waitlist is much smaller (4,235 as of June 2023). However, seniors might still wait up to two years for a placement (Bonjour Résidences).

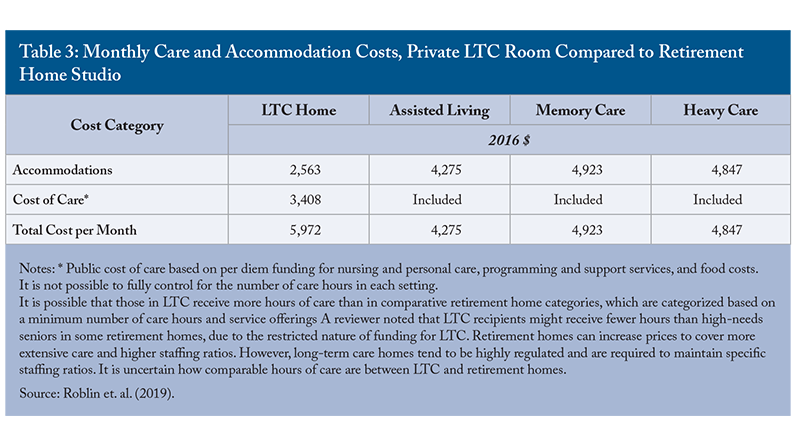
The cost of long-term care varies across provinces, but charges payable by the resident to cover room and board are generally standardized by regulation within each province. For example, in Ontario the maximum monthly co-payment for LTC is $1,986.82 – $2,838.49 depending on whether the room is shared or private. In Quebec, room and board charges for public and contracted private long-term care homes (CHSLD or centre d’hébergement et de soins de longue durée) are $1,294.50 – $2,079.90, depending on the type of room. Quebec also has unsubsidized (uncontracted) private CHSLD, where the average monthly costs are between $5,000 and $8,000, depending on resident’s needs (Bonjour Résidences).4More than half of LTC homes (54.4 percent) and the majority of retirement homes are privately owned and operated. There is no consistent ownership pattern across the country: in five provinces, the majority of LTC homes are privately owned and operated, with the other provinces having majority public ownership. All LTC homes in the Territories are publicly owned. Both publicly and privately owned LTC homes provide ongoing care for some of the most vulnerable members of society. At both public and private LTC homes, healthcare is publicly funded and most support services will be included in room and board rents. Seniors must require significant care to qualify for LTC.5

Individuals requiring support who don’t have a caregiver in the home are much more likely to be admitted prematurely to LTC homes. Indeed, about one in nine new entrants could potentially have been cared for at home or in a retirement home setting. These new residents are more likely to have previously lived alone or in a rural area where formal and informal supports are less likely to be available (CIHI 2020b).

Retirement Homes

Retirement homes offer a wide variety of services and programs targeted at different client types. These include those who are fully independent and wish to live in a congregate setting for the lifestyle and social benefits, those with mild to moderate care needs, those with heavier care needs, and those who require specific dementia care programs and supports. In Ontario, for example,15 percent of homes provide dementia care, 34 percent provide assistance with feeding, and the majority provide services to assist with other ADLs (Roblin et al. 2019). Prices of retirement home care vary significantly by location, as well as by amenities and services offered as they are market driven (and are not generally directly government subsidized). Various provinces have senior rental accommodations that provide care needs: in Quebec the services are called “seniors’ residences”; in BC “assisted living”; in Ontario “retirement homes”; and in Alberta, “supportive living.”

Many retirement homes offer more extensive health and personal care services. These additional services increase costs for seniors since they are either charged as additional services or will be incorporated into higher room and board costs. In Ontario, if these additional services are provided by the retirement home, the additional services are not directly publicly subsidized. In some cases, residents in retirement homes might also receive home care or assisted living support that is provided by a separate agency, either publicly or privately. Most retirement homes are privately owned and operated. Their activities and levels of care provision are regulated by provinces, but prices will be determined by market factors and the amenities and services offered in each location.

In Ontario, retirement communities are regulated by the Retirement Homes Act, 2010 (RHA), and are licensed and inspected by the Retirement Homes Regulatory Authority (RHRA).6Each retirement community can offer up to 13 care designated services, for example, assistance with dressing and personal hygiene, medication management, and providing meals. Services might also be publicly provided through home care. About half of seniors currently living in retirement homes have care needs that would qualify them for publicly provided home and community care. Home care services supplement the care services in the retirement home at no cost to the resident and assist with affordability of the retirement living option for seniors with care needs.

In Quebec, private seniors’ residences are rental facilities that are mainly occupied by people over 65, and offer various services such as nursing care, meal services, housekeeping, and recreation. Private seniors’ residences must hold a certificate of compliance from the Government of Quebec ensuring they comply with health and safety rules. Similarly, in Alberta, the provincial government sets accommodation standards for supportive living facilities. Supportive living operators require a licence if they provide accommodation and support services to more than three people, provide meals or housekeeping services, and arrange for safety and security services. Alberta also has Designated Supportive Living where access is determined by an assessment by a health professional, room and board charges are determined by the Alberta government, and accommodations provide 24-hour publicly funded health and personal care services on site.

In British Columbia, retirement homes are divided into categories: independent living, and assisted living.7Assisted living is divided into three classes: i) seniors and persons with disabilities who have chronic or progressive conditions, ii) mental health care, and iii) substance use care. Assisted living residences provide housing, hospitality services and support services, and they may be privately paid, publicly subsidized, or a combination of both. Independent living seniors’ residences are essentially retirement homes targeted to seniors who need minimal assistance and are not generally publicly subsidized. For seniors requiring assistance, assisted living spaces are publicly subsidized based on income: a maximum of 70 percent of after-tax income goes to housing and support services in assisted living. However, there is a minimum fee of $1,093.50 per individual ($1,665.60 per couple) and maximum monthly rate for publicly subsidized assisted living is based on market rates for rent and hospitality services in the same geographic area.

Though individual retirement homes and assisted living facilities might have waitlists, there are fewer concerns about overall capacity. Across provinces, both standard and heavy care spaces are at least 10 percent vacant (Figure 1). 

Alberta has the highest vacancy rate for standard care spaces (26.8 percent) and the lowest vacancy rate (10 percent) for heavy care spaces, suggesting a need to transition some standard spaces to heavy care spaces as the population continues to age and care needs intensify across the senior population. Ontario notably has the fewest seniors’ care spaces relative to the size of the senior population, particularly for heavy care units (3.0 spaces per 1,000 seniors over age 75). A long waitlist for LTC and few spaces for seniors with less intensive – but still significant – care needs suggest a need to expand the number of spaces available for seniors across the care continuum. Notably, British Columbia has the highest vacancy rate for heavy care spaces, despite having relatively few spaces (14.4 per 1,000 seniors over 75). It also has the highest rent among provinces for heavy care spaces ($6,726/month) and the largest increase in rent between standard care and heavy care spaces (Figure 2).

Quebec has more than three times the amount of seniors’ housing spaces in comparison to other provinces, relative to the size of the senior population. It also has the lowest median rent for both standard and heavy care spaces by a large margin. Median rent for a standard care space ($1,873/month) is about half the cost of other provinces, and a heavy care space in Quebec ($3,566/month) costs less than a standard care space in Ontario ($3,845/month).8Quebec having triple the supply but similar vacancy rates to other provinces suggests that lower prices are a result of a significantly higher supply of seniors’ care spaces. 

Demand is also likely to be higher in Quebec due to policies that indirectly support private seniors’ residences and LTC through medical expense and home care tax credits.

Home Care

Home care covers a broad range of services, including personal support for ADLs, homemaking services such as housekeeping, laundry services and meal preparation, and can include professional services such as nursing, occupational therapy, or social work. Across Canada, about 6.1 percent of households receive home care services and 2.8 percent of households have unmet home care needs (Table 1). Unmet need is highest in British Columbia and Ontario, and lowest in Quebec and Atlantic Canada. Notably Quebec and Atlantic Canada also have the highest proportion of households receiving home care.

In Ontario, publicly covered services are generally tailored to an individual’s needs and delivered in their residence (a home in the community or retirement home), following an assessment by a case manager or health professional. Services are delivered by third-party agencies that can operate on a non-profit or for-profit basis. In Quebec, seniors can access discounted home help through the Financial Assistance Program for Domestic Health Services program. After approval, seniors receive a discounted hourly rate for various home care and support services provided by qualifying domestic help and social economy businesses.9 Many services provided by home care agencies and domestic help businesses can also be purchased directly through the private market. This option gives a completely free choice of services, without the need to qualify for government assistance, but must be paid for out-of-pocket. In BC, home support services can be purchased privately, or can be publicly subsidized, based on eligibility. If publicly subsidized, home care recipients are charged a daily rate for services, based on their income.1010 In Alberta, home care is narrowly defined as providing medical support for people so they can live in their homes. After an eligibility assessment, services are provided under Alberta Health Care Insurance meaning that if a service is not insured, it is not publicly funded.

Over half of home care services are paid from government sources (52.2 percent), and 7.3 percent are covered by insurance. More than a quarter (27 percent) are paid for out of pocket (Gilmour 2018). Government sources are more likely to cover health home care services than support services. In 2015/2016, more than half of nursing care services (54.3 percent) and 42 percent of other healthcare services had a monthly cost (Table 2).

In many cases, seniors receiving home care will also receive help from informal caregivers (for example, family members, neighbors, and adult children). Informal care reduces the direct public costs of supporting a senior to maintain their independence in their home, but it can represent economic deadweight loss if informal caregivers reduce their hours of paid work.11In addition to formal in-home services, there are also seniors’ day-programs to provide care throughout the day, and respite care beds for when informal caregivers might need additional support or if the senior needs additional care for a short period of time.

Assisted Living

Depending on the jurisdiction, “assisted living” services overlap somewhat with home care and retirement home services, but generally target those with higher care needs. 

Formal Home Care Received and Unmet Home Care Needs of Canadian Households, 2021

Assisted living programs are defined differently across the country. In Quebec, “Resources intermediaries” provide housing and access to support services for individuals with minor to moderate loss of autonomy. In British Columbia, Assisted Living provides housing, hospitality, and social and recreational services to adults requiring a supportive environment due to physical and functional health challenges. In Ontario, Assisted Living Services provide support for people with special needs who require services at a greater frequency or intensity than home care, but without the medical monitoring or 24/7 nursing supervision that is provided in long-term care. Services are provided by third-party agencies that operate on a not-for-profit basis. In Alberta, Designated Supportive Living is broken down by levels of service, ranging from 24/7 provision of health and personal care services for those living independently, to providing specialized residential dementia care (AGO 2021).

Assisted living services are generally publicly funded, with limited room and board co-payments when housing is included in services. They are targeted to cover gaps in the continuum of care between independent living options and long-term care, and the services provided can overlap with both to ensure appropriate levels of support are provided and seniors are not prematurely admitted to long-term care.

Inappropriate Care Setting: ALC Patients in Hospitals

Alternate Level of Care patients are people occupying an inpatient bed, but whose needs no longer require acute level care. ALC patients occupy 12.7 to 27.5 percent of beds in acute-care centres across the provinces and represent 15.5 percent of all acute-care bed-days in Canada (excluding Quebec) in 2021-2022 (CIHI 2023). ALC patients are most often admitted to acute care as a result of an injury or illness, but subsequently cannot be discharged home as their clinical condition requires new additional support and/or care services such as home care, transfer to a long-term care facility, or another form of specialized care (rehabilitation, psychiatric or complex). In some cases, ALC patients might be admitted for predominantly social reasons: no acute or rapidly accelerating medical condition is present, but certain circumstances force patients and caregivers to turn to emergency departments (for example, real or perceived failing of social services or lack of adequate community supports) (Durante et al. 2023).

ALC patients represent a complex health system challenge with many contributing factors. Lack of access to preventative and primary care services, or to home care and other social services, can result in patients going to emergency rooms when an alternate level of care would be more appropriate. Similarly, a lack of capacity in home care or long-term care can result in ALC patients remaining in hospitals for extended periods of time. Both scenarios represent an inefficient use of limited (and expensive) hospital resources and constrain capacity to provide acute care. From a financial perspective, each ALC patients represent a cost of $730 to $1,200 per day to Canada’s healthcare systems (Whatley 2020).12

While inefficient spending is concerning, preserving limited acute care bed capacity is necessary to prevent bed shortages and ensure accessibility for Canadians. Canada has fewer hospital beds relative to the size of the population than most OECD countries, and high occupancy rates in acute care beds show that the system is strained. While there is no agreed upon “optimal” occupancy rate, 85 percent is often considered the maximum rate to reduce risks of bed shortages. The average across OECD countries was 69.8 percent in 2021. Canada was one of three countries to have a rate over 85 percent and had the fewest beds per capita in the high-occupancy group (OECD 2023).13If Canada reduced the number of ALC patients and the number of days an ALC patient spends in hospital, it could significantly reduce acute care capacity concerns. A 13 percent reduction in ALC days would be sufficient to bring acute care occupancy down to below the 85 percent occupancy threshold to prevent hospital bed shortages, since ALC patients currently occupy 15.5 percent of capacity.

There are opportunities to reduce ALC patient days, both from within the hospital setting and by improving and expanding community and support services. Increasing the number of seniors’ care spaces, increasing the scope and provision of home care, improving primary care access and ensuring that necessary support services are accessible and affordable for seniors would all alleviate the strain on hospitals by preventing admissions and allowing for more rapid discharge of ALC patients to alternate levels of care. Within hospitals, incentives for physicians, families, and the hospital generally encourage longer than optimal stays. Front-line clinical staff (especially physicians) have strong incentives to avoid conflict and risks resulting from acute-care discharges (Chidwick et al. 2017).14Hospitals in some provinces charge a daily fee to recoup the costs resulting from ALC hospitalizations. The fees are generally equivalent to the daily rates for room and board in LTC, not the full cost of an acute care bed. This means that there is little incentive for seniors or their families to prefer one care setting over the other if a patient is destined for long-term care. The hospital, however, cannot charge patients this fee unless they need continuing or chronic care – destined for more or less permanent institutional care.15Hospitals, therefore, have an incentive to designate ALC patients as chronic and in need of long-term care, so that they can recoup costs. In Quebec, hospitals do not charge fees related to ALC. In that case, seniors and their families have an incentive to prefer hospital care over home care, a retirement home or a long-term care home since these options do have financial costs. Provinces should examine their hospital fee policies related to alternate level care to ensure that clinicians, hospitals, and seniors are not incentivized to provide or receive more advanced healthcare services than are necessary to meet the needs of the patient. Hospitals should also evaluate policies and guidance for clinicians and front-line workers on making discharge decisions to reduce referral to long-term care when it can be avoided.

Addressing the unmet care and housing needs of seniors could significantly reduce the number of ALC patients and their lengths of stay in hospitals. Reducing ALC days and admissions would likely be sufficient to reduce the strain on acute care capacity to levels more comparable to international peers and reduce the risk of bed shortages.

Costs of Providing Seniors’ Care in Different Settings

Different settings and types of service provision, with different public programs and levels of subsidization, make comparison across provinces challenging. In this section, I compare public costs of seniors’ healthcare across the country and provide estimates of the public costs of care provision across different settings in Ontario and Quebec.16

Rather unsurprisingly, per capita health expenditure increases with the age of the population, since older and frailer individuals have increasingly intensive healthcare needs. There is some variability between provinces, with New Brunswick and British Columbia having lower spending per capita on care for seniors. Across the country, more than $1 of every $4 of provincial government healthcare spending goes to caring for people over 75 years of age. From 2010-2020, total provincial and territorial government spending on healthcare for the population over 75 increased by 40.5 percent to $52.77 billion, while total government spending on healthcare increased by 56 percent. In some provinces, increases in seniors’ healthcare spending have been driven by growth of the senior population (ON, NS) (Figure 3). Some provinces have contained these increasing costs by reducing per capita spending on seniors’ healthcare (NB, AB, NFL). In others, both increasing senior populations and increased per capita spending contribute to spending growth (QC, PEI, MB, SK and BC). Only in PEI and BC has spending on seniors’ care kept pace with overall increases in healthcare spending.

Meanwhile, seniors are spending more on their own healthcare and living expenses. In 2019, the average senior household (75+) spent $14,440 on housing and $3,260 on healthcare (Table 2). Healthcare costs have stayed relatively constant in real terms from 2010 to 2019, and increased less than total consumption, though private insurance premiums have increased by 117 percent. Food and shelter costs, however, have become more expensive. Seniors who rent their homes are facing challenges in addition to affordability, with more than half of those in unsubsidized rental units having inadequate, unsuitable, or unaffordable housing (Table 3). As needs increase with age, the cost and availability of options will factor into the lifestyle choices seniors make about where they live.

In Ontario, a senior with high care needs would likely qualify for long-term care or assisted living. If those services aren’t readily available, they might require a stay in hospital as they wait for an assisted living or long-term care bed to become available. Regardless of the care setting, the personal costs are similar.17

From a public finance perspective, however, there are different costs associated with different levels of care. A hospital stay for someone over 80 years of age ranges in cost from $4,306 to $11,361 per episode of care. Long-term care costs the province $5,870.70 per month per patient, and the average cost of assisted living is about $1,494 per month per patient.18Previous analysis has shown that the total cost of care is lower in heavy care retirement spaces than in LTC, and that public costs are significantly lower due to residents paying privately for services in retirement homes (Table 3). Public spending is lower if people receive advanced care services at home, or in retirement homes, than in long-term care. Hospitals are the worst option. They have the highest public cost and are also a limited resource. Every hospital bed occupied by an alternate level care patient (ALC) carries an opportunity cost and makes the bed unavailable for acute or critical care, or surgical rehabilitation and monitoring.

The picture for high needs patients in Quebec is similar to that in Ontario, but with notable distinctions. There are no private costs for a hospital stay in Quebec, and room and board charges for public LTC range from $1,294.50 per month to $2,079.90. Quebec has private LTC homes that cost residents $5,000 to $8,000 per month, depending on level of care need.19The public cost of a hospital stay for a patient over 80 years of age is higher in Quebec than in Ontario ($5,627-$14,488), as is the level of subsidization of public LTC ($5,837.73 – 9,379.60 per month per client, depending on type of room). There are similar public costs associated with a hospital stay or a month in LTC in Quebec, but the need to preserve scarce hospital resources remains, meaning that from a public cost perspective, the preference would be for high needs patients to be in LTC homes. If the senior can afford it, a heavy care bed in a private retirement home or private LTC home is most beneficial, from a public finance perspective. Research has shown that the government pays 79.7 percent of residential care costs and 81.7 percent of nursing home costs, or about $53,500 per user of a residential care facility and $82,400 per user of a long-term care facility. Comparatively, home care is estimated to cost $7,140 to $23,634 per client, depending on level of care need (Clavet et al. 2022).20

For mild to moderate needs, seniors can depend on informal caregivers, public or private homecare services, nursing services, or they can choose to live in retirement homes offering the services they need. In many cases, some combination of services is required. Home care services in Quebec can be heavily discounted depending on the level of assistance qualified for under the “Domestic Help” program. In Ontario, those qualifying for public homecare services don’t have out-of-pocket costs.21 In both provinces, homecare services can also be acquired privately, in which case there is no direct public cost.22 In both provinces, retirement homes are generally privately owned and operated and offer a variety of services across a spectrum of care needs. In Ontario, the average rent for a retirement home is $3,845 per month, representing a less affordable option when compared to average household costs.23 In Quebec, retirement homes represent a slight savings compared to the average senior household’s expenses.24Quebec has many more senior living spaces than Ontario, relative to the size of the population. It also has a much lower vacancy rate. As discussed in detail in the next section, different tax credits in each province provide different levels and types of support which likely affect both the accessibility of different types of support services and the distribution of seniors’ receiving care in each setting.

Tax Credits to Support Seniors’ Care

In addition to publicly provided services and subsidies on home and health care services, there are also tax credits that reduce the cost of support services and equipment for seniors. Quebec makes more expansive use of tax credits to support seniors remaining in their homes as they age than Ontario. People over 70 years of age in Quebec can claim up to 38 percent of eligible expenditures through the refundable tax credit for home support services.25 Services eligible for the tax credit include meal preparation or delivery services, nursing care services, home and personal care services (such as housekeepers, landscapers, or aides to assist with bathing, dressing, feeding etc.). For homeowners, only eligible services can be refunded. For tenants, however, a portion of rent can be considered if it includes eligible home support services. Similarly, retirement home residents can claim the portion of their rent that relates to meal preparation and home care services. The total amount that can be refunded takes into account total income, level of dependence, family structure, and the eligible expenses incurred throughout the year. An independent senior could qualify for a maximum of $7,020 in refundable credits based on the maximum service spending of $19,500. Dependent seniors can be eligible for up to $9,180 in refundable credits. The credit is reduced when family income exceeds $69,040.26

In Ontario, residents over 70 years of age can claim up to $1,500, or 25 percent of eligible expenses up to a maximum of $6,000, through the Ontario Seniors Home Care Tax Credit. Eligible expenses fall into several categories including walking aids, hearing devices, wheelchairs, hospital bed for home use, oxygen, vision, dental, or home nursing care. The maximum tax credit is reduced by five percent of family net income over $35,000, meaning about a quarter of households with a member over the age of 75 will qualify for the maximum credit. Claimable expenses are amounts over 3 percent of net income. The Ontario home care tax credit covers both services and equipment but does not allow for rent deductions, while the Quebec credit is for eligible service expenses only. Notably, the level of support provided by the Ontario tax credit is lower than that in Quebec. It covers a smaller proportion of the population and refunds a significantly lower amount. See Boxe 2 for examples of the difference in refundable tax credits for a senior couple in each province.

The federal government and Quebec also offer tax credits for improving home accessibility. The federal home accessibility tax credit is available to people 65 years of age or older, or those with a disability. Eligible recipients can claim up to $10,000 related to renovations or purchasing equipment that improves the accessibility and safety of the home. The renovations must be of an enduring nature and could include wheelchair ramps, walk-in bathing installations, and support bars. Quebec’s tax credit is similar to the federal credit. The Quebec Independent Living tax credit for seniors covers 20 percent of eligible expenses over $250.

There are also tax credits to support informal caregivers. At the federal level and in Ontario and Quebec, immediate family members can claim a tax credit for providing care for a disabled relative. Quebec also offers a refundable tax credit of 30 percent of total expenses for caregivers paying for respite services that provide a short-term replacement for care and supervision of a disabled relative.27

The tax credits available to help seniors stay in their homes are quite expansive, and generally consider age and household income levels. In some cases, the tax credits have restrictive criteria, such as requiring the person receiving care to have a disability, making them more targeted to the population requiring more intensive and ongoing care. In Quebec, the home support tax credits go a step further than in Ontario by including a portion of rent related to services, making retirement home care partially eligible, and by separating tax credits related to devices and services. The tax credits are also available to different age groups: tax credits for home equipment become available at age 65 under federal and Quebec subsidies and are available to those 70 and older in Ontario. Both Ontario and Quebec have reserved tax credit eligibility for home nursing care and other home care services to those age 70 and over. The timing of the availability of tax credits loosely follows the progression of care needs as people age and is targeted at the population in need of assistance – without requiring medical assessments and case managers to determine eligibility.28

However, there is a significant difference in the level of support provided between Ontario and Quebec. As the examples in Boxes 2 and 3 show, the question of whether a senior lives in an owned home or rented accommodations (including retirement homes) significantly changes the level of tax subsidization received in Quebec, but not Ontario. In either case, seniors are likely to qualify for more refundable tax credits to support independent living in Quebec than in Ontario.

Senior Households and Spending Patterns

Developing public policies to support seniors as they age should be informed by seniors’ preferences and levels of need. Some senior households requiring lifestyle or healthcare services have the financial resources to invest in adapting their homes, or to pay for services. 

Many seniors are homeowners and have the ability to downsize or transition to a retirement home or other rented accommodations using the unlocked equity to pay for their accommodations or supplement publicly provided healthcare and lifestyle support services. A significant number of senior households, however, face affordability challenges and are in inadequate or unsuitable housing. This section provides a brief overview of the household spending patterns of seniors and their housing needs, with the aim of informing policies that best provide targeted support to seniors most in need.

The Household Spending Survey from Statistics Canada provides insights into the number, composition, and spending patterns of households across the country. According to the 2019 survey data, there were about 1,991,750 households with at least one person over the age of 75, representing 13.5 percent of the total.29 Nova Scotia has the highest proportion of households with seniors (15.24 percent) and Alberta has the lowest (10.77 percent). The data show that while the majority of households with seniors are living within their means, senior households with below-median incomes, and those who rent, are more likely to face affordability challenges or have difficulty accessing adequate and suitable housing.

Most seniors live alone or as a couple (42 percent and 35 percent, respectively). The distribution of seniors among housing types is similar to the rest of the population; a majority live in single detached houses (54 percent) and about 3 in 10 live in apartments or condos. The majority of senior households own their home without a mortgage, and seniors are more likely to own a second property than the population average. The majority of households with seniors depend on government transfers as their main source of income (52 percent), followed by other forms of income (27 percent) and employment earnings (17 percent).30In general, 75+ households have lower spending and consumption than the average household and spend a lower proportion of their income.31 Senior households spend less than the average in all categories except healthcare and custodial services (though they still spend less on household operations overall). Examining average income and consumption patterns across provinces shows that the average household with at least one person over the age of 75 can meet its needs and still reserve about 30 percent of income as savings, a similar rate to households overall.

Averages, however, can mask more worrisome spending and consumption patterns at the lower end of the income distribution. Households with below-median income have consumption expenditures that exceed their incomes.32 Shelter and food costs represent about 46 percent of consumption expenditures across lower-income households in general, and 53 percent for lower-income households with seniors. Shelter costs exceed the 30 percent affordability threshold for below-median-income households with seniors.33 It is difficult to determine the level of need from these data alone, since many seniors have significant savings to support their consumption. Lower-income seniors who do not have significant savings would be more likely to face affordability challenges. Ontario has the lowest spending on shelter for lower-income households with seniors ($8,862), and those households have significantly lower shelter costs than the average across lower-income households in the province.34 In Quebec and Alberta, shelter costs exceed 35 percent of consumption expenditure for senior households. In British Columbia, seniors who rent spend 46.1 percent of their income on shelter.

The importance of shelter costs to seniors’ expenditures, particularly below-median income households, warrants further investigation. Statistics Canada’s housing indicators provide further details. Households where the primary maintainer is over the age of 85 generally have higher rates of housing inadequacy, unaffordability, and unsuitability than the average across all households (Table 4). Seniors show higher rates of “core need” housing than the general population (see Box 4 for definitions of housing indicators).

In all major provinces, more than a third of renters are in housing that is inadequate, unsuitable, or unaffordable. There are some challenges related to housing indicators for homeowners. Rates of inadequacy, unsuitability, or unaffordability are generally lower for seniors 75+ than for the overall household average. Those who rent are more likely to face difficulties. Notably, more than a third of senior renters in ON, BC and AB cannot afford to move into more suitable housing.35 Quebec, comparatively, has lower rates of core housing need than the other provinces, suggesting that a higher proportion of households could afford to move to adequate or suitable housing. This implies that Quebec has fewer affordability challenges relative to the other provinces, particularly for renters and seniors, despite similar levels of inadequate, unsuitable, or unaffordable housing.

As seniors age, it becomes more likely that they will downsize housing to unlock equity and/or move to more appropriate housing. Similarly, they might choose to transition to renting accommodations in seniors’ care spaces. Between 2016 and 2021, 36 percent of over-75 households sold their homes (CMHC 2023).36This rate has declined over time, showing that more and more seniors are remaining independent for longer and choosing to remain in their homes as they age. Older seniors are more likely to transition to rented accommodations (including private market rental units, retirement homes and LTC) and are also more likely to require supportive services. Declining rental rates and a higher proportion of seniors owning their homes shows a preference for aging-in-place and shows that many seniors can maintain their independence for longer than seniors in previous cohorts. Most seniors would prefer to age in their homes, but many are concerned that they won’t be able to afford to do so. Some seniors are pooling their resources and investing in shared accommodation and care services (Sylvestre-Williams 2024).

There are also “naturally occurring retirement communities” when the majority of inhabitants of a multi-unit dwelling are seniors, or seniors choose to purchase housing in close proximity to each other. These naturally occurring communities could provide opportunities to improve the efficiency of home and community care services. They also reveal the preferences for housing and support services of seniors with adequate financial resources to be strategic and plan for their desired retirement. This could provide insights for new models of seniors’ care that reduce costs by supporting the independence of lower-wealth seniors and encouraging seniors with means to contribute to the costs of their support services.

Overall, the data on household spending and income show that the average household is able to afford its needs, although spending patterns change with age and require higher healthcare expenditures. In general, 75+ households have lower spending and consumption than the average household.37 Seniors that have below-median incomes, however, are facing affordability challenges similar to other households in the category, particularly with regard to shelter. These insights suggest two important factors to consider in developing seniors’ care and support policies. First, many senior households have sufficient resources to fund some lifestyle support and healthcare services, meaning there could be opportunities to develop markets for seniors’ support services to supplement the under-provision of publicly provided home care. Second, some seniors are facing affordability challenges, meaning targeted support policies that holistically consider housing, support, and healthcare needs could reduce the likelihood that these seniors will prematurely enter long-term care or become ALC patients in hospitals. For the Silo, Rosalie Wynoch /C.D. Howe Institute.

Read the full report here.

References


Clavet, Nicholas-James, Réjean Hébert, Pierre-Carl Michaud, and Julien Navaux. 2022. “The Future of Long-Term Care in Quebec: What Are the Cost Savings from a Realistic Shift toward More Home Care?” Canadian Public Policy 48: 35-50.

Canadian Institute for Health Information. 2017. “Seniors in Transition: Exploring Pathways Across the Care Continuum.” Available at https://www.cihi.ca/en/seniors-in-transition-exploring-pathways-across-the-care-continuum

_____________. 2023. Inpatient Hospitalization, Surgery and Newborn Statistics, 2021-2022. Available at https://www.cihi.ca/en/hospital-stays-in-canada-2021-2022

Canadian Mortgage and Housing Corporation. 2023. Housing Market Insights. https://assets.cmhc-schl.gc.ca/sites/cmhc/professional/housing-markets-data-and-research/market-reports/housing-market-insight/2023/housing-market-insight-canada-m11-en.pdf

Chidwick, Paula, Jill Oliver, Daniel Ball, Christopher Parkes, Terri Lynn Hansen, Francesca Fiumara, Kiki Ferrari et. al. 2017. “Six Change Ideas that Significantly Minimize Alternate Level of Care (ALC) Days in Acute Care Hospitals.” Healthcare Quarterly 20(2): 37-43.

Durante, Stephanie, Ken Fyie, Jennifer Zwicker, and Travis Carpenter. 2023. “Confronting the Alternate Level Care (ALC) Crisis with a Multifaceted Policy Lens.” Briefing Paper. University of Calgary School of Public Policy 16(1). Available at https://journalhosting.ucalgary.ca/index.php/sppp/article/view/76748

Nuernberger, Kim, Steve Atkinson, and Georgina MacDonald. 2018. “Seniors in Transition: Exploring Pathways Across the Care Continuum”. Healthcare Quarterly 21(1): 10-12.

Office of the Auditor General of Ontario (AGO). 2021. Value-for-money audit: assisted living services. December. Available at https://www.auditor.on.ca/en/content/annualreports/arreports/en21/AR_AssistedLiving_en21.pdf

Gilmour, Heather. 2018. Formal home care use in Canada. Statistic Canada. September 19. Available at https://www150.statcan.gc.ca/n1/pub/82-003-x/2018009/article/00001-eng.htm#archived

Organisation for Economic Co-operation and Development (OECD). 2023. Hospital Beds and Occupancy. Health at a Glance 2023: OECD indicators. Available at https://oecd-ilibrary.org/sites/bdd23022-en/index.html?itemId=/content/component/bdd23022-en

Roblin, Blair, Raisa Deber, Kerry Kuluski, and Michelle Pannor Silver. 2019. “Ontario’s Retirement Homes and Long-term Care Homes: A Comparison of Care Services and Funding Regimes.” Canadian Journal on Aging / La Revue canadienne du vieillissement 38(2): 155–167.

Statistics Canada. 2022. Home care use and unmet home care needs in Canada, 2021. Available at https://www150.statcan.gc.ca/n1/daily-quotidien/220826/dq220826a-eng.htm

Statistics Canada. 2019. Survey of Household Spending. public use microfile.

Sylvestre-Williams, R. 2024. Don’t want to end up in a nursing or retirement home? Some seniors are finding creative solutions – on their own terms. Toronto Star. March 18. Available at https://www.thestar.com/business/personal-finance/dont-want-to-end-up-in-a-nursing-or-retirement-home-some-seniors-are-finding/article_1253a964-d26f-11ee-964a-c71e7e78215f.html

Whatley, Shawn. 2020. “Patient Hotels: An Established Transitional Solution to Overcrowding.” The Hill Times. February 3. Available at https://www.hilltimes.com/2020/02/03/ patient-hotels-an-established-transitional-solution-to-overcrowding/233033.

Wyonch, Rosalie. 2021. Ounce of Prevention is Worth a Pound of Cure: Seniors Care in Canada After COVID-19. Commentary. C.D. Howe Institute. Available at https://www.cdhowe.org/public-policy-research/ounce-prevention-worth-pound-cure-seniors-care-after-covid-19

How Canada Can Help Repair Today’s Global Trading System

The article below (Furthering the Benefits of Global Economic Integration through
Institution Building: Canada as 2024 Chair of CPTPP) was first published by the C.D. Howe Institute by Paul Jenkins and Mark Kruger.

Introduction

Over the last 10 to 15 years, the global economy has become fragmented. There are many reasons for this fragmentation – both economic and geopolitical. A particularly important factor has been the inability of the institutions that provide the governance framework for international trade and finance to adapt to the changing realities of the global economy.

This erosion is reflected in the cycles of outcome-based measures of globalization, such as trade-to-GDP ratios. Research indicates that the development of institutions that promote global integration is highly correlated with more rapid economic growth. To secure the benefits of economic integration, the international community should re-commit to a set of common rules. This should involve the renewal of existing institutions in line with current economic realities.


But institutional renewal alone is not sufficient. Nurturing and growing new institutions are also critical, especially ones reflecting the realities of today’s global economy. Most promising in this regard is the Comprehensive and Progressive Agreement for Trans-Pacific Partnership (CPTPP).


The CPTPP is seen as a “next generation” trade agreement. It takes World Trade Organization (WTO) rules further in several key areas, such as electronic commerce, intellectual property, and state-owned enterprises.
Expansion of CPTPP represents a unique opportunity to strengthen global trade rules, deepen global economic cooperation on trade and sustain an open global trading system. The benefits for Canada of an expanded CPTPP are further diversification of its export markets and deepened ties with countries in the Indo-Pacific region.

Trusted Policy Intelligence


The challenge to enabling broad-based accession to CPTPP is geopolitical, reflecting the rising aspirations of the developing world, the associated
heightened contest between democracy and autocracy, and the prioritization of security. Indeed, for many, today’s security concerns are at the forefront, trumping economic issues. We argue that recognition of the economic benefits
of global economic integration must also remain at the forefront, and that research presented in this paper shows that institutional building is at the core
of securing such benefits.


As 2024 Chair of the CPTPP Commission, Canada has an opportunity to play a leadership role, as it did in the creation of the Bretton Woods institutions 80 years ago, by again promoting global institution building, this time through the successful accession of countries to the CPTPP, both this year and over the long run.

  1. Cycles in Global Economic Integration
    Former US Fed Chair Bernanke points out that the process of global economic integration has been going on for centuries. New technologies have been a major force in linking economies and markets but the process has not been a smooth and steady one. Rather, there have been waves of integration, dis-integration, and re-integration.
    Before World War I, the global economy was connected by extensive international trade, investment, and financial flows. Improved transportation – steamships, railways and canals – and communication – international mail and the telegraph – facilitated this “first era of globalization.” The gold standard linked countries financially and promoted currency stability. Trade barriers were reduced by the adoption of standardized customs procedures and trade regulations. The movement of goods, capital, and people was relatively unrestricted.
    The outbreak of World War I frayed global economic ties and set the stage for a more fragmented interwar period. The Treaty of Versailles imposed
    punitive measures on Germany, exacerbating economic hardships. Protectionist policies, such as high tariffs and competitive devaluations, became widespread as countries prioritized domestic interests.
    The collapse of the gold standard further destabilized international finance. In contrast to the cooperation seen before the war, countries pursued economic nationalism and isolationism.
    Protectionism increased in the 1930s as a result of the dislocation caused by the Great Depression. In an attempt to shield domestic industries from foreign competition and address soaring unemployment, many countries imposed tariffs and trade barriers.
    The Smoot-Hawley Tariff Act in the United States exemplified this trend, triggering a series of beggar-thy-neighbour policies. These protectionist policies exacerbated the downturn and contributed to a contraction in international trade that worsened the severity and duration of the Great Depression.
    Mindful of the lessons of the 1930s, a more liberal economic order was established in the aftermath of World War II. The creation of the Bretton Woods Institutions – the International Monetary Fund (IMF), the World Bank and the General Agreement on Tariffs and Trade (GATT) – provided the principal mechanisms for managing and governing the global economy over the second half of the 20th century.
    Building on the GATT, the formation of the World Trade Organization in 1995 provided the institutional framework for overseeing international trade and settling disputes. China became the 143rd member of the WTO in 2001 and almost all global trade became subject to a common set of rules.
    The rise and fall of international economic governance are reflected in the cycles of outcome-based measures of globalization. Looking at trade openness, i.e., the sum of exports and imports as a percentage of GDP, the IMF divides the process of global integration into five periods: (i) the
    industrialization era, (ii) the interwar era, (iii) the Bretton Woods era, (iv) the liberalization era, and (v) “slowbalization” (Figure 1).
    Many factors have contributed to the plateauing of trade openness in the last 10 to 15 years. The fallout from the Global Financial Crisis was severe and the recovery was tepid. Brexit, with its inward-looking perspective, has disengaged the UK from Europe.
    Populist protectionism has led to “re-shoring” in an effort to address rising inequalities and labour’s falling share of national income. There has been far-reaching cyclical and structural fallout from COVID-19.
    And while the AI revolution portends significant opportunities, uncertainties over labour displacement abound.
    Geopolitics has also played a critical role. Security concerns have become more important, trumping economic issues in the eyes of many. This has led to multiple sanctions, along with export and investment controls, being imposed to protect national security interests.
    The IMF has carried out several modelling exercises that estimate the consequences of fragmentation if further trade and technology barriers were to be imposed. The studies employ a variety of assumptions regarding trade restrictions and technology de-coupling. In summary, the cost of further fragmentation ranges from 1.5 to 6.9 percent of global GDP. As with all modelling exercises, a degree of caution is warranted. At the same time, these studies should not be viewed as upper-bound estimates because they disregard many other transmission channels of global economic integration.
  2. De Jure and De Facto Globalization
    In assessing the evolution of globalization, however, it would be misleading to focus too narrowly on outcome-based measures such as the trade-to-GDP ratio depicted in Figure 1.
    The data compiled by KOF, a Swiss research institute, provide a more nuanced view of global economic integration. KOF constructs globalization
    indices that measure integration across economic, social, and political dimensions. Its globalization indices are among the most widely used in academic literature. KOF’s data set covers 203 countries over the period 1970 to 2021. Our focus here is on KOF’s economic indices.
    In terms of economic globalization, KOF looks at the evolution of finance as well as trade. Moreover, one of the unique aspects of KOF’s work is that it examines globalization on both de facto and de jure bases.
    KOF’s de facto globalization indices measure actual international flows and activities. In terms of trade, it includes cross-border goods and services flows and trading partner diversity. For financial globalization, its indices measure stocks of international assets and liabilities as well as cross-border payments and receipts.
    KOF’s de jure globalization indices try to capture the policies and conditions that, in principle, foster these flows and activities. For trade globalization,
    these include income from taxes on trade, non-tariff barriers, tariffs, and trade agreements. De jure financial globalization is designed to measure the institutional openness of a country to international financial flows and investments. Variables to measure capital account openness, investment restrictions and international agreements and treaties with investment provisions are included in these indices.
    The trends in KOF’s de facto and de jure economic globalization indices are shown in Figure 2. Both globalization measures increased rapidly from 1990
    until the Global Financial Crisis. Both measures subsequently plateaued. In 2020, as the global pandemic took hold, the de facto index plunged to its
    lowest level since 2011. In 2021, it recovered half of the distance it lost the previous year. The de jure index has essentially been flat for the last decade.
    There has been a sharp divergence between KOF’s de facto and de jure trade globalization measures in the last five years (Figure 3). By 2020, de facto trade globalization had dropped to a 25-year low. Although it recovered somewhat in 2021, it remains well below the average of the last decade. In contrast, de jure trade globalization levelled off after the Global Financial
    Crisis. It reached a modest new high in 2019 and has essentially remained there since then.
    The trends in financial globalization are almost the reverse of those of trade globalization. De facto financial globalization continued to increase through
    2020 and dipped slightly in 2021. De jure financial globalization has been essentially flat over the last two decades (Figure 4).
    The KOF researchers provide convincing econometric evidence that economic globalization supports per capita GDP growth. Importantly,
    their analysis shows that institutions matter. They demonstrate that the positive impact on growth from trade and financial globalization comes from
    institutional liberalization rather than greater economic flows. Through a series of panel regressions, the researchers show that it is the de jure trade and financial globalization indices that are correlated with more rapid per capita GDP growth. In contrast, there is no significant relationship between growth and the de facto indices.
    KOF’s conclusions are consistent with the work of Rodrik, Subramanian and Trebbi who examine the contributions of institutions, geography, and trade
    in determining relative income levels around the world. They find that institutional quality “trumps everything else.” Once institutions are controlled for, conventional measures of geography have weak effects on incomes and the contribution of trade is generally not significant.
    Thus, to recapture the economic benefits of free trade and open markets, countries need to recommit to finding ways to further de jure globalization; that is, putting in place the institutional building blocks in
    support of enhanced trade and financial integration.
  3. Geopolitical Realities
    Institutional reform, however, requires trust and mutual respect among partners. Many would argue that such trust and respect is in limited supply
    today, especially between the United States and China. The United States is willing to endure the costs of heightened protectionism to purportedly
    strengthen the resilience of its economy and secure greater political security. This has resulted in multiple sanctions, particularly in areas of digital technologies.
    In response, China, amongst other measures, has imposed export controls on critical minerals used in advanced technology in defence of its geopolitical goals.
    Yet, as discussed by Fareed Zakaria in a Foreign Affairs article, The Self-Doubting Superpower, China has become the second largest economy in the world richer and more powerful within an integrated global economic system; a system that if overturned would result in severely negative consequences for China.
    For the United States, its inherent strength has been its commitment to open markets and its vision of the world that has considered the interests of others. In many respects, it remains uniquely capable of playing the central role in sustaining the global economic system.
    Following a recent trip to China, Treasury Secretary Yellen stated that “the relationship between the United States and China is one of the most consequential of our time,” and that it “is possible to achieve an economic
    relationship that is mutually beneficial in the long-run – one that supports growth and innovation on both sides.”
    This means that the United States would need to accommodate China’s legitimate efforts to sustain a rising standard of living for its citizens, while
    deterring illegitimate ones. For China, it would mean a clear and abiding commitment to an open, rules-based global economic system.
    It appears that there is currently no clear path forward for this change in mindset, given what many see as insurmountable geopolitics in both the United States and China. Yet, history shows that achieving and sustaining long-term economic growth is in every country’s best interest, and that such growth is best secured through ongoing global economic integration.
  4. A Way Forward
    Recent discussions at the IMF’s Annual Meeting in Marrakech about IMF quota reform, including quota increases and realignment in quota shares to
    better reflect members’ relative positions in the global economy, are important signals of possible renewal.
    Similarly, calls to revamp the World Bank’s mandate, operational model, and ability to finance global public goods, such as climate transition, reflect a growing consensus that the Bretton Woods Institutions must change in the face of today’s realities.
    But institutional renewal alone is insufficient.
    Broad-based accession to the CPTPP represents a unique opportunity to strengthen global governance overall, and to address common challenges in ways that benefit both countries as well as the global economy.
    The CPTPP sets a high bar, requiring countries to:
  • eliminate or substantially reduce tariffs and other
    trade barriers;
  • make strong commitments to opening their markets;
  • abide by strict rules on competition, government
    procurement, state-owned enterprises, and
    protection of foreign companies; and
  • operate within, as well as help promote, a
    predictable, comprehensive framework in the critical
    area of digital trade flows.
    The United Kingdom formally agreed to join the
    CPTPP in July 2023. Once its Parliament ratifies
    the Agreement, the UK will join Australia, Brunei
    Darussalam, Canada, Chile, Japan, Malaysia, Mexico,
    New Zealand, Peru, Singapore, and Vietnam in the
    trading block.
    Such a diverse membership clearly demonstrates
    that countries do not have to be geographically close
    to form an effective trading block.
    A half-dozen other countries have also applied
    to join the CPTPP, with China’s application having
    been the earliest received.
    Petri and Plummer estimate that joining the
    CPTPP would yield large economic benefits for
    China and the global economy. For the latter, the
    boost to global GDP would be in the order of $600
    billion annually. The United States in joining would
    gain preferential access to rapidly growing Pacific Rim
    markets. Much of the additional market access would
    come from China’s opening of its service sector.
    Industrial policy and state-owned enterprises,
    however, will continue to play a much larger role
    in China than they do in Western economies. The
    key for China is to demonstrate that a socialist
    market economy (i.e., one that has a mixed capitalist
    market and government-controlled economy) can be
    consistent with fair trade.
    The process of China joining the CPTPP will
    undoubtedly be time-consuming. It took 15 years of
    negotiations before China joined the WTO in 2001.
    This was five more years, on average, than it took
    those countries that joined after 1995.
    The challenge for Canada, and subsequent chairs,
    is to ensure that China’s entry maintains the high
    standards CPTPP members have met so far.
    Broad based accession to the CPTPP, including
    the United States and China, however, is best viewed
    Page 8 Verbatim
    Trusted Policy Intelligence
    as a long-term goal. China would need to undertake
    unprecedented reforms, involving complex political
    challenges, including Taiwan’s potential accession. For
    its part, the United States would need to step well
    back from its current mercantilist mind set, which
    risks worsening.

Canada as Chair in 2024

While efforts to renew existing global institutions to better reflect current economic realities are important, we see promoting broad accession to the CPTPP as the best means to turn today’s global economic fragmentation around.
At the heart of the global economic system is the open trading framework put in place at Bretton Woods in 1944. Many would see today’s fragmentation as becoming more acute, rather than getting better, due to geopolitical divisions.
But further fragmentation is no way to save the open, rules-based global trading system that has served so many countries so well for so long.


While restrictions reflecting legitimate security concerns are inevitable, an open, competitive trading system remains in the best interests of all countries.
As 2024 Chair of the CPTPP Commission, Canada has an opportunity to contribute to turning around the fragmentation of today’s global trading system and moving the global economy back along a path towards a
more open, rules-based trading system.


An important goal for Canada’s chairmanship would be to clarify the rules of accession. This would be a big step forward in sustaining expansion of CPTPP. While today’s geopolitical realities surrounding the applications of both China and Taiwan represent a particularly challenging area to advance, significant progress in other areas must be made. It should accelerate inclusion of Costa Rica, Uruguay, Ecuador, and Ukraine, all of whom have applied. And it should help move forward discussions with South Korea, Indonesia, Philippines, and Thailand, who have expressed interest in joining.


Over and above all that, however, at a more strategic level, Canada should also champion discussion and understanding of why building towards the long-run goal of broad accession to CPTPP is important. Open and inclusive institutions are at the core of providing the benefits of global economic integration to all countries.


Canada will also be Chair of the G7 Summit in 2025. This, along with the various ministerial and officials’ meetings leading up to the Summit, offers another critical avenue for Canada to take a leadership role in sustaining and promoting an open, rules-based global trading system.

    Quality Over Quantity: How Canada’s Immigration System Can Catch Up


    Canada’s immigration point system is designed to select skilled immigrants who have the potential to contribute to the country’s economic growth and meet its evolving skills needs. However, Canada faces challenges in fully leveraging increased immigration levels to enhance the well-being of Canadians due to weaknesses in capital investment and a quantity/quality trade-off in selecting economic immigrants. Furthermore, recent reforms may work at cross purposes to this goal. They include category-based selection that targets low-paying occupations, which can discourage capital investment, and a recent surge in the number of temporary residents in low-wage jobs that also may have adverse effects on the quality of potential candidates for permanent residency.
     

    This study compares skilled immigration selection policy in Canada, Australia, New Zealand, and the UK, with the objective of identifying key areas for improvement in Canadian policy. The skilled immigration point systems in Canada and Australia share some similarities, with both prioritizing a two-step immigration process, placing an emphasis on English proficiency and workforce age, and requiring pre-migration credential and English proficiency assessments. However, the two countries differ mainly in their strictness of criteria and their emphasis on occupational and language skills. Furthermore, Australia has shown more agility and creativity in its skilled migration reforms. Reforms in the UK and New Zealand have also put them ahead in the competition for talent.
     

    Based on this international comparison, the author makes recommendations for improvement. They include: 1) Setting a Minimum Points Threshold for Eligibility. As it is, Canada imposes no minimum points threshold for eligibility in its Express Entry points-based system. 2) Considering a Pre-admission Earnings Factor. Studies show the importance of pre-immigration earnings in predicting immigrants’ outcomes after arrival. The UK, New Zealand and Australia include this factor. 3) Boosting Standards under the Language Requirement. Official language skills are as important in predicting the initial earnings of principal applicants admitted under Canada’s Express Entry system as pre-immigration Canadian work experience, and even more important than educational level and age at the time of immigration. 4) Raising Business Immigration Numbers. Canada faces the challenge of weak business investment but is failing to select business immigrants with entrepreneurial skills, putting it at a disadvantage compared to competitors like Australia and the UK.

    The author thanks Tingting Zhang, Charles DeLand, Rosalie Wyonch, Charles Beach, Jodi Kasten, Mikal Skuterud and anonymous reviewers for comments on an earlier draft. The author retains responsibility for any errors and the views expressed.

    Read the full report here.

    For the Silo, Parisa Mahboubi/C.D. Howe Institute.

    Parisa Mahboubi

    Parisa Mahboubi

    Parisa Mahboubi is a Senior Policy Analyst and leads the C.D. Howe Institute’s human capital policy program. Her research interest focuses on social policy with a concentration on demographic, skills, education, and labour market concerns. In addition to authoring research studies, she regularly writes a column for the Globe and Mail’s business section.

    Canadians Should Understand Their Private Healthcare System – And How It’s Changing


    The Study in brief

    The intense debate pitting private versus public healthcare in Canada needs a reality check. Private aspects of healthcare exist in different forms and to varying degrees across Canadian provinces, largely depending on their respective legislation and regulations.
     For healthcare professionals providing insured services, most bill through the public system, but not all. The current and future scope of their role is the pressing issue at hand.


     Health Canada has had success in eliminating extra billing and user fees under sections 18 and 19 of the Canada Health Act. However, provinces have considerable authority in determining key terms like “medically necessary” or “insured services” that are covered under the Act. The result has been a diversity of approaches.
     Provinces have the legislative tools to constrain the growth of private healthcare, if that is their objective. Similarly, provinces have considerable authority to increase the scope of private healthcare, if that is their objective (even within the current parameters of the CHA), by revising provincial legislation or regulation.


     Either way, the specific policy direction undertaken would be different for each jurisdiction, as the legislative and other barriers to private healthcare (such as market size limiting the viability of private delivery) vary across provinces. This Commentary provides clarity about the different forms of “private” healthcare and a comprehensive view of the current policy landscape defining the balance between public and private healthcare.

    All health systems incorporate some mix of public and private healthcare. In 2021, public sector spending in Canada amounted to 73 percent of total healthcare expenditure, exactly equivalent to the OECD average of 73 percent (OECD 2023). Yet these summary figures tell us little about the public/private contours of any healthcare system. Private healthcare can manifest in a multitude of ways, and the precise configuration of the relationship between public and private healthcare tells us more about the system than the absolute level of public or private spending.

    Under the Canadian Constitution, provinces have wide-ranging jurisdiction over the provision of healthcare in Canada, both explicitly (hospitals) and through judicial interpretation (“matters of a merely local or private nature,” as well as authority over insurance). The Canada Health Act (CHA) does provide a national framework (supported by federal transfer funds) that has, for several decades, ensured a certain level of congruence across provinces in the provision of public healthcare. But each province’s health legislation is unique, and it is this interplay between federal and provincial legislation that provides a regulatory space for private healthcare. Variation across provinces means private healthcare in Canada is not a uniform phenomenon.

    The objectives of this Commentary are fourfold: first, to describe the ways we can understand “private” healthcare; second, to explain the different ways provincial legislation permits or prohibits aspects of private healthcare; third, to discuss the supply- and demand-side variables causing private healthcare to take its current shape across provinces; and fourth, to analyze the relationship between provincial healthcare legislation and the CHA with reference to the expansion of private healthcare in Canada. This Commentary does not address the utility of private healthcare per se. Rather, it focuses on the confusion inherent in so many discussions referencing “private healthcare.” Both exponents and critics of private healthcare can pick and choose from numerous manifestations of private healthcare to support their respective positions. By requiring proponents and opponents to clarify precisely what they mean by “private healthcare,” the potential costs and benefits can be more clearly identified in each case.

    What do we mean by “Private Healthcare”?

    Critics of private healthcare point to the costs and inequities of the American healthcare system to argue against it, while proponents reference European mixed public/private models to show how effective it can be. Any discussion of the role of private healthcare should therefore first clarify what, precisely, is meant by “private healthcare.” Healthcare systems can generally be broken down into three constituent parts: delivery, financing, and regulation. Any of these elements can include a public or private (for-profit or not-for-profit) component (Wendt et al. 2009; Böhm et al. 2013; Marchildon 2022).

    Delivery of Healthcare Services

    Much healthcare in Canada is delivered by private providers. When medicare was introduced in Saskatchewan in 1947, physicians vehemently protested. A settlement was reached only when the province agreed to recognize physicians as private independent operators rather than as employees of the state (Marchildon 2020). This model was followed by other provinces as they introduced their own medicare legislation. Ambulance services across Canada are often private, with these companies negotiating service contracts with health authorities or provinces. Nursing care in hospitals and district nursing programs is generally provided publicly, but private nursing firms (such as the not-for-profit VON for home care, or for-profit firms supplying temporary placements in hospitals) are also commonly utilized.

    Historically, hospitals in Canada (especially those founded by religious orders) were largely based on a private, independent, not-for-profit model. As hospitals became amalgamated into health authorities, they were consolidated in provincial governments’ financial statements and their operation was generally subsumed within the public infrastructure – even as many (especially larger) hospitals with boards of directors remain not-for-profit organizations.

    Key Takeaways

    What, exactly, is a “not-for-profit” (NFP) organization in Canada, and how does it differ from a private or a public one? Legally, NFPs are “bodies corporate without share capital”: in other words, revenues must be directed to the mission of the organization rather than to shareholders. NFPs also enjoy specific tax breaks. Unlike fully public bodies, however, they are self-governing. Generally, they will have boards of directors who are accountable for funds raised and debts incurred. Like directors in a private company, these directors have a fiduciary responsibility to use resources wisely. Unlike private companies, directors of NFP organizations are directly responsible to the corporate entity rather than to members (i.e., shareholders). The corporate entity, in turn, is responsible to the government jurisdiction (federal or provincial) wherein it is incorporated.

    Increased attention has been paid to private surgical companies. Individual medical specialists are generally considered independent private operators who contract their services to medical facilities or universities, although their payment models often include elements such as base salary, research stipend, fee for service, etc. Surgical specialists have in many provinces established discrete private businesses where bulk services (a specific number of certain surgical services) are provided over a set period for a negotiated price (e.g., the Shouldice Hernia Centre in Ontario or Scotia Surgery in Nova Scotia). They may use public infrastructure (hospital operating rooms) or provide their own physical space. There is considerable debate whether contracting these services is superior to establishing them as part of the public system (e.g., Day 2023; Lewis 2022; Longhurst 2023). However, as the funding and administration of these services is controlled by provinces (or provincial health authorities), and as patients use these services as they would fully public services (i.e., free at point of delivery), they are not considered a “two tier” form of access to healthcare. Patients cannot access these services directly; rather, they are routed through the public system. Grey areas of private service delivery, described in more detail below, include the private delivery of medically necessary diagnostic services, infusion clinics on hospital sites, and certain forms of virtual care.

    Also relevant to the discussion of private delivery is the type of private entity under consideration. “Private” hospitals that are not-for-profit may in fact operate more like a public institution than a private one; here one might usefully distinguish institutions which are functionally embedded in provincial healthcare system (e.g., via accounting practices) from those that operate at arm’s length. Conversely, evidence from the United States suggests private not-for-profit hospitals can also show the kind of profit-driven behaviour more commonly seen in for-profit entities (Silver-Greenberg and Thomas 2022). Others have argued that small independent private health clinics (such as Algomed or Bluenose, in Canada) are in a different category from large American corporate entities (such as the Hospital Corporation of America) (Deber 2003).

    Financing of Healthcare Goods and Services

    As noted, some privately provided services (such as ambulance services or surgical clinics) are often funded publicly. And, while it is not as common, publicly provided services can be funded privately (e.g., in systems where money follows the patient, private insurers may be able to find places for their patients in publicly funded hospitals). Charitable NFP organizations can be another source of healthcare funding. In Canada, much attention is paid to the division of healthcare into services that are, or are not, insured publicly. For example, the provision of cosmetic surgery (undertaken for aesthetic reasons) is commonly private, and is paid for privately and directly out-of-pocket. The private provision of services that are publicly funded (such as cataract or hip replacement surgery), as noted, is more controversial, but is not uncommon within Canada. The main point of controversy in Canada is whether publicly insured services should also be available for direct purchase to individuals within the private sector, bypassing the public system altogether.

    Out-of-pocket financing in Canada is largely targeted to healthcare services that are not covered by public insurance (the precise list of insured versus non-insured services varies across provinces). Only 12.6 percent of Canadian healthcare expenditure in 2021 was comprised of out-of-pocket spending (WHO 2023); the remainder was covered by public or private insurance.

    So how is healthcare insurance structured in Canada?

    Public insurance: In all provinces, most medically necessary healthcare services are largely funded on a tax-based model, where citizens support healthcare services through their general tax contributions. Some provinces do require provincial inhabitants to pay “healthcare premiums” but, as these contributions simply go into the provinces’ general operating funds, rather than a bespoke account used only for healthcare, these premiums can be considered simply as another form of taxation. As a condition of receiving federal health transfers, the CHA requires that each province has a public insurer. Böhm et al. (2013) argue, for this reason, that states such as Canada and Australia, which are structured on a public insurance system, are more properly considered to possess “national health insurance systems” rather than “national health systems,” as typified by the UK.

    Each province has the authority to determine what it insures publicly (which is why coverage for “medically necessary services” varies across provinces). In general, medically necessary services provided by physicians and in hospitals are covered (as required by the CHA) but, as explained below, this is much more complicated than it appears. Services such as vision care and dental care provided in hospitals are also generally covered, as are diagnostics, physiotherapy, and other related services.

    Provinces are not required to cover everyone: those in the armed forces or federal penitentiaries, for example, are insured by the Government of Canada. Although provincial healthcare systems provide many of the services for these specific groups, the provinces are reimbursed by the federal government. Those injured in the workplace are usually covered by workers’ compensation. Certain categories of migrants (such as refugees) are also insured federally until they receive permanent citizenship status, whereupon they fall under provincial insurance. Depending on the type of work and the length of stay, migrant workers are insured both through provincial health plans and workers’ compensation programs (for a fuller discussion, see Fierlbeck and Marchildon 2023).

    Most provinces expand public health insurance beyond what is required by the CHA. While the CHA does not specifically mandate the public provision of dental care, optometry services, and pharmaceuticals outside of hospitals, provinces generally have some form of coverage of these services for vulnerable groups. These are determined either by cohort (e.g., seniors or children), service (pharmacare or dental care), income category (below a certain ceiling), or some combination of all three. These programs vary considerably across provinces.

    Private health insurance: Formally, there are several types of private health insurance, each serving a different function.

    • Supplementary health insurance covers any goods or services that are not covered by public insurance. In Canada, these include companies like Blue Cross, Sun Life, or Canada Life Assurance. Any healthcare system incorporating public insurance will also have an array of private and private not-for profit supplementary health insurance companies which generally cover vision care, physiotherapy, pharmaceuticals, travel insurance, etc.
       
    • Complementary health insurance completes the cost of a service, where public or social insurance only pays partial costs. In many countries, for example, public insurance will only cover around 60 percent – 80 percent of hospital stays, pharmaceuticals, primary care, and sometimes even emergency care. In these cases, private insurance will “top up” the remaining costs so patients do not have to pay out-of-pocket. Some insurers may ask patients to pay the remaining costs up front, and reimburse them after the fact; others may cover the costs at point of payment. This “top up” system is not common in Canada, but in Quebec (which mandates pharmacare insurance) private insurers are allowed to cover any co-pays for pharmaceuticals that patients must pay directly for amounts not covered by the mandated insurers.
       
    • Substitutive health insurance applies in systems (e.g., in Germany) where citizens earning above a set income are allowed to opt out of public insurance systems altogether, and use private for-profit insurance to cover medical needs.
       
    • Duplicative (or “dual” or “parallel”) health insurance is the source of most political controversy in Canada. Duplicative insurance privately covers services that are also offered in the public sector. Four provinces (Ontario, Manitoba, Alberta, and PEI) explicitly prohibit duplicative insurance, three (Saskatchewan, British Columbia, and Quebec) explicitly permit duplicative insurance under certain conditions (i.e., only for certain services, only if the insurer is private not-for-profit, only for services provided by practitioners outside of the public system), and three (Newfoundland, Nova Scotia, and New Brunswick) neither expressly permit nor prohibit it (Appendix Table A2).1 The advantage for those with duplicative insurance is that they can access these services quicker, or access more enhanced variants of these services. It is really with this particular kind of private insurance that the issue of “two tier” healthcare arises. The argument in favour of duplicative insurance is that it “takes pressure” off of the public system (e.g., Globerman 2020), while other research has found that public wait times actually increase when publicly insured services become privately available. One reason given for this is the depletion of resources from the public sector. Policy analysts also suggest that those offering private services have incentives to keep public wait times longer, as patients will only find private services attractive if they cannot easily access them in the public sector (e.g., Besley et al. 1998; Duckett 2005). Countries such as the UK that permit duplicative insurance nonetheless continue to have considerable issues with long wait lists in the public health system (e.g., Duncan et al. 2023).
       
    • Private not-for-profit insurance: Another category of health insurance that causes much confusion is statutory health insurance (SHI; also referred to as “social health insurance” or the “Bismarck health system”). This system is quite common in Europe, although the precise configuration varies across states. In this model, health insurance is not covered in the first instance through general taxation revenue. Rather, workers and employers pay into “sickness funds,” which provide health insurance benefits depending on the terms negotiated. These sickness funds are technically “private” bodies operating on a not-for-profit basis. They are, however, highly regulated in their authority and function. Because of the degree of regulation – and the importance of the social function they fulfill – they are generally considered a form of “public” insurance. However, governments tend to differ in their approach to consolidating these operations into government expenditures.2  Jurisdictions using this model of health insurance have different methods for covering unemployed or retired persons, often including funds directed from government taxation revenue or from pooled sickness funds.

    Regulation of Healthcare Financing and Delivery

    The nature of “private” healthcare is determined not only according to the way services are delivered or funded but, more importantly, according to the way they are regulated. Permitting a “private” form of health service or insurance is not an all-or-nothing condition; governments have the authority to determine the terms and conditions under which these services are to be offered. There can, for example, be limitations on the kinds of services offered or insured, on the professions allowed to offer them, on the prices that can be set for them, where they can be provided, and so on. These limits, as discussed below, can be enough to discourage the provision of health services even when these services are technically legal, as the terms within which private services are allowed may not be sufficiently profitable. In the European Union (EU), governments are more restricted in their ability to regulate private healthcare services because, ultimately, the ethos of the EU is to maintain the free movement of goods and services. Fully public health services are under the authority of member states but, where states utilize private components in their healthcare systems, attempts to limit the ability of private health firms to compete can result in charges of breaching fair-competition regulations. In Canada, however, there are fewer restrictions on the limits that provinces can place on private health providers, given the political will to do so. The regulatory aspects of healthcare financing and delivery will be addressed in more detail in the next section.

    Private-public Partnerships

    Another category of “private” healthcare is the implementation of private-public partnerships (P3s) in healthcare (McKee et al. 2006). In the past, this has been limited to large capital projects, such as the construction of hospitals, but more recently the implementation of P3s has expanded to the point where verdicts on their effectiveness can be rendered. Importantly, there is no single model of public-private partnerships; each is generally negotiated on its own terms. Proponents explain the logic of this approach as capturing the advantages of both systems: governments can access more competitive financing for projects, while firms undertake the process of construction more efficiently with each day of overrun increasing the cost of a project. Critics argue that the logic of P3s rests in the effectiveness of offloading costs to the other partner, and that the party with the most expertise in negotiating P3 contracts (generally large multinational firms with experience in this area) are those who are most able to shift costs. At the same time, because P3 projects allow costs to be diffused over a long period of time, budget-conscious governments have been eager to enter into these agreements.

    Empirical evidence suggests that the effectiveness of P3 projects in Canada has been quite varied (Murphy 2008; Vining and Boardman 2008; Siemiatycki 2015). More recently, provinces have expanded the use of P3s to include large outlays for medical infrastructure. These agreements, often known as “value partnerships” or “managed equipment service agreements,” generally focus on diagnostic equipment – providing MRIs, CT scans, and X-rays – and they range from 15 to 30 years. The private partner will source, install, and maintain this equipment over the life of the agreement. As the private partner owns the equipment and covers the cost of installation, there are minimal upfront costs for the public partner. Other advantages of this model include a reduction in equipment downtime, decreased administrative burden in monitoring equipment maintenance, protection from unpredictable costs involved in equipment failure (CADTH 2022), and a replacement plan for equipment that reaches the end of its recommended useful life. At the same time, long-term service contracts can diminish flexibility in accessing different equipment over the lifespan of the contract, and the private contractor may demand confidentiality agreements which could diminish the transparency and accountability of the process. Like other forms of P3s, the effectiveness of managed equipment services will largely depend on the specifics of negotiated agreements, including clearly defined outcomes and expectations, as well as transparent and accountable protocols and public scrutiny of this documentation (CADTH 2022).

    Internal Markets

    While “internal markets” are not formally an aspect of private healthcare per se, they frequently arise in discussions of the utility of private healthcare mechanisms in the reform of public healthcare. Most famously employed in the Thatcherite reforms of the National Health Service in the United Kingdom, this model simply divides public healthcare professionals into “purchasers” of acute care services (usually primary care professionals) and “providers” of acute care services (usually hospitals). The theory underlying the purchase-provider split is that GPs will select the best value for money, obliging hospitals to compete by offering quality services for less. While the results of Britain’s experiment with the internal market are mixed at best (for a discussion of the internal market reforms see, e.g., LeGrand, Mays, and Mulligan 1998; and Ham 2007), a number of other countries (such as the Netherlands) have since incorporated this mechanism into their own healthcare systems.

    Conclusions

    The nature and extent of private healthcare provision has always been a subcurrent in discussions of Canadian healthcare. As Flood and Archibald clearly demonstrated in 2001, however, the precise nature of private healthcare depends upon the structure of provincial legislation. In general, provinces with a critical mass of population and wealth had to be more actively restrictive in their policy instruments regarding private healthcare, with smaller provinces able to enjoy a more liberal legal framework safe in the knowledge that low demand would make the opportunity immaterial. While legal frameworks are generally holding firm, the practice and context of healthcare provision have been changing rapidly. Both supply and demand pressures are making private healthcare more available and more attractive to those requiring healthcare.

    This Commentary has not discussed the provision of duplicative private health insurance in Canada. The experience of post-Chaoulli Quebec has shown that the demand for duplicative insurance is still limited given the current policy framework (see Quesnel-Vallée et al. 2020). Nonetheless, if private service provision becomes widespread, and the demand remains constant (or increases), provinces that permit private insurance (but have not experienced demand) may well see its tentative development within their jurisdictions, while provinces where duplicative insurance is proscribed may experience greater political pressure to allow it.

    Laverdière (2023) has argued that a “plausible interpretation” of the CHA is that “transfer reductions can only occur when the public system in a province or territory does not provide satisfactory access to medically necessary services.” This is not an incorrect observation per se; it merely confuses the legal and political aspects of the CHA. Whether provinces have met the contractual conditions to expect the funds set out by Ottawa is a largely technical matter. The success that Health Canada has had in eliminating extra billing and user fees under sections 18 and 19 is illustrative of the utility of a clear and specific set of requirements that are monitored and enforced (with the added incentive that provinces can recoup any past losses if they make prospective changes). More complicated are the charges that provinces have been non-compliant with the CHA beyond sections 18 and 19. Because provinces have considerable authority in determining key terms like “medically necessary” or “insured services,” it is difficult to make justiciable claims against provinces for non-compliance more broadly. The contest over diagnostic services and virtual care will be an interesting one. But the terms of the dispute are more political than legal. As in the past, the federal government is using the CHA as a political statement to affirm its commitment to public healthcare; as such, the legal outcome of the controversy may be less important than the political battle.

    Is the CHA obsolete? The demand that the CHA should be revised, either to prevent or facilitate private healthcare, is misplaced. The instruments determining the extent of private healthcare largely rest, as they always have, with the provinces and the political will of their electorates. In the past, the best barrier to privatization has been an effective and responsive public system. For this reason Ottawa’s role in funding provincial healthcare remains paramount. Provinces have the legislative tools to constrain the growth of private healthcare, if that is their objective. Similarly, provinces have considerable authority to increase the scope of private healthcare, if that is their objective (even within the current parameters of the CHA), by revising provincial legislation or regulation.

    Either way, the specific policy direction undertaken would be different for each jurisdiction, as legislation and other barriers to private healthcare (such as market size) vary across provinces. For example, should Ontario wish to expand the private provision of healthcare, it could simply rescind sections 15(a) of the Ontario Health Insurance Act and section 10(3) of the Commitment to the Future of Medicare Act (along with the corresponding regulations). To expand the scope of private healthcare, the nine provinces that already allow physicians to opt out of the public insurance system have a number of mechanisms at their disposal. These include permitting physicians to charge above the current fee schedule where that is now explicitly prohibited, reimbursing patients who use private-sector physicians where they do not already do so, or permitting “dual” or “duplicative” insurance where it is currently prohibited. The greatest effect would be in the wealthier and more populous provinces where a critical mass of individuals who would be willing to pay to access these services would make private healthcare a viable commercial venture. The scope for expanding private healthcare in smaller provinces is more restricted, but still could be facilitated by, for example, allowing physicians to bill above the public fee schedule.

    Similarly, provinces can use legislative mechanisms at their disposal to further restrict the expansion of private healthcare by, for example, refusing to reimburse patients who have paid physicians directly for services listed as “insured services” (as some already do). Doing so could also potentially expand private healthcare by increasing the number of non-participating physicians (who are outside the purview of the CHA). However, this could in turn be addressed by restricting the fee schedule of non-participating physicians or, like Saskatchewan, by permitting liberal private care only up to the point that it is deemed to undermine public care. Moreover, simply by changing the definition of “insured services” from “medically required services provided by physicians” to “medically required services provided by physicians and nurse practitioners” (which can in some jurisdictions be done through orders-in-council alone), some provinces could forestall the expansion of private nurse-practitioner-run clinics. Provinces can also control the precise scope and nature of additional private healthcare services by tightly regulating the specific terms under which these services are permitted. Quebec, for example, has for years allowed private health insurance only for specific procedures; Saskatchewan permits private health insurance, but only if offered by non-profit entities. Privatization, in this way, does not necessarily entail a “wild west” of unrestricted commercial ventures. At the same time, provinces that pursue this route will also have to commit considerable resources for monitoring and ensuring compliance (where currently most provinces simply utilize a complaint-driven system).

    Canada’s unique federal system means that fears of privatization can also be useful in leveraging more funding from Ottawa. Rather paradoxically, provinces have an incentive not to contain the growth of private healthcare within their borders in order to make the case that more public funding is necessary. At the same time, Ottawa has agency with regard to going beyond the mandated provisions of sections 18 and 19. It could demand provinces cleave to the spirit of the CHA by publicly insuring services regardless of whether they are provided in the way they were when medicare was first conceived. Ultimately, however, governments are responsive to their electorates. The legal intricacies that exist in the nexus of provincial legislation and the CHA will always remain secondary to the wider political opposition to, or support for, private healthcare. To engage in this political debate, however, it is important to understand clearly what private healthcare is and is not, and how it manifests within the legislative landscape of each jurisdiction. For the Silo, Katherine Fierlbeck.

    Dr. Fierlbeck is cross-appointed to the Department of Community Health and Epidemiology, the Department of International Development Studies, and the European Studies Program at Dalhousie University. She is a Senior Research Fellow at the Healthy Populations Institute, and is on the research committee for the MacEachen Institute for Public Policy.

    How To Reboot Ottawa’s Zero Emission Vehicle Mandate

    The federal government has proposed regulations requiring the sale of a minimum numbers of Zero Emission Vehicles (ZEVs) in Canada (20 percent of all light vehicles in 2026, ramping up to 60 percent in 2030 and 100 percent in 2035). The flip side of this requirement is that the sale of internal combustion engine (ICE) light vehicles will be reduced and eventually prohibited in 2035.

    • This ZEV mandate will require an increase in ZEV sales from about 100,000 ZEV light vehicles in 2022 to 300,000 in 2026, 900,000 in 2030 and 1.5 million in 2035.
    • This paper examines whether or not Canadians will be able to buy enough ZEVs (either domestically produced or imported) to meet this ZEV mandate requirement. The findings show that Canada should be able to meet the 2035 100 percent ZEV mandate for about 270,000 passenger cars (only 18 percent of the market) but will be unlikely to meet the 2035 ZEV mandate for the 1,240,000 remaining light vehicles (pickup trucks, vans and SUVs/crossovers) comprising 82 percent of the market.
    • Canada cannot wait until 2035 to realize that the federal ZEV mandate will not be met. The gap between light-vehicle demand and forecasted ZEV light-vehicle supply will cause severe market disruptions. A better approach would be to reject a hardline ZEV mandate and instead to substitute a more flexible Plan B. Plan B should focus more on emissions rather than ZEV targets. For example, permitting some ICE light vehicles to be sold, particularly ones that can use renewable fuels. In addition, permitting plug-in hybrids (PHEVs) and hybrids to be included as ZEVs.
    • Finally, the federal government may have to accept that the 100 percent ZEV target is not feasible by 2035, and therefore must include flexibility in the federal ZEV mandate to back away from the 100 percent ZEV target.

    A ZEV mandate is government legislation that imposes a requirement on the sellers of light vehicles to sell a certain minimum of ZEVs in a year. (ZEV is used interchangeably with BEV for battery electric vehicle in this paper. PHEVs can also qualify as ZEVs to a limited extent). The theory is that this minimum requirement will give certainty to vehicle sellers that there will be a market for ZEVs, and will therefore give an incentive to companies to construct ZEV manufacturing facilities. In essence, the ZEV mandate assumes that the demand for ZEVs will be there and will displace the demand for ICE light vehicles, and therefore the increase in supply of ZEVs will occur.

    The federal government has introduced a ZEV mandate for all of Canada. In December 2022, the federal government issued proposed regulations under the Canadian Environmental Protection Act (CEPA). Section 30.3 of these proposed regulations state that all sales of light vehicles (passenger cars, pickup trucks, vans and SUVs/crossovers) must meet the thresholds for ZEV sales in a year shown in the table to the right.

    Minimum Percentage of ZEV sales

    The flip side to a ZEV mandate is that it imposes a prohibition on the sale of ICE vehicles, plus a penalty for contravening this prohibition. A company selling light vehicles in effect has an ever-shrinking quota for the maximum number of ICE light vehicles that it can sell in a year (none in 2035).

    A company creates one credit for each battery electric vehicle (BEV) it sells. A sale of a PHEV with a range of more than 80 kilometres can also create a credit, but this ability is capped at 20 percent from 2028 onward. For example, a company selling 100 percent PHEVs in 2028 would only get credits for 20 percent.

    If a company’s sales create fewer credits than required by the ZEV mandate, it can still remain in compliance by using two mechanisms. First, it can buy credits from another ZEV company that has exceeded its ZEV mandate. This mechanism will likely provide hundreds of millions of dollars of extra revenue to companies such as Tesla. An alternative second mechanism would allow the company to create a credit by contributing about $20,000 to specified ZEV activities such as supporting charging infrastructure. This second mechanism is capped at 10 percent of the ZEV mandate for the particular year, and is only available for the years prior to 2031.

    For the Silo, Brian Livingston/The C.D. Howe Institute.

    The author thanks Benjamin Dachis, Daniel Schwanen, Dave Collyer and anonymous reviewers for comments on an earlier draft. The author retains responsibility for any errors and the views expressed.

    Canada’s Surging Non-Permanent Resident Population Crisis

    Mahboubi, Skuterud – A Multi-Pronged Strategy for Managing Canada’s Surging Non-Permanent Resident Population
    January, 2024 – Recent years have seen an unprecedented increase in Canada’s non-permanent resident population, far surpassing increases in annual admissions of new permanent residents. This unbalanced growth in the two migration streams will inevitably result in a growing undocumented population and forced deportations. Both developments risk inflaming Canada’s immigration politics and undermining public confidence in the immigration system. It is imperative that the government take immediate steps to stem the ongoing growth in foreign student and temporary foreign worker entries. Here’s how it can do it.

    Recent years have seen an unprecedented increase in Canada’s non-permanent resident (NPR) population far surpassing increases in annual admissions of new permanent residents. This unbalanced growth in the two migration streams will inevitably result in a growing undocumented population and forced deportations. Both developments risk inflaming Canada’s immigration politics and undermining public confidence in the immigration system.  

    It is imperative that the government take immediate steps to stem the ongoing growth in foreign student and temporary foreign worker entries.

    Several factors have contributed to the NPR population surge, including ad-hoc programs aimed at expanding eligibility for permanent status, the well-documented postsecondary appetite for international tuition revenue, and eased employer access to temporary foreign workers, most notably in low-wage occupations.

    Statistics Canada estimates that by the fourth quarter of 2023, Canada’s non-permanent population had exceeded 2.5 million, while entries of new permanent residents remained below 500,000 and which the government has announced will stabilize in 2025. The tightening bottleneck in temporary-to-permanent residency flows is worsened because many permanent slots go to applicants residing abroad, not non-permanent residents.

    A key factor driving the growth in non-permanent inflows is the government’s repeated announcements of ad hoc programs aimed at easing the pathway to PR status for lower-skilled migrants who would otherwise struggle to clear the hurdle of the Express Entry skilled-based points system.

    Examples include the February 2021 decision to provide permanent status to all economic class candidates in the applicant pool regardless of their eligibility scores and the April 2021 provision of pathways to 90,000 “essential workers” including cashiers and truck drivers. And the government expanded the program in January 2023 to give PR status to undocumented construction workers and plans to broaden the program, allowing all undocumented people to apply for permanent status. 

    No wonder large numbers of migrants try their luck.

    But given limited permanent admissions, large numbers of justifiably hopeful NPRs will be unable to realize their dreams. As their study and work permits expire, many will be unable or unwilling to return to their home countries. This leaves them increasingly vulnerable to workplace exploitation, which can distort wage outcomes in lower skilled labour markets, and leaves them in poverty with no recourse to government supports because they are ineligible.

    Canada urgently requires a multipronged strategy to stem this ongoing NPR growth and restore the stability and integrity of the immigration system. In our view, policies should be aimed at helping applicants make better decisions about seeking NPR status in Canada by offering a straightforward, predictable system against which they can realistically assess their prospects.

    On international students, we recommend reintroducing the cap on off-campus work at 20 hours a week that was waived in October 2022 and recently extended to April 30. Continued policy punting is unhelpful in restoring predictability for prospective foreign students. Study permits have become de facto work permits, and brings job-seekers, not committed students.

    We also recommend restricting study permits to institutions of a certain standard. Designated Learning Institutions (DLIs) whose students are currently ineligible for Post-Graduate Work Permits should also be ineligible for study permits. The government should also revoke designation based on the measured immigration and labour market outcomes of an institution’s graduates. Those outcomes should be regularly published by the immigration department to help prospective migrants make informed decisions and combat false dreams pushed by education recruiters.  

    On temporary workers, extended measures allowing, for example, 30 percent of certain workforces to be low-wage temporary foreign workers, need reconsideration. Stemming the growth in the Low-Wage Stream of the Temporary Foreign Worker Program and restoring the pre-2020 hiring regulations recognizes recent evidence of adverse effects of this program on wages and local unemployment rates.

    Most important, the government needs to bring back predictability in its permanent resident admission system in the economic-class applicant pool. Though well intentioned, the one-off programs easing the pathway to permanent status are contributing to temporary resident explosion. The department needs to return to its Comprehensive Ranking System as it did before 2020. The transparency of its points system and a stable minimum eligibility score over time will mean that applicants can see what skills or training they need for entry, thereby advancing the objective of our skilled immigration program.

    If these policy levers are collectively applied, they can stem the unhealthy growth in Canada’s non-permanent population, restore fairness and transparency in the permanent admission stream, and secure the immigration system’s integrity and sustainability. In doing so, we can ensure that Canada continues to be a welcoming and prosperous country for all. *note this article was sent as a letter by the C.D. Howe Institute authors to  The Honourable Marc Miller, Minister of Immigration, Refugees and Citizenship Canada.

    Parisa Mahboubi is a senior policy analyst at the C.D. Howe Institute. Mikal Skuterud is a professor of economics at the University of Waterloo, director of the Canadian Labour Economics Forum and a fellow-in-residence of the C.D. Howe Institute.

    Investor-State Disputes Proliferating, Rules Remain Critical for Canada Business Investment

    May 9, 2023 – Investor-state disputes are proliferating around the globe as business investors seek redress for government actions they deem unfair or contrary to investment agreements, according to report from the C.D. Howe Institute. In “Investor-State Disputes: The Record and the Reforms Needed for the Road Ahead,” author and C.D. Howe Institute Senior Fellow Lawrence L. Herman reviews the record of investor-state dispute settlement (ISDS) procedures, the criticisms directed at them, and the reforms required.

    “Despite concerns and criticism, ISDS procedures in international investment agreements are an important development in global governance that should continue to be a part of our international fabric,” says Herman.

    Herman examines both Canadian and global cases involving ISDSs, which give private parties the right to bring binding arbitration against governments under International Investment Agreements (IIAs). These rights can be invoked when investors allege a lack of fair and equitable treatment, discrimination or expropriation without adequate compensation contrary to a country’s treaty obligations.

    “ISDS has become a significant feature for investments, particularly into developing countries in many parts of the world,” according to Herman.

    “However, because of the rights given to private parties, these agreements have become increasingly controversial – especially in an era of increasingly expanding governmental measures on climate change, sustainability, human rights and other issues impacting foreign investors and their investments in one way or another.”

    In response to these concerns, multilateral, regional and bilateral efforts are making continuing improvements to ISDS mechanisms when it comes to efficiency, transparency and aspects such as permanent appointments and a system of appeals.

    “While some countries have embarked on a program of terminating their bilateral investment agreements, these agreements will continue to remain as a part of the international fabric in many parts of the globe,” says Herman. “They are an important development in global governance and, even if not perfect, they not going to disappear in spite of concerns and criticisms.”

    Creating permanent rosters of tribunal members as well as adding an appellate review processes to existing IIAs would help improve ISDS procedures. Short of this, Herman says ongoing efforts could include: i) promoting model arbitration clauses to reduce legal uncertainty and enhance consistency and predictability of outcomes; ii) developing codes of conduct and best practices for adjudicators plus rules to ensure their independence; and iii) making sure appointments to tribunals are of highest quality. Governments should also publicly support the value of third-party arbitration as an objective and neutral process that leads to peaceful resolution of differences, he adds.

    Ultimately, investment protection treaties are about risk mitigation with host states bound by treaty to respect obligations of fair and equitable treatment and other rule-of-law standards and providing investors with a degree of assurance, says Herman. “While there are legitimate questions about the process and whether and to what degree investment treaties accomplish these objectives, these suggestions can assist in providing ways forward,” he concludes.

    There are some 2,500 international investment agreements (IIAs) in force around the world, whether as stand-alone treaties or incorporated into bilateral or regional free trade agreements (FTAs). They are a significant feature of the international business scene.

    A main feature of these agreements is to allow foreign investors to invoke binding arbitration where it is alleged that the host governments have breached fair and equitable treatment and other treaty obligations towards the investors. This is known as Investor-State Dispute Settlement or “ISDS”.

    The process gives foreign investors comfort that if things go wrong in host countries, they have recourse to neutral, third-party dispute resolution. It thus provides important elements of risk reduction for foreign investors and their investments, notably aiding the flow of capital from industrialized countries to the developing world.

    There has been dramatic escalation of investor arbitration claims over the last two decades. This makes it timely and useful to review the situation, looking at the value of ISDS as well as the criticisms that have emerged over the years. The conclusion is that IIAs and the arbitration process are valuable parts of the corpus of international order and will remain an integral part of the international business scene for the foreseeable future. The issue facing governments, therefore, is how to respond to criticisms by improving, as opposed to abandoning, the ISDS process. This paper suggests some pragmatic ways forward.

    A Canadian company, First Quantum Minerals, and the government of Panama are reported to have settled a long-standing tax dispute allowing the company to resume operations at the Cobre Panama mine in that country. Earlier reports were that if the dispute was not resolved by negotiation, the company would invoke arbitration rights under the Canada-Panama Free Trade Agreement.

    Had the dispute proceeded, it would have been another example of hundreds of arbitrations that have proliferated around the globe, initiated under various international investment agreements (IIAs) that give private parties the right to bring binding arbitration against governments under Investor-State Dispute Settlement ( ISDS) procedures. Those rights can be invoked, for example, where investors allege lack of fair and equitable treatment, discrimination or expropriation without adequate compensation contrary to that country’s treaty obligations.

    In addition to investment treaties, numerous free trade agreements incorporate separate investment dispute settlement provisions, including the former North American Free Trade Agreement (NAFTA); the Canada-EU trade agreement (CETA); the Trans-Pacific Partnership (CPTPP) Agreement; and bilateral free trade agreements, such as those between Canada and countries like Chile and South Korea, among others.

    As a consequence, ISDS has become a significant feature of the ground rules for investments in many parts of the world, particularly those made into developing countries. Because of the rights given to private parties, these agreements have become increasingly controversial, especially in an era of expanding governmental measures on climate change, sustainability, human rights and more that impact foreign investors and their investments.

    In light of these developments, it is useful to briefly update the ISDS record with regard to Canada, look at what lessons might emerge, both in the global and the Canadian context, and suggest some elements to monitor as we go forward.

    Criticisms Of ISDS Agreements

    As investor arbitrations have proliferated, so have the criticisms, making ISDS one of the more controversial aspects of global governance. Here are some of the main ones:

    • IIAs have given private companies broad rights to challenge host-country actions that can fall within legitimate fields of public regulation, especially now in an era of decarbonization and other national crises like COVID 19.
    • The process involves one-way litigation, with no corresponding right of host countries to bring arbitration cases against investors for disregarding laws, practices and standards of business conduct.
    • The growth of third-party financings of investor claims has stimulated, or at least encouraged, the initiation of ISDS cases.
    • Investment agreements bypass the customary international law norm that requires claimants to first exhaust local remedies before bringing an international claim against a host country.
    • The ISDS structure is defective because its ad hoc tribunals – put together to hear a particular case – make long-term, binding decisions affecting laws or policies enacted for the public interest.
    • Arbitrators’ decisions are final and binding with no avenue of appeal, whether on errors of fact or of law.
    • Because of its ad hoc nature, the system lacks institutional continuity. Public confidence in the system suffers.
    • Arbitrators are appointed from a small — if not closed – pool of international lawyers who are free to act for private interests as counsel in other cases, leading to appearances of conflict and adding to diminished public confidence in the process.7

    There are answers to these critiques but the over-arching response, as alluded to above, is that resolving investor-state disputes based on legal norms within an accepted procedural framework remains a significant achievement in the progressive development of international law. As observed in one analysis,

    “During the last decade a number of the shortcomings have indeed been addressed and remedied. It is reasonable to assume that this has been done – at least partially – based on the realisation that investment treaty arbitration is the most efficient and reliable dispute settlement mechanism for disputes between foreign investors and host States. There is simply no better, realistic alternative.”8

    As already mentioned, ISDS in its various manifestations provides an important element of stability and risk insurance when investing in jurisdictions where legal rules may not be mature or respected, aiding the flow of capital to developing countries and thus presumably helping to meet the international community’s aid and development goals. The system may not be perfect, but efforts are afoot to improve it at many levels.

    For the Silo, Lawrence Herman/C.D. Howe Institute.

    The author thanks Daniel Schwanen, Charles-Emmanuel Côté, Rick Ekstein, Ari Van Assche, Gus Van Harten and anonymous reviewers for comments on an earlier draft. The author retains responsibility for any errors and the views expressed.

    How Do Canada Provinces Grade In Taxpayer Fiscal Transparency?

    September 15, 2022 – Taxpayers and citizens need greater fiscal transparency from Canada’s federal, provincial and territorial governments, says the latest report from the C.D. Howe Institute.

    In “The Right to Know: Grading the Fiscal Transparency of Canada’s Senior Governments, 2022,” William B.P. Robson and Nicholas Dahir graded these governments’ budgets, estimates and financial statements on how well they let legislators and voters understand their fiscal plans and hold them to account for fulfilling them. The grades range from A to D. While some of the governments present helpful and timely budgets and financial statements, others fall badly short.

    The authors underline that budgets, estimates and financial statements must let interested but non-expert users find and understand and act on key information.

    “Taxpayers’ and citizens’ ability to monitor, influence and react to how legislators and officials manage public funds is fundamental to representative government,” say Robson and Dahir. “We need to check that legislators and government officials are acting in the interest of the people they represent, and we need to respond if we conclude that they are acting negligently or in their own interest. Financial reports are key tools for monitoring governments’ performance of their fiduciary duties.”

    image: Prime Minister of Canada Justin Trudeau website. Link to Transparency PDF: https://pm.gc.ca/en/news/backgrounders/2015/11/27/open-and-accountable-government

    While much of the financial information presented to legislators and the public by Canada’s governments has improved over time, the assigned grades reveal significant shortfalls. This year’s report card covers year-end financial statements for fiscal year 2020/21 and budgets and estimates for 2021/22. The results were as follows:

    • Manitoba, British Colombia and the Northwest Territories trailed the the class with grades of D;
    • The federal government got a D+ – which was actually an improvement from an F last year, when it failed to produce a budget;
    • Newfoundland and Labrador also got a D+;
    • Nova Scotia scored a C and Prince Edward Island scored a C+;
    • Quebec scored a B- and Ontario scored a B;
    • Nunavut, Saskatchewan, and New Brunswick each scored B+;
    • Alberta and Yukon topped the class with grades of A and A- respectively.

    These governments tax, spend and borrow hundreds of billions of dollars, and the fiscal impact of the COVID-19 pandemic will make their financial position all the more important in the future. The authors conclude: “This annual report card hopes to encourage further progress and limit backsliding. Canadians can get more transparent financial reporting and better fiscal accountability from their governments, if they demand it.” For the Silo, Lauren Malyk.

    For more than 60 years, the C.D. Howe Institute has researched and published on policy challenges and potential solutions aimed at improving the performance of Canada’s economy and raising Canadians’ living standards.

    Read the Full Report

    Featured image via GIFT- The Global Initiative for Fiscal Transparency

    Threat to Prosperity: Canada Should Mind Business Investment Gap

    August, 2022 – Business investment in Canada is so weak that capital per member of the labour force is falling, and the implications for incomes and competitiveness are ominous. Governments, particularly the federal government, need to get serious about growth to get workers more of the tools they require to compete and thrive, according to a new report from the C.D. Howe Institute.

    In “Decapitalization: Weak Business Investment Threatens Canadian Prosperity”, authors William B.P. Robson and Mawakina Bafale write that since 2015 Canada’s stock of capital per available worker has been declining and its rate of gross investment per worker has been well below that in the United States and other OECD countries.

    Capital= Business “bread and butter”

    They examine why Canada might be lagging as well as what action to take.

    “Business investment and productivity are closely related: productivity growth inspires investment by creating opportunities, and investment drives productivity growth by equipping workers with more and better tools,” says Robson. “Investment per available worker lower in Canada than abroad tells us that businesses see less opportunity in Canada, and prefigures weaker growth in Canadian earnings and living standards than in other OECD countries.”

    New investment per available worker in Canada, adjusted for purchasing power, was only slightly above 50 cents for every dollar of investment per available United States worker in 2021 – lower than at any point since the beginning of the 1990s. In addition, in 2022, OECD projections show that Canadian workers will likely enjoy only 73 cents of new capital for every dollar enjoyed by their counterparts in the OECD excluding the US, according to Robson and Bafale.

    The authors’ calculations from OECD projections for 2022 show $20,400 of new capital per available worker this year for OECD countries excluding the United States, compared to $14,800 for Canada.

    In other words, new capital per available worker in Canada will be more than one-quarter less than in those countries this year.

    Declines in the stock of machinery and equipment (M&E) and intellectual property (IPP) per member of the workforce are particularly worrisome, the authors explain, because those types of capital may be particularly important for economy-wide productivity. “Whatever special messages the recent M&E and IPP numbers may convey, the message from stocks of business capital overall is clear: the average member of Canada’s labour force began 2022 with less capital to work with than she or he had in 2014,” says Bafale.

    Robson and Bafale identify a few probable causes for Canada’s dismal investment performance. These include: weak business in the natural resource industries; restricted access to finance for small and mid-size firms; a loss in Canada’s competitive edge in business taxation, notably against the United States; an uncongenial environment for IP investment; regulatory uncertainly; unpredictable fiscal policy; and governments’ in-house spending and transfers to households that are steering resources into consumption and housing rather than non-residential investment.

    Is business investment capital trajectory predetermined?

    “The prospect that Canadians will find themselves increasingly relegated to lower value-added activities relative to workers in the United States and elsewhere, who are raising their productivity and earnings faster, should spur Canadian policymakers to action,” conclude Robson and Bafale. “The first step is to recognize that recent trends are a symptom of threats to Canada’s prosperity and competitiveness – that low business investment is a problem that governments can and should address.”

    Supplemental- Are you a small Canadian business frustrated with the difficulties involved in accessing capital? For example, our experience has shown that the multitude of Business Development Corporations operate with autonomy but without accountability, poor vision and nepotism. Essentially, gleaning business plans and strategies before revealing ‘jump through these application hoops” which include personal finance and personal life details. It is sobering to discover that they also receive a hefty commission % for every applicant they ‘certify as successful’. Do you agree or have you had a more positive experience? We want to hear from you in the comments below.

    Reboot Canadian Content Policy For Digital Age Says C.D. Howe Institute

    Canada should ditch Canadian content tools that are ill-suited for the digital age, says a new report from the C.D. Howe Institute.

    Image result for author Daniel Schwanen
    Daniel Schwanen

    In “Choosing Canada: Canadian Cultural Policy in the Twenty-first Century” author Daniel Schwanen sets out a plan to bring Canadian content policy into step with developments such as the emergence of digital competitors for Canadian viewers, including Netflix, Spotify and YouTube.

    Unfair Competition

    These digital competitors, notes Schwanen, are unconstrained by Canadian content requirements facing traditional TV or radio distributors. The consequence is a “slow bleed” in audiences for licensed TV broadcasters and radio stations while audiences for non-regulated digital channels (many based outside Canada), are rising sharply.

    Trends

    These trends negatively impact the revenues of traditional conduits for culture and information as advertising revenues migrate to digital channels. Compounding burden on traditional broadcasters, regulators maintain out-dated quotas of Canadian content in prime time and requirements to help fund Canadian TV and film production, whereas their emerging competitors on digital platforms are not subject to these rules. Furthermore, foreign online services such as Netflix are not required to charge their Canadian customers the Goods and Services Tax, unlike their Canadian competitors.

    Image result for disney+

    “As Canadians embrace new technologies and platforms to access their entertainment and information, the ability of quotas to affect Canadians’ viewing or listening habits is rapidly diminishing,” said Schwanen. Indeed, 2013 marked the first year in which the number of Canadian households subscribing to internet services exceeded the number of traditional television subscribers. Although 75 percent of Canadian households still subscribed to cable or satellite television distribution services in 2016 – down markedly from 83 percent only four years before – 87 percent of Canadian households subscribed to internet services. In the economy more generally, the culture, entertainment and information services offered online through digital technologies have boomed relative to other economic activities, and in particular relative to traditional cultural and information businesses.

    What Is True Demand?

    The report proposes an approach focused on more deliberately linking offerings of Canadian content with the potential demand for them. The report’s recommendations for regulators include:

    • Focusing the funding framework for public cultural agencies and cultural subsidies, including that of the CBC, on the production, dissemination, and exhibition of original artistic or literary works for which a commercial market is not yet established or for which there is a clear public rationale (e.g., educational, informational, or community benefits).
    • Establishing an arms-length “Canadian Connections Fund” that would replace some existing subsidies with support for initiatives that promote non-commercial Canadian content with Canadian audiences.
    • Working with Canadian broadcasters and distributors to facilitate the “discoverability” of Canadian content on digital platforms (through, e.g., search engine optimization, targeted online advertising, mobile applications, and the translation of Canadian works for both foreign and domestic audiences).
    • Eliminating mandated funding of Canadian content and Canadian content quotas for broadcasters while ensuring a level playing field for federal taxation applicable to digital media services purchased by Canadians
    • Reducing foreign investment restrictions applying to cultural industries, with the aim of attracting investment in Canada.

    Read the Full Report